Meta-Analysis
. 2015 Sep 24:3:41.
doi: 10.1186/s40168-015-0104-7.

The role of breast-feeding in infant immune system: a systems perspective on the intestinal microbiome

Affiliations
Meta-Analysis

The role of breast-feeding in infant immune system: a systems perspective on the intestinal microbiome

Paurush Praveen et al. Microbiome. .

Abstract

Background: The human intestinal microbiota changes from being sparsely populated and variable to possessing a mature, adult-like stable microbiome during the first 2 years of life. This assembly process of the microbiota can lead to either negative or positive effects on health, depending on the colonization sequence and diet. An integrative study on the diet, the microbiota, and genomic activity at the transcriptomic level may give an insight into the role of diet in shaping the human/microbiome relationship. This study aims at better understanding the effects of microbial community and feeding mode (breast-fed and formula-fed) on the immune system, by comparing intestinal metagenomic and transcriptomic data from breast-fed and formula-fed babies.

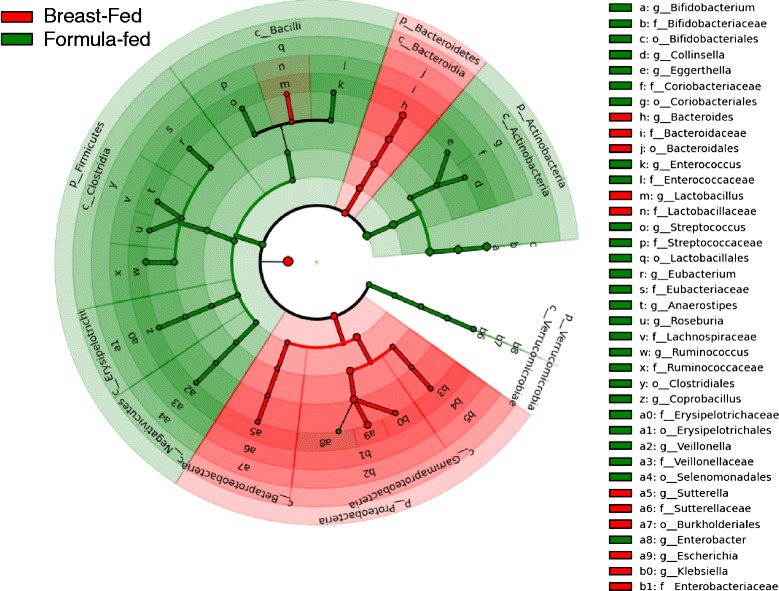
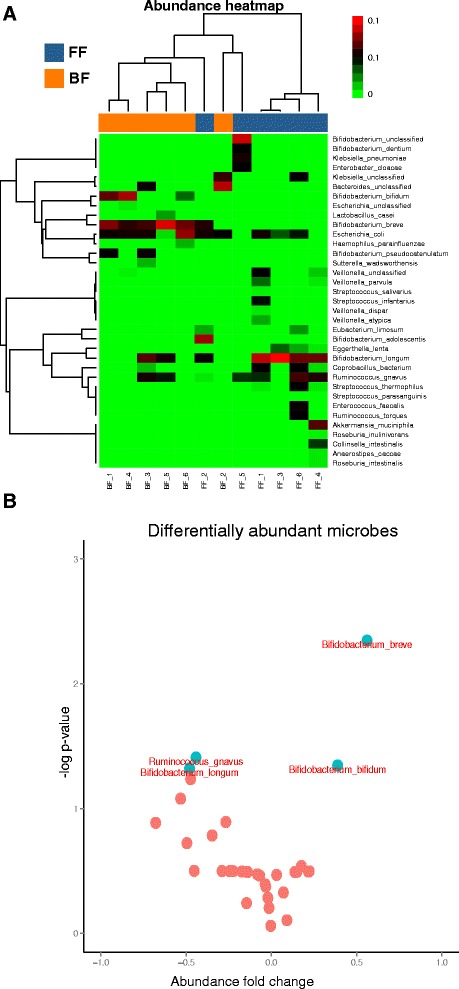
Results: We re-analyzed a published metagenomics and host gene expression dataset from a systems biology perspective. Our results show that breast-fed samples co-express genes associated with immunological, metabolic, and biosynthetic activities. The diversity of the microbiota is higher in formula-fed than breast-fed infants, potentially reflecting the weaker dependence of infants on maternal microbiome. We mapped the microbial composition and the expression patterns for host systems and studied their relationship from a systems biology perspective, focusing on the differences.

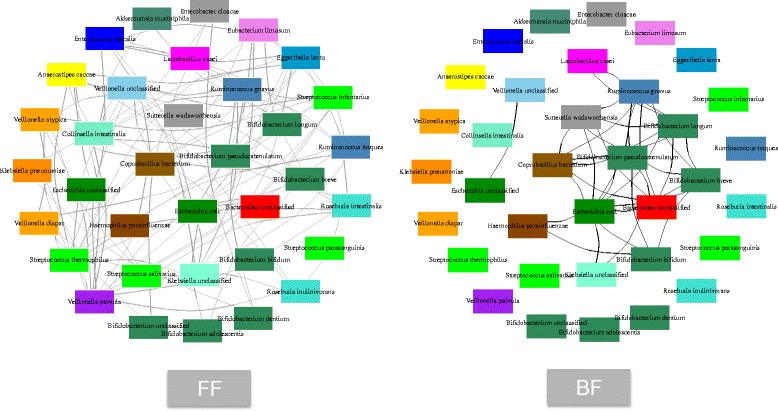
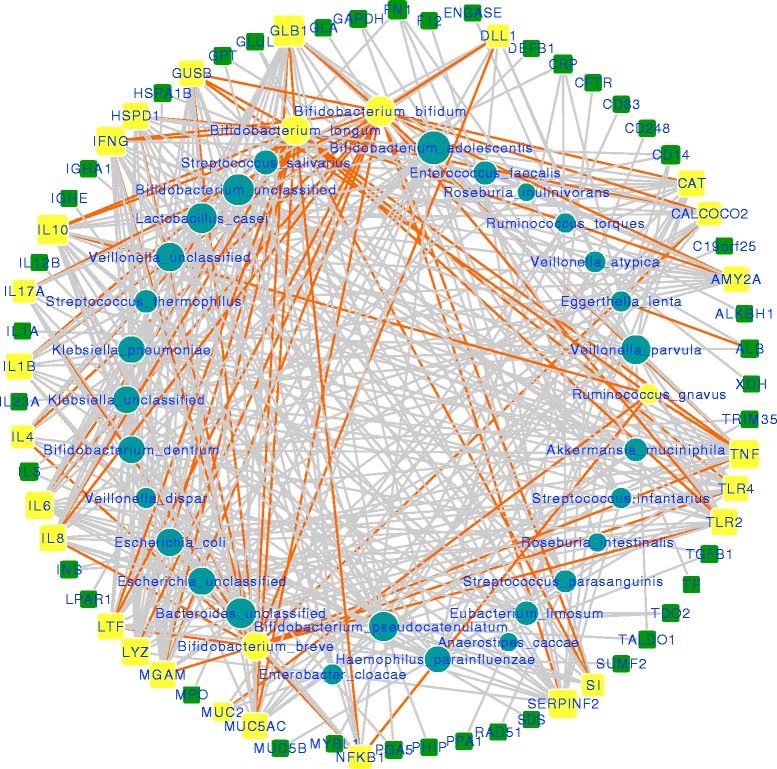
Conclusions: Our findings revealed that there is co-expression of more genes in breast-fed samples but lower microbial diversity compared to formula-fed. Applying network-based systems biology approach via enrichment of microbial species with host genes revealed the novel key relationships of the microbiota with immune and metabolic activity. This was supported statistically by data and literature.


Figures

Fig. 1
Fig. 1
The LEfSe plot for clades of the microbiota under breast-fed (BF) and formula-fed (FF) conditions. The cladograms report the taxa (highlighted by small circles and by shading) showing different abundance values (according to LEfSe). Colors of circle and shading indicate the microbial lineages that are enriched within corresponding samples. LEfSe highlights several genus-level clades, e.g., the class Bacilli is under-abundant in BF samples with an otherwise over-abundant Lactobacillus lineage (indicated with a red shade over green for indices m and n (see adjacent legend)). A contrary example can be seen in case of Enterobacter (indexed as a8)
Fig. 2
Fig. 2
a The heatmap showing the abundance of microbes at species level, in breast-fed and formula-fed infants. Green and red shades indicate lower and higher percent abundances, respectively, with species along the Y-axis and samples along X-axis. The clustering was performed with the “Ward” method based on Pearson scores. b Scatter plot representing the log p values (Y-axis) and fold changes (X-axis) for microbial abundance to detect the differentially abundant bacterial species. The blue-green circles indicate the differentially abundant microbial species under FF and BF conditions
Fig. 3
Fig. 3
The microbiome co-abundance networks based on Bray-Curtis similarity under FF and BF conditions. Node color indicates the genera of the organisms as shown in the legend. The “unclassified” in the species name refers to the sequences that could be attributed to more than one species with equal likelihoods. The isolated nodes represent the absence of co-occurrence among the species
Fig. 4
Fig. 4
The microbial species and human gene relationships mined from literature in the form of a bipartite network. The size of nodes indicate the degree of vertices, i.e., the number of vertices connected to it. The yellow circles represent differentially abundant microbes, and yellow squares are the host genes that showed a literature-based relationship with these microbial species. The orange-colored edges connect differentially abundant microbes with their related host genes. A network restricted only to selected vertices in the graph is in Additional file 1
Fig. 5
Fig. 5
a Pearson correlation between the microbial abundance and the expression levels of associated human genes obtained via text mining and also found to be differentially expressed. The relationship with human genes for each microbial species is in Fig. 4. The microbial species marked with asterisk (*) are differentially abundant. The black horizontal line is the mean of absolute Pearson correlation coefficient between randomly generated pairs of genes and microbes. The missing sample (BF or FF) had an NA as correlation values due to zero abundance or zero standard deviation in any of the random variables. b The top GO terms (Biological Process) for human genes related to microbial species. The width of sectors represents the number of associated terms in the corresponding categories, and the radius indicates the number of genes annotated with corresponding terms
Fig. 6
Fig. 6
a Plot showing the distribution of shortest path lengths of a host gene-microbe network under FF and BF conditions. The left skewed distribution of BF networks with smaller diameter (14) shows the small-world properties of the network and a higher robustness (against perturbation) compared to the right skewed FF network with a diameter of 20. b The plot represents the number of nodes that can be reached (Y-axis) after traversing through certain path lengths, (here 1, 2, and 3 along X-axis). The node type referred here are the “DE genes” (differentially expressed genes) from gene expression data, “Species” are the microbes, and “Transient” nodes are the genes mined from literature that were found to share relationship with microbial species. The corresponding networks are available as a network file in Additional file 1 and Additional file 3 (can be opened in cytoscape) and as figures in Additional file 1

References

    1. Sommer F, Bäckhed F. The gut microbiota? Masters of host development and physiology. Nat Rev Microbiol. 2013;4:227–38. doi: 10.1038/nrmicro2974. - DOI - PubMed
    1. Claesson MJ, Cusack S, O’Sullivan O, Greene-Diniz R, de Weerd H, Flannery E, et al. Composition, variability, and temporal stability of the intestinal microbiota of the elderly. Proc Natl Acad Sci. 2011;108(Suppl 1):4586–91. doi:10.1073/pnas.1000097107. http://www.pnas.org/content/108/Supplement_1/4586.long. - PMC - PubMed
    1. Claesson MJ, Jeffery IB, Conde S, Power SE, O’Connor EM, Cusack S, Harris HMB, Coakley M, Lakshminarayanan B, O’Sullivan O, Fitzgerald GF, Deane J, O’Connor M, Harnedy N, O’Connor K, O’Mahony D, van Sinderen D, Wallace M, Brennan L, Stanton C, Marchesi JR, Fitzgerald AP, Shanahan F, Hill C, Ross RP, O’Toole PW. Gut microbiota composition correlates with diet and health in the elderly. Nature. 2012;488(7410):178–84. doi: 10.1038/nature11319. - DOI - PubMed
    1. Matamoros S, Gras-Leguen C, Vacon FL, Potel G, de La Cochetiere M-F. Development of intestinal microbiota in infants and its impact on health. Trends Microbiol. 2013;21(4):167–73. doi: 10.1016/j.tim.2012.12.001. - DOI - PubMed
    1. Koenig JE, Spor A, Scalfone N, Fricker AD, Stombaugh J, Knight R, Angenent LT, Ley RE. Succession of microbial consortia in the developing infant gut microbiome. Proc Natl Acad Sci U S A. 2011;108(Suppl):4578–85. doi: 10.1073/pnas.1000081107. - DOI - PMC - PubMed

Publication types