

doi: 10.1038/srep14455.
Optimization of neuronal cultures from rat superior cervical ganglia for dual patch recording
Affiliations
- PMID: 26399440
- PMCID: PMC4585864
- DOI: 10.1038/srep14455
Item in Clipboard
Optimization of neuronal cultures from rat superior cervical ganglia for dual patch recording
Sci Rep.
.
Abstract
Superior cervical ganglion neurons (SCGN) are often used to investigate neurotransmitter release mechanisms. In this study, we optimized the dissociation and culture conditions of rat SCGN cultures for dual patch clamp recordings. Two weeks in vitro are sufficient to achieve a significant CNTF-induced cholinergic switch and to develop mature and healthy neuronal profiles suited for detailed patch clamp analysis. One single pup provides sufficient material to prepare what was formerly obtained from 12 to 15 animals. The suitability of these cultures to study neurotransmitter release mechanisms was validated by presynaptically perturbing the interaction of the v-SNARE VAMP2 with the vesicular V-ATPase V0c subunit.
Figures
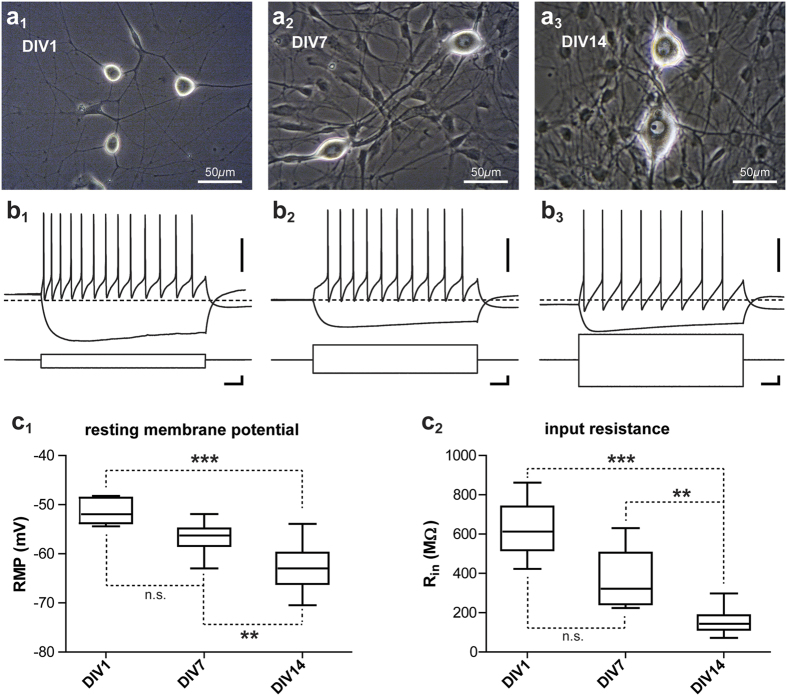
(a) Photomicrographs of SCGNs and surrounding non-neuronal cells at DIV1, DIV7 and DIV14 respectively for a1, a2 and a3. Neurons are easily identifiable by their big bright somata. Note the increase in neuronal soma size during this period. (b) Electrical profiles of DIV1, DIV7 and DIV14 neurons (for a1, a2 and a3 respectively) submitted to hyperpolarizing and depolarizing steps of current, scale bar 40 mV, 100 pA and 200 ms for each. The dashed-line represents −60 mV. (c) Evolution of SCGN resting membrane potential (c1) and input resistance (c2) from DIV1 to DIV14. Each box is delimited by the first and third quartiles and is crossed by the median value. The ends of the bars are the lower and the minimal values. The Kruskal-Wallis test was used to compare the evolution of input resistance and resting membrane potential over the 3 age groups as these parameters were not normally distributed in all groups. Then Dunn’s multiple comparison test was used as a post-test to compare all the groups between themselves.**P < 0.01, ***P <0 .001, n.s., Not Significant.
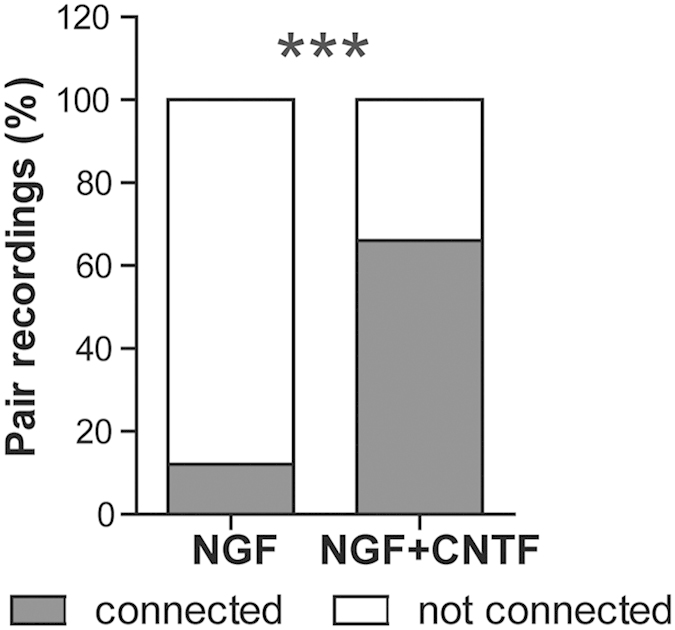
Stacked bars plots showing the percentage of pair recordings with connected and unconnected neurons in the presence or absence of CNTF in the culture medium. When CNTF was added to the culture media at DIV2, the neuronal connectivity tested by pair recording at DIV14–17 increased from 12 to 66%. The Fisher exact test was used to compare the proportion of connected neurons in the 2 groups. Statistics were done on numerical values (7 out of 57 connected pairs for NGF vs 38 out of 58 when CNTF was added) and not the percentage as presented on the plot.
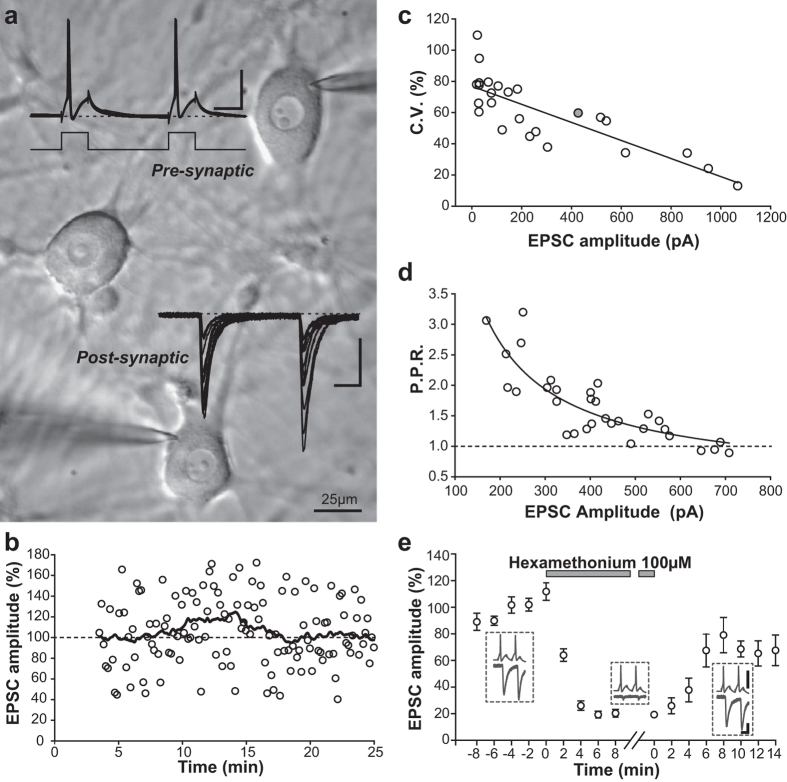
(a) Photomicrograph (magnification 40×) of patched SCG neurons. Recording microelectrodes are visible on connected neurons in the upper and lower part of the image. EPSCs (post) evoked by individual spikes in the presynaptic neuron (pre) were recorded and superimposed on the photomicrograph (twelve traces are represented). Scale bars 40 mV, 20 ms and 200 pA. Dashed lines represent −60 mV and 0 pA respectively for the pre-synaptic and the post-synaptic element. (b) Normalized amplitude of the EPSC monitored over time for a typical neuronal pair. Each empty circle represents the amplitude of a single EPSC after a single AP and illustrates the trial-to-trial variation in the response. Only the amplitude of the first action potential was plotted over time. The black line is the smoothed running average (every two minutes) of the normalized EPSC amplitude. For all the duration of the recording, this average value stayed close to the base line level (100%) represented by the dashed-line. (c) Plot of the coefficient of variation (CV) as a function of EPSCs amplitudes for the 26 neuronal pairs recapitulated in Table 2. The relation well fitted with a linear regression y = a*x + y0 where a = −0.0579 and y0 = 76,9 (r2 = 0.66). (d) Plot of the amplitude of the first EPSC for the gray neuronal pair shown in (c) as a function of the paired-pulse ratio. Paired-pulse facilitation was observed for EPSCs below 300 pA while paired-pulse depression seem to take place for EPSCs larger than 600 pA. This plot was well fitted by the equation y = (a/x) + y0 where a = 459 and y0 = 0.4 (r2 = 0.71). (e) Normalized EPSC amplitudes for the first action potential monitored over time for five connected pairs of neurons before, during and after Hexamethonium application. Average response and s.e.m. are represented every 2 minutes. Insets before, during and after hexamethonium application represent the corresponding average traces over 1 minute intervals (6 traces) for double pulse stimulations. Scale bars are 40 mV, 20 pA and 20 ms. The plot shows an almost complete block by hexamethonium and a partial recovery of the response during its washout.
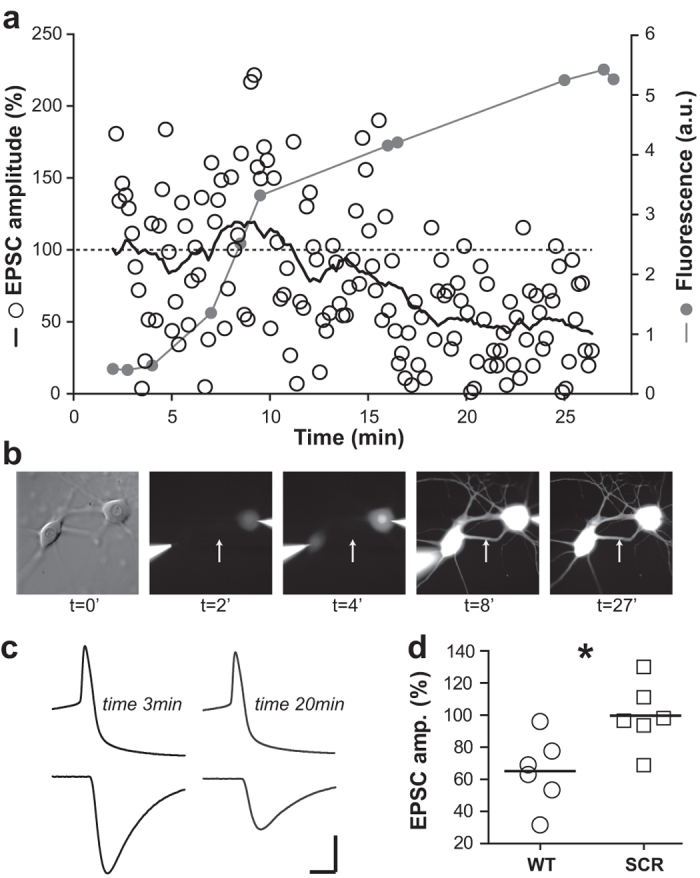
(a) Normalized EPSC amplitude monitored over time for the pair of neurons shown in b. Empty circles represent the amplitude of single EPSCs and the black line the smoothed running average (every two minutes) of these values. The dashed line represents the base line level (100%) of EPSC amplitude. Grey lines and circles represent the level of fluorescence measured over time on cell processes. Note that the intensity of this signal reaches approximatively half of its maximal value around 8–10 minutes exactly when the amplitude of the EPSC starts to decrease. (b) Photomicrographs of the recorded pair of neurons corresponding to the data shown in (a). Note the progressive increase of fluorescence intensity in the soma (t = 4′) and then in neurites (t = 8′ and 27′). The white arrow represents the position where the intensity of fluorescence illustrated in (a) was measured. (c) Pre- and post-synaptic signals at fast time-scale, before (3 min) and during L3.4 peptide injection (20 min). Scale bars are 4 ms, 40 pA, 40 mV. Note the decrease of EPSC amplitude while the AP shape is not affected by the peptide. An average of 6 traces is illustrated for each time. (d) Normalized EPSC amplitudes ± s.e.m. at 20–25 min in the presence of L3.4 peptide (WT) 65.2 +/− 8.9% or its scrambled form (SCR) 99.8 +/− 8.3 ; *P = 0.026 (Mann-Whitney U test). The horizontal bars represent the mean for each group.
References
-
- Plummer M. R., Logothetis D. E. & Hess P. Elementary properties and pharmacological sensitivities of calcium channels in mammalian peripheral neurons. Neuron 2, 1453–63 (1989). - PubMed
-
- Vivas O., Castro H., Arenas I., Elias-Vinas D. & Garcia D. E. PIP2 hydrolysis is responsible for voltage independent inhibition of CaV2.2 channels in sympathetic neurons. Biochemical and Biophysical Research Communications 432, 275–280 (2013). - PubMed
Publication types
MeSH terms
Substances
LinkOut - more resources
Full Text Sources
Other Literature Sources
