. 2015 Sep 24:6:8390.
doi: 10.1038/ncomms9390.

Highly multiplexed imaging of single cells using a high-throughput cyclic immunofluorescence method

Affiliations

Highly multiplexed imaging of single cells using a high-throughput cyclic immunofluorescence method

Jia-Ren Lin et al. Nat Commun. .

Abstract

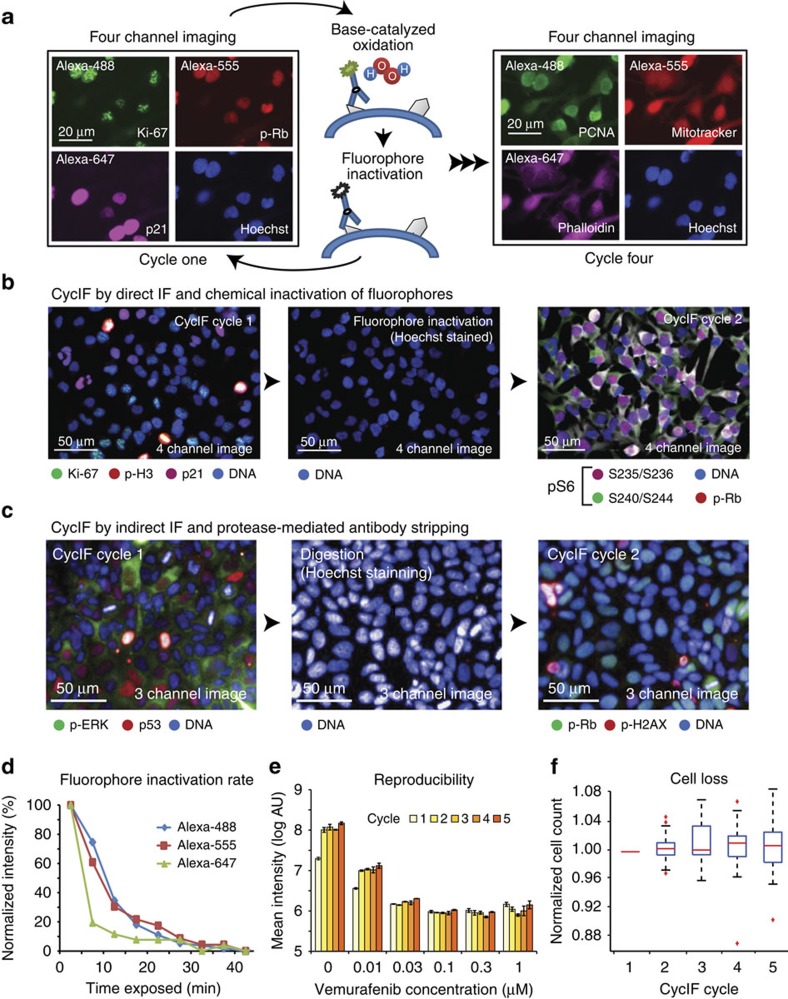
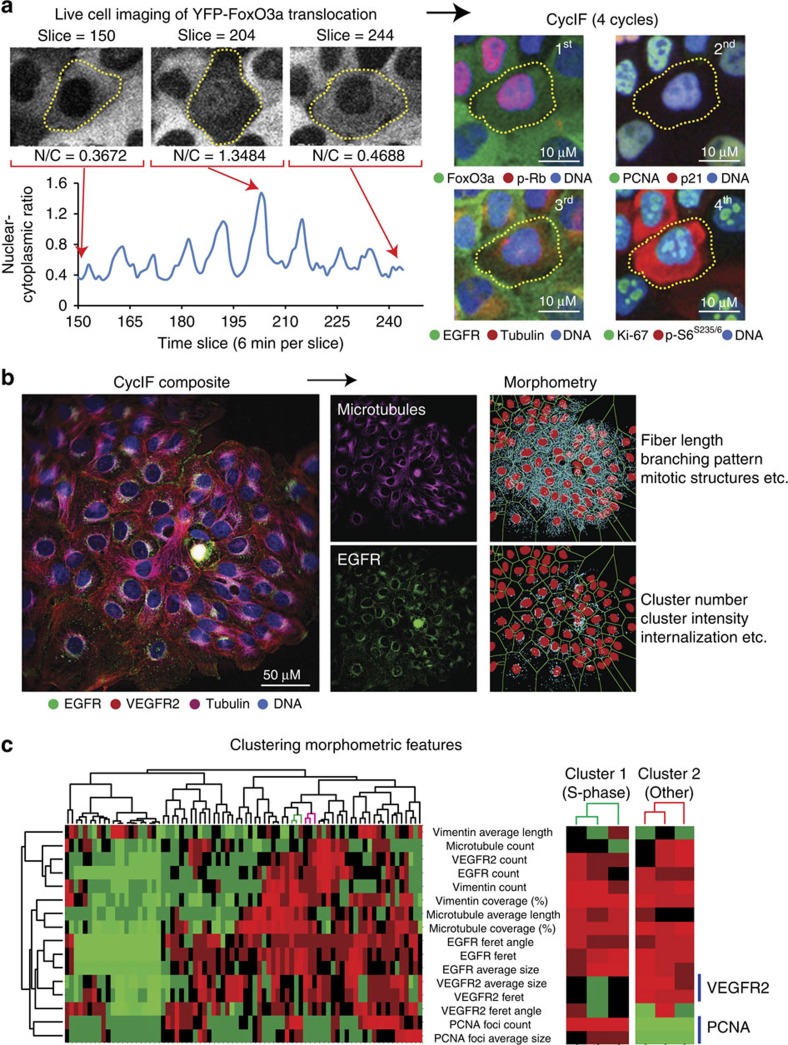
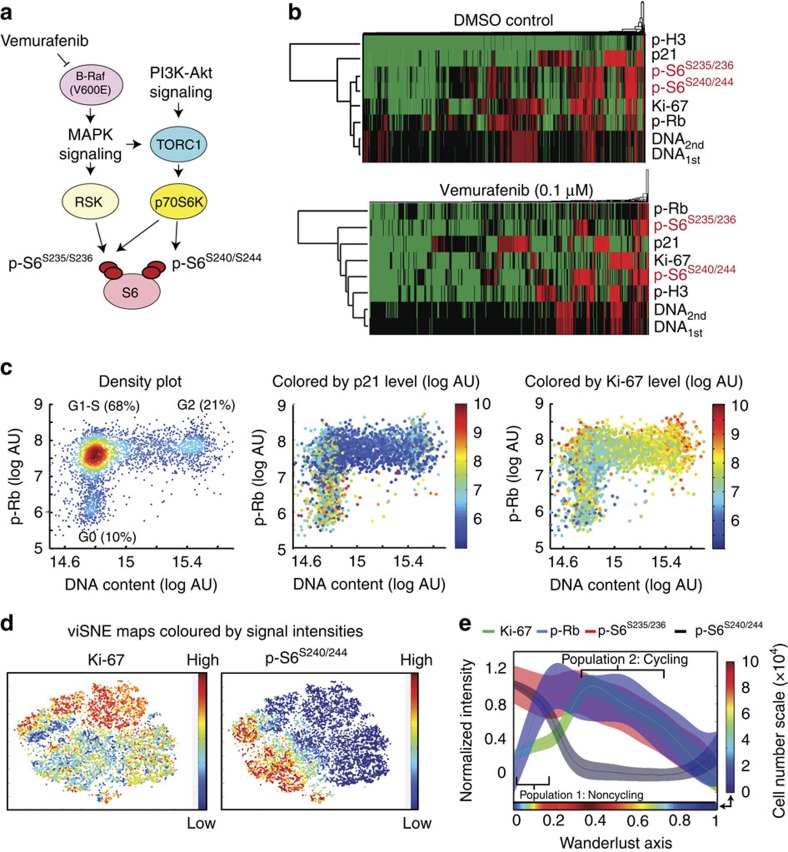
Single-cell analysis reveals aspects of cellular physiology not evident from population-based studies, particularly in the case of highly multiplexed methods such as mass cytometry (CyTOF) able to correlate the levels of multiple signalling, differentiation and cell fate markers. Immunofluorescence (IF) microscopy adds information on cell morphology and the microenvironment that are not obtained using flow-based techniques, but the multiplicity of conventional IF is limited. This has motivated development of imaging methods that require specialized instrumentation, exotic reagents or proprietary protocols that are difficult to reproduce in most laboratories. Here we report a public-domain method for achieving high multiplicity single-cell IF using cyclic immunofluorescence (CycIF), a simple and versatile procedure in which four-colour staining alternates with chemical inactivation of fluorophores to progressively build a multichannel image. Because CycIF uses standard reagents and instrumentation and is no more expensive than conventional IF, it is suitable for high-throughput assays and screening applications.


Figures

Figure 1
Figure 1. Multiplexed imaging of single-cell using Cyclic ImmunoFluorescence (CycIF).
(a) An overview of the CycIF procedure. Four-colour staining alternates with fluorophore inactivation by oxidation to progressively build a multichannel image. (b) CycIF procedure using direct immunofluorescence (with fluorophore-conjugated antibodies) and chemical inactivation of fluorophores. COLO858 melanoma cells were fixed and stained using antibodies for Ki-67 (Alexa 488), p-Histone H3 (Alexa 555), p21 (Alexa 647) and Hoechst (left panel). Cells were exposed to fluorophore-inactivation by oxidation using hydrogen peroxide, high pH and light and then reimaged (middle panel) to confirm efficient bleaching. Cells were then stained with fluorophore-conjugated antibodies for p-S6S240/244 (Alexa 488), p-RbS807/811 (Alexa 555), p-S6S235/236 (Alexa 647) and Hoechst. (c) CycIF procedure using indirect immunofluorescence and protease-mediated antibody stripping. MCF7 cells were fixed and stained using primary antibodies for p-ERK1/2T202/Y204 (rabbit), p53 (mouse), Alexa 488-conjugated anti-rabbit, and Alexa 647-conjugated anti-mouse secondary antibodies (left panel). Cells were digested with pepsin/papain mixture (see Methods for details) and reimaged (middle panel). Cells were restained using primary antibodies for p-RbS807/811 (rabbit), p-Histone H2A.XS139 (mouse), Alexa 488-conjugated anti-rabbit, and Alexa 647-conjugated anti-mouse secondary antibodies (right panel). (d) Bleaching rate for Alexa 488, 555 or 647-conjugated antibodies following incubation in a base-hydrogen peroxide mixture. (e) Correlation of signal intensities after using the same antibodies in successive CycIF cycles. Five-cycle CycIF was applied to COLO858 cells treated with increasing doses of vemurafenib (error bars show the range of biological duplicates). Cells were stained with Alexa 488-conjugated p-ERK antibody, and p-ERK signal intensities from different CycIF rounds were quantified and compared. Cells (1,000–2,000) were imaged for each condition and well mean intensity values across duplicates were reported. Error bars indicate s.d. (f) Quantification of cell loss based on Hoechst staining (averaged across n=30 different wells) through cycles of CycIF. Cell numbers from each well after each CycIF cycle were normalized to the mean cell number derived from cycle 1 and presented in box-and-whisker plots with mean values (shown by red lines), interquartile ranges (shown as boxes) and whiskers (representing the 1st/99th percentiles).
Figure 2
Figure 2. Compatibility of CycIF with live-cell imaging, analysis of subcellular localization of proteins and morphometric features.
(a) Applying CycIF at the end of FP-based live-cell imaging. Nuclear translocation of FoxO3a in MCF10A cells (stably expressing YFP-FoxO3a and mCherry-NLS) was monitored for 24 h (left panel). Red arrows indicate FoxO3a nuclear to cytoplasmic (N/C) ratios at two snapshots. Cells were then fixed and subjected to four-cycle CycIF using fluorophore-conjugated antibodies p-RbS807/S811 (cycle 1), p21 and PCNA (cycle 2), EGFR and β-tubulin (cycle 3) and Ki-67 and p-S6S235/6 (cycle 4) (right panel). (b) Morphometric analysis of CycIF-generated images of single cells. Three rounds of CycIF staining were performed as indicated in Supplementary Fig. S8. The raw intensity-based images of EGFR, VEGFR2, Tubulin, Vimentin and PCNA were then binarized and passed through different filters (sharpen, skeletonized and maximum, and so on) for extracting texture features (length, branches, enrichment and clusters). Two representative images/masks from Tubulin/microtubule and EGFR are shown here. Detailed methods and other images/masks could be found in Supplementary Information. (c) Single-cell clustering based on morphometric features. Sixteen different features were extracted from five different IF signals. The numerical values from features were used in hierarchical clustering of single cells (left panel). Two sub-clusters were displayed with distinct features generated from PCNA and VEGFR2 (right panel). The hierarchical clustering was performed in Matlab using Euclidean distance metrics and average linkage.
Figure 3
Figure 3. Multivariate single-cell analysis of BRAFV600E COLO858 melanoma cells using CycIF.
(a) Highly simplified schematic showing crosstalk between MAPK and PI3K/Akt/mTOR pathways at the level of S6 ribosomal protein phosphorylation. (b) Unsupervised clustering of single-cell 8-channel CycIF data in cells treated with DMSO or 0.1 μM vemurafenib for 24 h. The hierarchical clustering was performed in Matlab using Euclidean distance metrics and average linkage. (c) Scatter plots comparing three channels at a time (p-Rb, Hoechst, p21 and Ki-67) to determine the distribution of G0, G1/S and G2 cell cycle states. (d) viSNE-generated two-dimensional projections of the single-cell 8-channel CycIF data. Single-cell data are plotted in viSNE axes and coloured based on Ki-67 (left) and pS6S240/244 (right) signal intensities. (e) Wanderlust trace showing signal intensities for p-RbS807/811, pS6S235/236, Ki-67 and pS6S240/244 across a five-point vemurafenib dose–response (0–1 μM) data set. The colour-box on the bottom represents the cell densities while the colour scale is showed on the side.

References

    1. Liberali P., Snijder B. & Pelkmans L. Single-cell and multivariate approaches in genetic perturbation screens. Nat. Rev. Genet. 16, 18–32 (2015). - PubMed
    1. Singh D. K. et al. Patterns of basal signaling heterogeneity can distinguish cellular populations with different drug sensitivities. Mol. Syst. Biol. 6, 369 (2010). - PMC - PubMed
    1. Bendall S. C. et al. Single-cell mass cytometry of differential immune and drug responses across a human hematopoietic continuum. Science 332, 687–696 (2011). - PMC - PubMed
    1. Steininger R. J. 3rd et al. On comparing heterogeneity across biomarkers. Cytometry A 87, 558–567 (2014). - PMC - PubMed
    1. Bendall S. C. et al. Single-cell trajectory detection uncovers progression and regulatory coordination in human B cell development. Cell 157, 714–725 (2014). - PMC - PubMed

Publication types

MeSH terms

Substances