. 2015 Dec;130(6):815-27.
doi: 10.1007/s00401-015-1478-0. Epub 2015 Sep 23.

Histone H3F3A and HIST1H3B K27M mutations define two subgroups of diffuse intrinsic pontine gliomas with different prognosis and phenotypes

Affiliations

Histone H3F3A and HIST1H3B K27M mutations define two subgroups of diffuse intrinsic pontine gliomas with different prognosis and phenotypes

David Castel et al. Acta Neuropathol. 2015 Dec.

Abstract

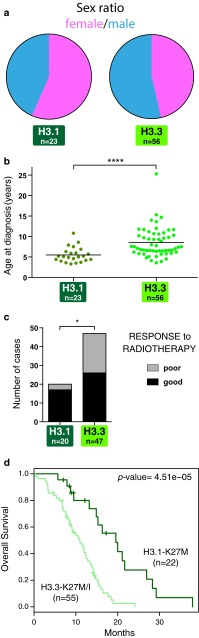
Diffuse intrinsic pontine glioma (DIPG) is the most severe paediatric solid tumour, with no significant therapeutic progress made in the past 50 years. Recent studies suggest that diffuse midline glioma, H3-K27M mutant, may comprise more than one biological entity. The aim of the study was to determine the clinical and biological variables that most impact their prognosis. Ninety-one patients with classically defined DIPG underwent a systematic stereotactic biopsy and were included in this observational retrospective study. Histone H3 genes mutations were assessed by immunochemistry and direct sequencing, whilst global gene expression profiling and chromosomal imbalances were determined by microarrays. A full description of the MRI findings at diagnosis and at relapse was integrated with the molecular profiling data and clinical outcome. All DIPG but one were found to harbour either a somatic H3-K27M mutation and/or loss of H3K27 trimethylation. We also discovered a novel K27M mutation in HIST2H3C, and a lysine-to-isoleucine substitution (K27I) in H3F3A, also creating a loss of trimethylation. Patients with tumours harbouring a K27M mutation in H3.3 (H3F3A) did not respond clinically to radiotherapy as well, relapsed significantly earlier and exhibited more metastatic recurrences than those in H3.1 (HIST1H3B/C). H3.3-K27M-mutated DIPG have a proneural/oligodendroglial phenotype and a pro-metastatic gene expression signature with PDGFRA activation, while H3.1-K27M-mutated tumours exhibit a mesenchymal/astrocytic phenotype and a pro-angiogenic/hypoxic signature supported by expression profiling and radiological findings. H3K27 alterations appear as the founding event in DIPG and the mutations in the two main histone H3 variants drive two distinct oncogenic programmes with potential specific therapeutic targets.


Figures

Fig. 1
Fig. 1
Loss of H3K27me3 as a defining characteristic of DIPG. Representative results of IHC for H3K27me3 (a) and H3-K27M (b) for a H3.3-K27M-mutated tumour. a An overall strong reduction of H3K27me3 is observed with a specific loss of the trimethylation mark in the nuclei of the tumour cells (arrows) while the staining is preserved in the nuclei of the normal cells (triangles). b H3-K27M-mutated proteins are detected in the nuclei of the majority of tumour cells (brown staining; arrows) with only few normal residual cells merely stained in blue (triangles) (scale bar 100 µm). c Plot summarizing the H3K27me3 (left) and H3.3-K27M (right) immunostaining on 62 DIPG biopsies together with their respective histone mutation status of lysine 27 of H3.1, H3.2 or H3.3 genes indicated by the colour of the ribbons. All but one sample showed either H3K27 trimethylation loss or a positive H3.3-K27M immunostaining (61/62; 98 %). The H3-K27M staining allowed detection of the vast majority (>90 %, 56/62) of H3.1- and H3.3-K27M-mutated tumours, and also the rare H3.2-K27M variant. It failed to detect the other rare H3.3-K27I-mutated sample. Overall, 59/62 specimens analysed showed a loss of the trimethylation mark including some histone wild-type (WT) samples (6). d Anatomical distribution of histone H3 mutations in 183 pHGG. WT tumours are found throughout the brain (grey) whereas H3.3-K27M mutants (d light green) are found in midline pHGG and H3.3-G34R/V (blue) are restricted to the cortex. H3.1-K27M substitutions appeared specific to DIPG tumours and the unique H3.3-K27I and H3.2-K27M found in our cohort also correspond to DIPG
Fig. 2
Fig. 2
Landscape of genomic alterations in H3.3- and H3.1-mutated tumours. Unsupervised hierarchical clustering and heatmap associated with the gene expression profile of the 23 DEGs (Benjamini and Hochberg adjusted p value <0.01) between H3.1- and H3.3-mutated subgroups. The main recurrent genomic alterations found by aCGH, the mutational status of histone H3F3A (light green), HIST1H3B (dark green) and ACVR1 (purple) as well as TP53 protein accumulation evaluated by IHC of the 39 primary tumour specimens analysed are reported above the heatmap. TP53 protein accumulation was found exclusively in H3.3 subgroup as well as most genomic imbalances of the corresponding genomic region 17p13.1. Loss of the cytoband 14q24 appears also more often in H3.3 samples whereas H3.1 tumours are characterized by a frequent gain of chromosome 1q and had significantly more aberrations of chromosome 2 (p value = 0.0062, Fisher exact test). Gene expression levels in comparison with normal brainstem are illustrated by varying shades of orange (upregulation) and blue (downregulation)
Fig. 3
Fig. 3
Integrated molecular and phenotypic portrait of H3.3 mutant DIPG. a Oligodendrocytic and proneural gene expression signatures. Gene Set Enrichment Analysis (GSEA) was conducted to identify gene sets that exhibited significant overlaps with gene overexpressed in the H3.1-mutated subgroup. The rank order of genes from the most upregulated (left, position 1) to the most downregulated (right, position 15,198) in H3.1 vs. H3.3 is shown in x-axis and the barcode illustrates the position of genes belonging to a particular gene set. The running enrichment score, generated by the cumulative tally of the gene set plotted as a function of the position within the ranked list of array probes, is shown as a green line. The total height of the curve indicates the extent of enrichment, with corresponding normalized enrichment score (NES) and false discovery rates (FDR) indicated. Upregulated genes in oligodendrocytes [9] and genes correlated with proneural type of GBM tumours [57] are enriched in H3.3 samples. Accordingly, histology and IHC showed a strong enrichment of tumour with an oligodendrocytic phenotype in H3.3-mutated samples (right panel, p value = 0.0019; Fisher exact test). b Preferential metastatic progression. GSEA analysis shows that the top genes inhibited in metastatic vs. non-metastatic bladder cancer cell lines [22] were also downregulated in H3.3 vs. H3.1 subgroups. c Complete clinical follow-up of 41 DIPG patients who had an MRI within the last 2 months of life shows that metastatic evolution was mostly observed in patients with H3.3-K27M mutation (p value = 0.04; two-sided Fisher exact test). d, e Enrichment of genes associated with ‘extracellular matrix receptor interaction’ (KEGG pathway) and ‘cell–matrix adhesion pathways’ (GO:0007160) in H3.3 vs. H3.1 mutant DIPGs
Fig. 4
Fig. 4
Integrated molecular and phenotypic portrait of H3.1 mutant DIPG. a Statistical significant enrichment of mesenchymal-like glioblastoma multiforme (GBM) [57] and astroglia [9] signatures was found in H3.1 tumours by GSEA analyses. Normalized enrichment score (NES) and false discovery rates (FDR) values are indicated. b A substantial overrepresentation of genes involved in angiogenesis pathway (biological process GO: 0001525) was identified in H3.1-mutated tumours (left panel). This was further confirmed by MRI data (right panel) displaying the percentage of samples within H3.1 or H3.3 subgroups associated with distinct contrast enhancement patterns as described in suppl. Fig S6. The distribution of samples within the four classes of patterns is significantly different between H3.1 (n = 23) and H3.3 (n = 49) subgroups (p value = 0.0234, Chi-square test) with a larger proportion of H3.1 samples presenting a large necrotic area. (CE contrast enhancement). c Accordingly, hypoxic characteristics of H3.1 tumours was revealed by a significant enrichment of the set of genes upregulated by hypoxia in both astrocytes and HeLa cells (left panel) [37]. An ingenuity pathway analysis identified HIF1A as a key upstream regulator (activation z score = 2.177; p value = 7.67e−07) that connects a set of overexpressed genes (red nodes) in H3.1 vs. H3.3 samples identified by microarray analysis (right panel: orange edge leads to activation, yellow edge inconsistent state, grey edge effect not predicted). d Oedema is associated with H3.1 tumours. GSEA analysis shows a significant enrichment of genes upregulated in GBM with oedema (as defined by high FLAIR MRI) for H3.1 vs. H3.3 tumours [61] (left panel). Histological analysis of 57 DIPG showed more extensive extracellular oedema in H3.1 than H3.3 tumours (right panel; p value = 0.0017, Chi-square test). e Representative pictures of the histological examination of extracellular oedema in H3.3 (left panel sample P044)- and in H3.1-mutated tumour (right panel sample P070). Oedema appears at the histological level in H3.1 sample as multiple interstitial clear vacuoles in H&E staining (scale bar 50 µm). f Voxel-based analyses of apparent diffusion coefficient (ADC, top panel) and distributed diffusion coefficient (DCC, bottom panel) in 10 H3.1- and 10 H3.3-mutated DIPG. x-axis represents the ADC or DDC values in µm2/s while the y-axis represents the number of pixels with the corresponding value normalized by the total number of pixels analysed (density). ADC and DDC values are overall lower and the spread of the distribution smaller in H3.1 tumours compared to H3.3 ones. Median ADC values are 1228 and 1612 µm2/s in H3.1 and H3.3, respectively (p < 0.001, Mann–Whitney test) whereas normal brain values are 1000 µm2/s. Median DDC values are of 2688 and 1499 µm2/s (p < 0.001, Mann–Whitney test) in H3.3 tumours compared to H3.1 tumours)
Fig. 5
Fig. 5
Histone H3 mutations define two clinical DIPG subgroups. a Sex distributions of cases with H3.1 or H3.3 mutations show a trend towards an increased proportion of females in H3.1 mutant samples (56.5 vs. 46.4 %) which did not reach statistical significance. b Age distribution of H3.1 and H3.3 patients at diagnosis. The median age at diagnosis was significantly smaller in H3.1 (5.1 years) in comparison with H3.3 (7.4 years). Statistical significance was calculated with Mann–Whitney test (median, ****p value <0.0001, n = 79). c Bar diagrams representing the response to radiation therapy stratified by H3.1 and H3.3 mutation status. The vast majority of H3.1-mutated patients (85 %) were identified as good responders to radiation therapy whereas H3.3-mutated cases are divided evenly between the responders and non-responders group (55.3 %, p value = 0.0263, two-sided fisher exact test). d Kaplan–Meier estimates of the survival stratified by H3.1- or H3.3-K27M mutations. H3.1 tumours are associated with a better overall survival than H3.3 tumours (median survival times of 15.0 and 9.2 months, respectively, p value = 4.51e−05; log-rank test)

Comment in

References

    1. Albright AL, Packer RJ, Zimmerman R, et al. Magnetic resonance scans should replace biopsies for the diagnosis of diffuse brain stem gliomas: a report from the Children’s Cancer Group. Neurosurgery. 1993;33:1026–1029. doi: 10.1227/00006123-199312000-00010. - DOI - PubMed
    1. Bax DA, Mackay A, Little SE, et al. A distinct spectrum of copy number aberrations in pediatric high-grade gliomas. Clin Cancer Res Off J Am Assoc Cancer Res. 2010;16:3368–3377. doi: 10.1158/1078-0432.CCR-10-0438. - DOI - PMC - PubMed
    1. Bender S, Tang Y, Lindroth AM, et al. Reduced H3K27me3 and DNA Hypomethylation Are Major Drivers of Gene Expression in K27M Mutant Pediatric High-Grade Gliomas. Cancer Cell. 2013;24:660–672. doi: 10.1016/j.ccr.2013.10.006. - DOI - PubMed
    1. Bidus MA, Risinger JI, Chandramouli GVR, et al. Prediction of lymph node metastasis in patients with endometrioid endometrial cancer using expression microarray. Clin Cancer Res Off J Am Assoc Cancer Res. 2006;12:83–88. doi: 10.1158/1078-0432.CCR-05-0835. - DOI - PubMed
    1. Bolstad BM, Irizarry RA, Astrand M, Speed TP. A comparison of normalization methods for high density oligonucleotide array data based on variance and bias. Bioinforma Oxf Engl. 2003;19:185–193. doi: 10.1093/bioinformatics/19.2.185. - DOI - PubMed

Publication types

MeSH terms