

Sonic Estimation of Elasticity via Resonance: A New Method of Assessing Hemostasis
- PMID: 26399992
- PMCID: PMC4805516
- DOI: 10.1007/s10439-015-1460-y
Sonic Estimation of Elasticity via Resonance: A New Method of Assessing Hemostasis
Abstract
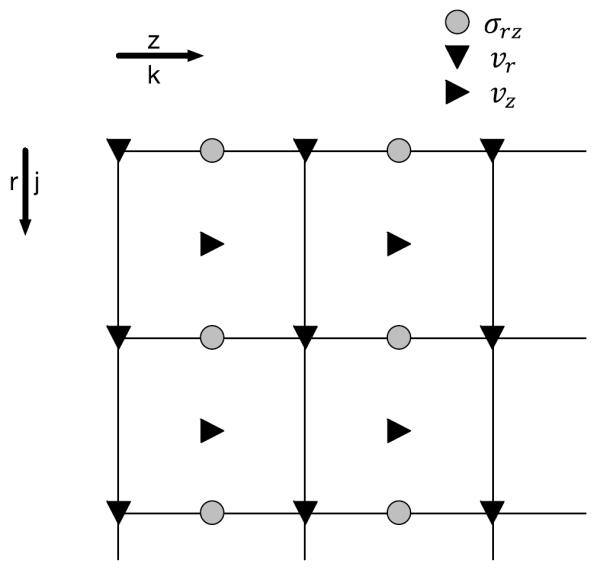
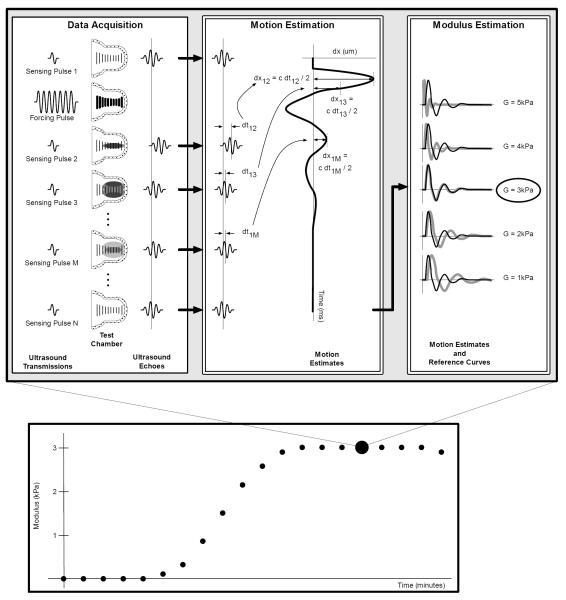
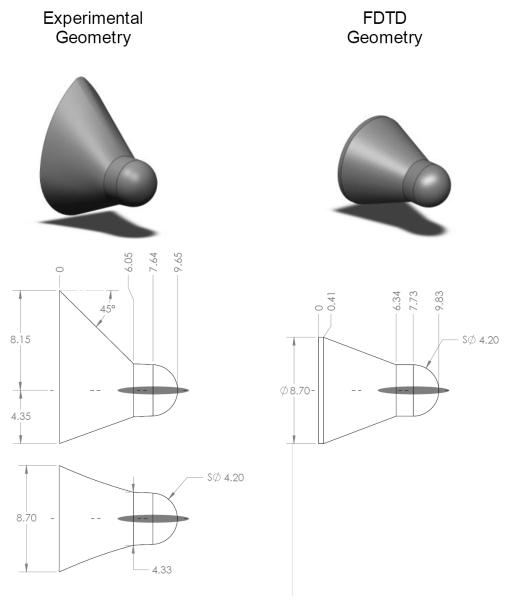
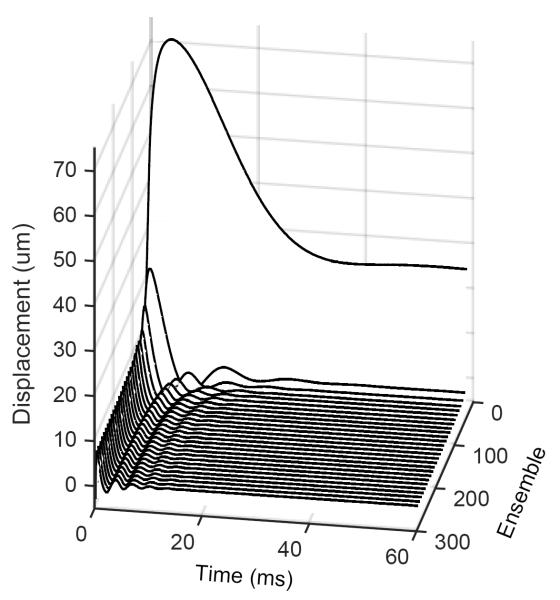
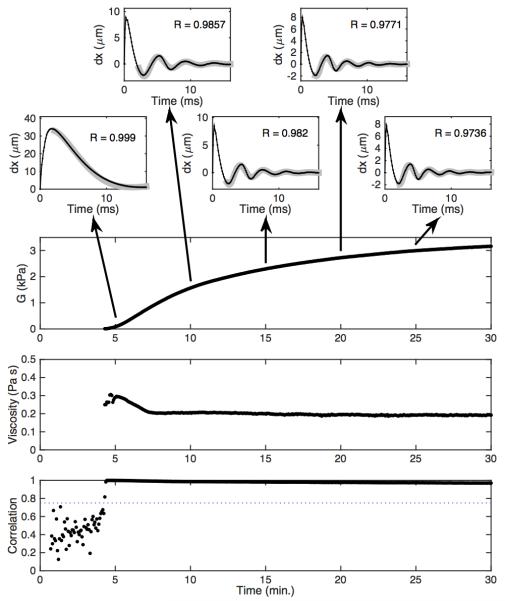
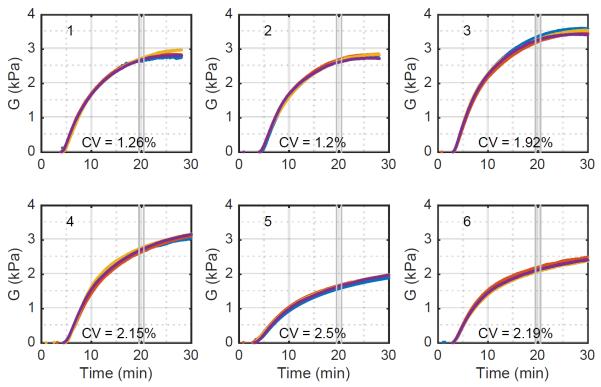
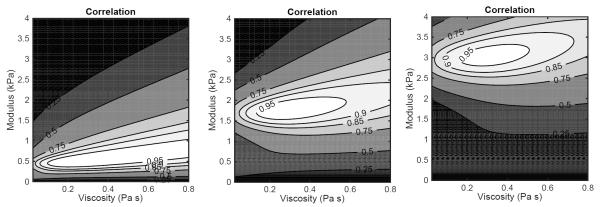
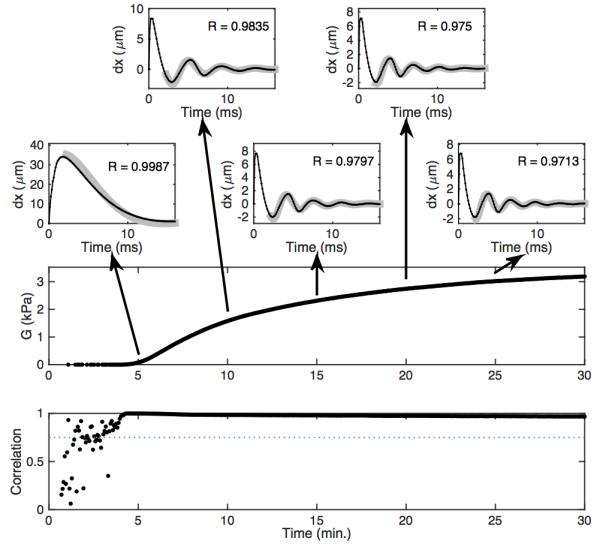
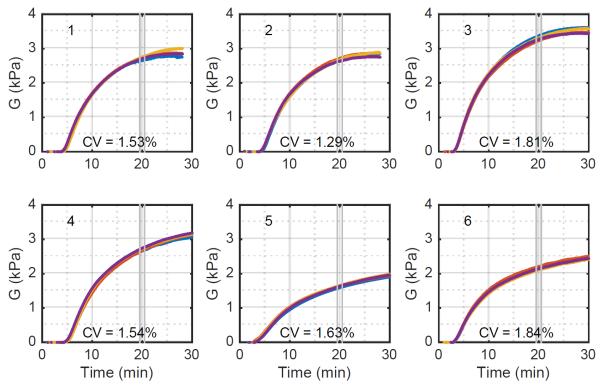
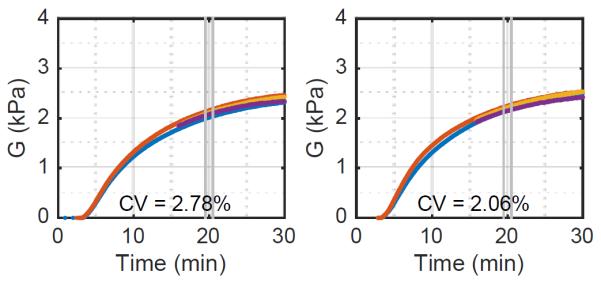
Uncontrolled bleeding threatens patients undergoing major surgery and in care for traumatic injury. This paper describes a novel method of diagnosing coagulation dysfunction by repeatedly measuring the shear modulus of a blood sample as it clots in vitro. Each measurement applies a high-energy ultrasound pulse to induce a shear wave within a rigid walled chamber, and then uses low energy ultrasound pulses to measure displacements associated with the resonance of that shear wave. Measured displacements are correlated with predictions from finite difference time domain models, with the best fit corresponding to the modulus estimate. In our current implementation each measurement requires 62.4 ms. Experimental data was analyzed using a fixed-viscosity algorithm and a free-viscosity algorithm. In experiments utilizing human blood induced to clot by exposure to kaolin, the free-viscosity algorithm quantified the shear modulus of formed clots with a worst-case precision of 2.5%. Precision was improved to 1.8% by utilizing the fixed-viscosity algorithm. Repeated measurements showed a smooth evolution from liquid blood to a firm clot with a shear modulus between 1.4 and 3.3 kPa. These results show the promise of this technique for rapid, point of care assessment of coagulation.
Keywords: Coagulation; FDTD; Resonance; Shear modulus; Shear waves; Ultrasound.
Figures
Similar articles
-
Estimating the viscoelastic modulus of a thrombus using an ultrasonic shear-wave approach.Med Phys. 2013 Apr;40(4):042901. doi: 10.1118/1.4794493. Med Phys. 2013. PMID: 23556923
-
The role of viscosity estimation for oil-in-gelatin phantom in shear wave based ultrasound elastography.Ultrasound Med Biol. 2015 Feb;41(2):601-9. doi: 10.1016/j.ultrasmedbio.2014.09.028. Epub 2014 Dec 23. Ultrasound Med Biol. 2015. PMID: 25542484
-
Measurement of quantitative viscoelasticity of bovine corneas based on lamb wave dispersion properties.Ultrasound Med Biol. 2015 May;41(5):1461-72. doi: 10.1016/j.ultrasmedbio.2014.12.017. Epub 2015 Jan 28. Ultrasound Med Biol. 2015. PMID: 25638310
-
High-resolution quantitative imaging of cornea elasticity using supersonic shear imaging.IEEE Trans Med Imaging. 2009 Dec;28(12):1881-93. doi: 10.1109/TMI.2009.2021471. Epub 2009 May 5. IEEE Trans Med Imaging. 2009. PMID: 19423431
-
Fundamental constants explain submillimeter liquid shear forces.Sci Adv. 2023 Aug 25;9(34):eadj8336. doi: 10.1126/sciadv.adj8336. Epub 2023 Aug 23. Sci Adv. 2023. PMID: 37611112 Free PMC article. Review.
Cited by
-
Baseline values for Quantra® QPlus® in healthy pregnant women at term and comparison to standard laboratory coagulation values: a prospective observational study.BMC Pregnancy Childbirth. 2025 Aug 8;25(1):826. doi: 10.1186/s12884-025-07927-z. BMC Pregnancy Childbirth. 2025. PMID: 40781663 Free PMC article.
-
Resonant acoustic rheometry for non-contact characterization of viscoelastic biomaterials.Biomaterials. 2021 Feb;269:120676. doi: 10.1016/j.biomaterials.2021.120676. Epub 2021 Jan 15. Biomaterials. 2021. PMID: 33485213 Free PMC article.
-
Sonorheometry Device Thresholds in Liver Transplantation: An Observational Retrospective Study.J Clin Med. 2024 Jan 25;13(3):696. doi: 10.3390/jcm13030696. J Clin Med. 2024. PMID: 38337389 Free PMC article.
-
Multicenter evaluation of the Quantra with the QStat Cartridge in adult trauma patients.Trauma Surg Acute Care Open. 2025 Jun 3;10(2):e001672. doi: 10.1136/tsaco-2024-001672. eCollection 2025. Trauma Surg Acute Care Open. 2025. PMID: 40486089 Free PMC article.
-
Comparison of Coagulation Parameters in Arterial and Venous Blood in Cardiac Surgery Measured Using the Quantra System.J Cardiothorac Vasc Anesth. 2019 Apr;33(4):976-984. doi: 10.1053/j.jvca.2018.08.201. Epub 2018 Aug 31. J Cardiothorac Vasc Anesth. 2019. PMID: 30279065 Free PMC article.
References
-
- Hoffman M, Monroe DM. A cell-based model of hemostasis. Thromb Haemost. 2001 Jun;85(6):958–65. - PubMed
-
- Yarnell JW, Baker IA, Sweetnam PM, Bainton D, O'Brien JR, Whitehead PJ, Elwood PC. Fibrinogen, viscosity, and white blood cell count are major risk factors for ischemic heart disease. The caerphilly and speedwell collaborative heart disease studies. Circulation. 1991 Mar;83(3):836–44. - PubMed
-
- Smith FB, Lee AJ, Fowkes FG, Price JF, Rumley A, Lowe GD. Hemostatic factors as predictors of ischemic heart disease and stroke in the edinburgh artery study. Arterioscler Thromb Vasc Biol. 1997 Nov;17(11):3321–5. - PubMed
-
- Hess JR, Lawson JH. The coagulopathy of trauma versus disseminated intravascular coagulation. J Trauma. 2006 Jun;60(6 Suppl):S12–9. - PubMed
-
- Franchini M, Montagnana M, Favaloro EJ, Lippi G. The bidirectional relationship of cancer and hemostasis and the potential role of anticoagulant therapy in moderating thrombosis and cancer spread. Semin Thromb Hemost. 2009 Oct;35(7):644–53. - PubMed
Publication types
MeSH terms
Grants and funding
LinkOut - more resources
Full Text Sources
Other Literature Sources
