. 2016 Jan 1;124(Pt A):612-626.
doi: 10.1016/j.neuroimage.2015.09.028. Epub 2015 Sep 21.

Evaluation of diffusion kurtosis imaging in ex vivo hypomyelinated mouse brains

Affiliations

Evaluation of diffusion kurtosis imaging in ex vivo hypomyelinated mouse brains

Nathaniel D Kelm et al. Neuroimage. .

Abstract

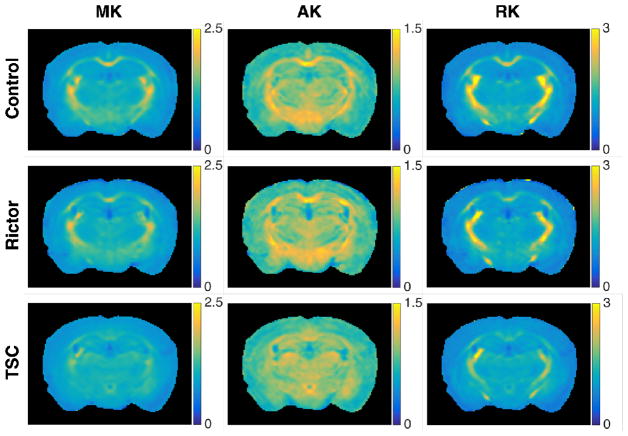
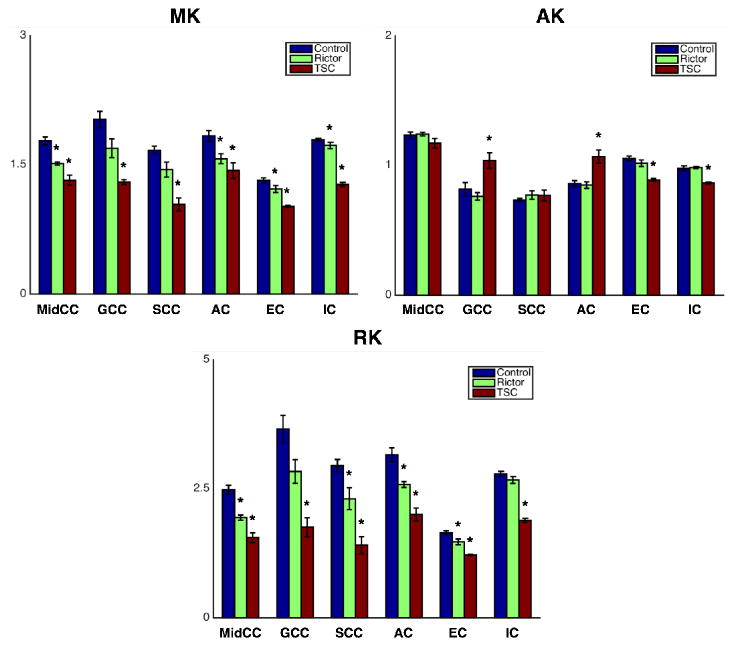
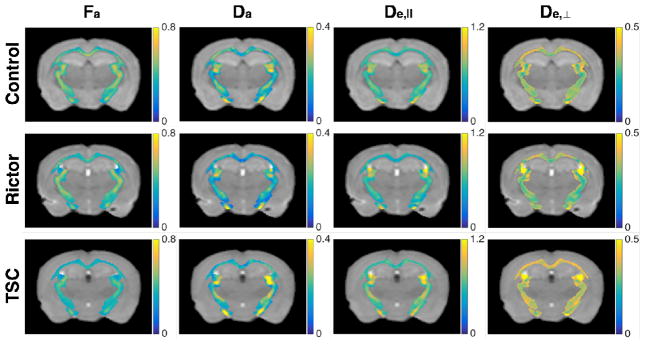
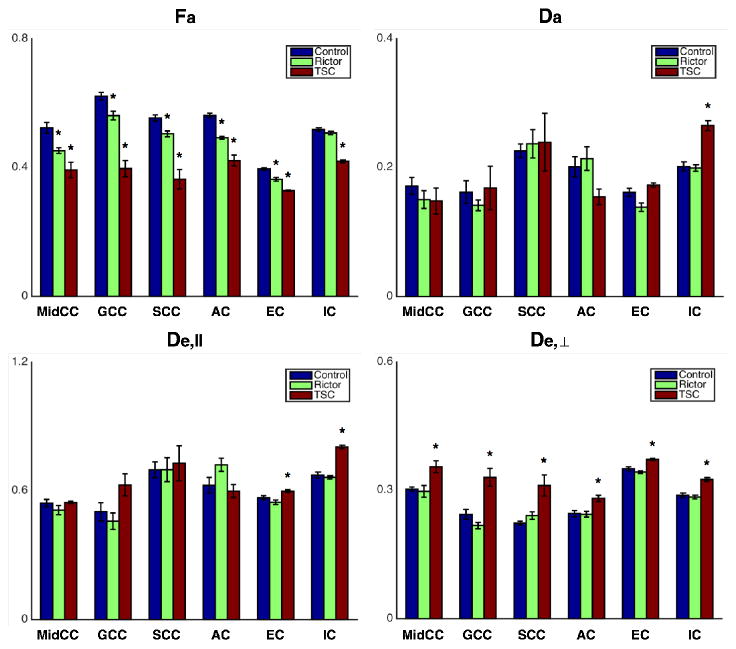
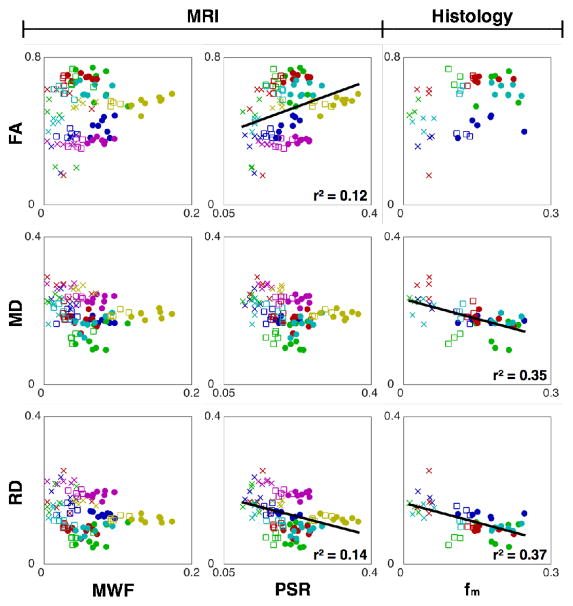
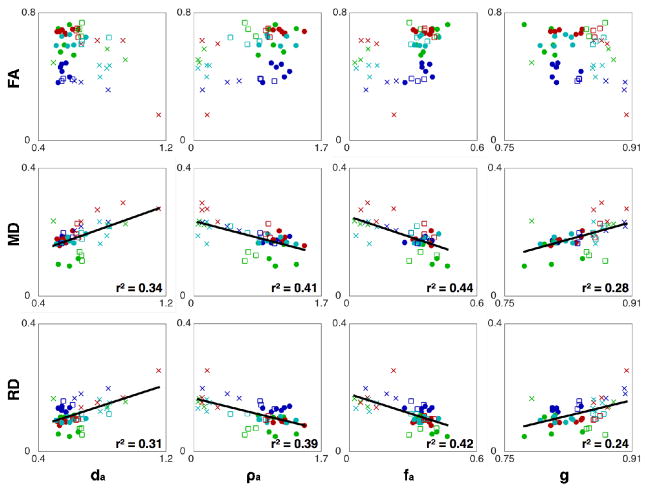
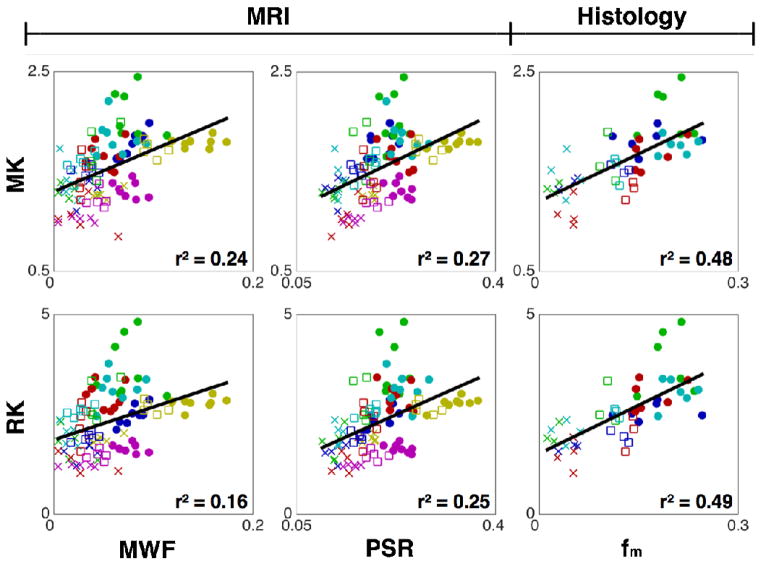
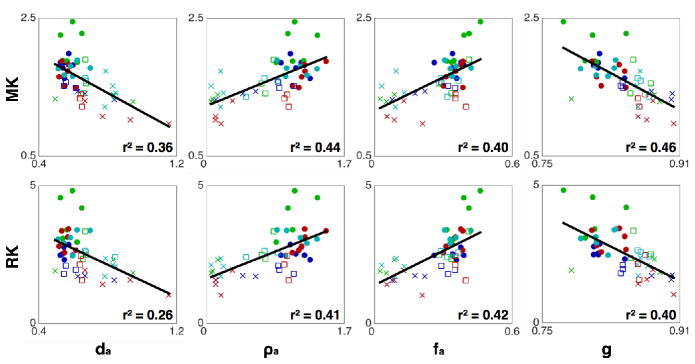
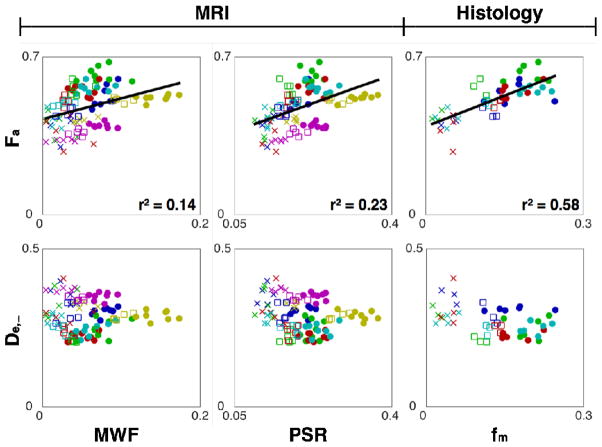
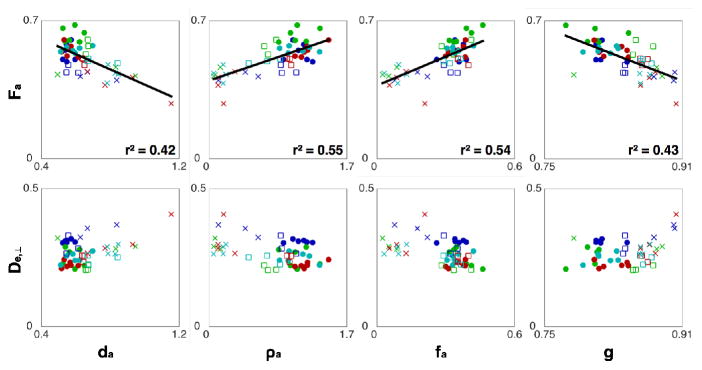
Diffusion tensor imaging (DTI), diffusion kurtosis imaging (DKI), and DKI-derived white matter tract integrity metrics (WMTI) were experimentally evaluated ex vivo through comparisons to histological measurements and established magnetic resonance imaging (MRI) measures of myelin in two knockout mouse models with varying degrees of hypomyelination. DKI metrics of mean and radial kurtosis were found to be better indicators of myelin content than conventional DTI metrics. The biophysical WMTI model based on the DKI framework reported on axon water fraction with good accuracy in cases with near normal axon density, but did not provide additional specificity to myelination. Overall, DKI provided additional information regarding white matter microstructure compared with DTI, making it an attractive method for future assessments of white matter development and pathology.

Keywords: Diffusion; Kurtosis; MRI; Myelin; Quantitative histology; White matter.


Figures

FIG. 1
FIG. 1
Quantitative histology metrics derived from EM. (a) T2-weighted sagittal cross-section showing locations of white matter histology sections. (b) Typical 15000x EM image of the splenium. (c) EM image after segmentation with myelin pixels shown in white. (d) EM image showing axons after region growing segmentation is performed to derive axon area and diameter. (e) Typical axon area and zm measurements.
FIG. 2
FIG. 2
Representative EM images of white matter. (Top row) EM images of the splenium from control, Rictor and TSC mouse brains. (Bottom row) Processed and segmented EM images corresponding to the images shown on the top row. Compared to the control brain, Rictor brain WM shows a slight decrease in myelin thickness and myelinated axon density. TSC brain WM shows a significant decrease in myelinated axon density.
FIG. 3
FIG. 3
Representative coronal DTI parameter maps. The rows represent the three groups: control (top), Rictor (middle), and TSC (bottom). The columns represent the DTI parameters FA, MD, AD, and RD. FA is unitless and diffusivities are in units of μm2/ms.
FIG. 4
FIG. 4
ROI group comparison of DTI parameters FA, MD, AD, and RD. Bar heights represent the ROI parameter means across each group, with error bars spanning the mean ± SEM. The three groups are represented with different colors: control = blue, Rictor = green, and TSC = red. 6 WM ROIs are indicated on the x-axis: MidCC = midbody of the corpus callosum, GCC = genu, SCC = splenium, AC = anterior commissure, EC = external capsule, and IC = internal capsule. FA is unitless and diffusivities are in units of μm2/ms. * denotes p < 0.05 for comparison between the control group and each CKO group.
FIG. 5
FIG. 5
Representative coronal DKI parameter maps. The rows represent the three groups: control (top), Rictor (middle), and TSC (bottom). The columns represent the DKI parameters MK, AK, and RK. Kurtosis is unitless.
FIG. 6
FIG. 6
ROI group comparison of DKI parameters MK, AK, and RK. Bar heights represent the ROI parameter means across each group, with error bars spanning the mean ± SEM. The three groups are represented with different colors: control = blue, Rictor = green, and TSC = red. 6 WM ROIs are indicated on the x-axis: MidCC = midbody of the corpus callosum, GCC = genu, SCC = splenium, AC = anterior commissure, EC = external capsule, and IC = internal capsule. Kurtosis is unitless. * denotes p < 0.05 for comparison between the control group and each CKO group.
FIG. 7
FIG. 7
Representative coronal WMTI parameter maps. WMTI parameter values for white matter voxels are overlaid on the b=0 image. The rows represent the three groups: control (top), Rictor (middle), and TSC (bottom). The columns represent the WMTI parameters Fa, Da, De,||, and De,⊥. Fa is unitless and diffusivities are in units of μm2/ms.
FIG. 8
FIG. 8
ROI group comparison of WMTI parameters Fa, Da, De,||, and De,⊥. Bar heights represent the ROI parameter means across each group, with error bars spanning the mean ± SEM. The three groups are represented with different colors: control = blue, Rictor = green, and TSC = red. 6 WM ROIs are indicated on the x-axis: MidCC = midbody of the corpus callosum, GCC = genu, SCC = splenium, AC = anterior commissure, EC = external capsule, and IC = internal capsule. Fa is unitless and diffusivities are in units of μm2/ms. * denotes p < 0.05 for comparison between the control group and each CKO group.
FIG. 9
FIG. 9
Linear correlation plots between DTI metrics FA, MD, and RD (y-axis) and myelin measures MWF, PSR, and fm (x-axis). Each point is an ROI mean from an individual mouse brain. The shape represents the group: control = circle, Rictor = square, and TSC = x and the color represents the WM region: MidCC = blue, GCC = green, SCC = red, AC = cyan, EC = magenta, IC = yellow. For significant correlations, r2 is shown in the lower right-hand corner of each plot. FA, MWF, PSR, and fm are unitless, MD and RD are in units of μm2/ms.
FIG. 10
FIG. 10
Linear correlation plots between DTI metrics FA, MD, and RD (y-axis) and the histologic measures da, ρa, fa, and g (x-axis). Each point is an ROI mean from an individual mouse brain. The shape represents the group: control = circle, Rictor = square, and TSC = x and the color represents the WM region: MidCC = blue, GCC = green, SCC = red, AC = cyan. For significant correlations, r2 is shown in the lower right-hand corner of each plot. FA, fa, and g are unitless, MD and RD are in units of μm2/ms, da is in units of μm, and ρa is in units of axons/μm2.
FIG. 11
FIG. 11
Linear correlation plots between DKI metrics MK and RK (y-axis) and myelin measures MWF, PSR, and fm (x-axis). Each point is an ROI mean from an individual mouse brain. The shape represents the group: control = circle, Rictor = square, and TSC = x and the color represents the WM region: MidCC = blue, GCC = green, SCC = red, AC = cyan, EC = magenta, IC = yellow. For significant correlations, r2 is shown in the lower right-hand corner of each plot. MK, RK, MWF, PSR, and fm are unitless.
FIG. 12
FIG. 12
Linear correlation plots between DKI metrics MK and RK (y-axis) and the histologic measures da, ρa, fa, and g (x-axis). Each point is an ROI mean from an individual mouse brain. The shape represents the group: control = circle, Rictor = square, and TSC = x and the color represents the WM region: MidCC = blue, GCC = green, SCC = red, AC = cyan. For significant correlations, r2 is shown in the lower right-hand corner of each plot. MK, RK, fa, and g are unitless, da is in units of μm, and ρa is in units of axons/μm2.
FIG. 13
FIG. 13
Linear correlation plots between WMTI metrics Fa and De,⊥ (y-axis) and myelin measures MWF, PSR, and fm (x-axis). Each point is an ROI mean from an individual mouse brain. The shape represents the group: control = circle, Rictor = square, and TSC = x and the color represents the WM region: MidCC = blue, GCC = green, SCC = red, AC = cyan, EC = magenta, IC = yellow. For significant correlations, r2 is shown in the lower right-hand corner of each plot. Fa, MWF, PSR, and fm are unitless, De,⊥ is in units of μm2/ms.
FIG. 14
FIG. 14
Linear correlation plots between WMTI metrics Fa and De,⊥ (y-axis) and the histologic measures da, ρa, fa, and g (x-axis). Each point is an ROI mean from an individual mouse brain. The shape represents the group: control = circle, Rictor = square, and TSC = x and the color represents the WM region: MidCC = blue, GCC = green, SCC = red, AC = cyan. For significant correlations, r2 is shown in the lower right-hand corner of each plot. Fa, fa, and g are unitless, De,⊥ is in units of μm2/ms, da is in units of μm, and ρa is in units of axons/μm2.

Similar articles

Cited by

References

    1. Alexander DC, Hubbard PL, Hall MG, Moore EA, Ptito M, Parker GJM, Dyrby TB. Orientationally invariant indices of axon diameter and density from diffusion MRI. Neuro Image. 2010;52:1374–1389. doi: 10.1016/j.neuroimage.2010.05.043. - DOI - PubMed
    1. Allen IV, McKeown SR. A histological, histochemical and biochemical study of the macroscopically normal white matter in multiple sclerosis. J Neurol Sci. 1979;41:81–91. - PubMed
    1. Assaf Y, Blumenfeld-Katzir T, Yovel Y, Basser PJ. AxCaliber: a method for measuring axon diameter distribution from diffusion MRI. Magn Reson Med. 2008;59:1347–1354. doi: 10.1002/mrm.21577. - DOI - PMC - PubMed
    1. Assaf Y, Freidlin RZ, Rohde GK, Basser PJ. New modeling and experimental framework to characterize hindered and restricted water diffusion in brain white matter. Magn Reson Med. 2004;52:965–978. - PubMed
    1. Basser PJ, Jones DK. Diffusion-tensor MRI: theory, experimental design and data analysis–a technical review. NMR Biomed. 2002;15:456–467. - PubMed

Publication types

Substances