. 2015 Nov 6;290(45):27101-27112.
doi: 10.1074/jbc.M115.649582. Epub 2015 Sep 23.

Antigen-B Cell Receptor Complexes Associate with Intracellular major histocompatibility complex (MHC) Class II Molecules

Affiliations

Antigen-B Cell Receptor Complexes Associate with Intracellular major histocompatibility complex (MHC) Class II Molecules

Margarida Barroso et al. J Biol Chem. .

Abstract

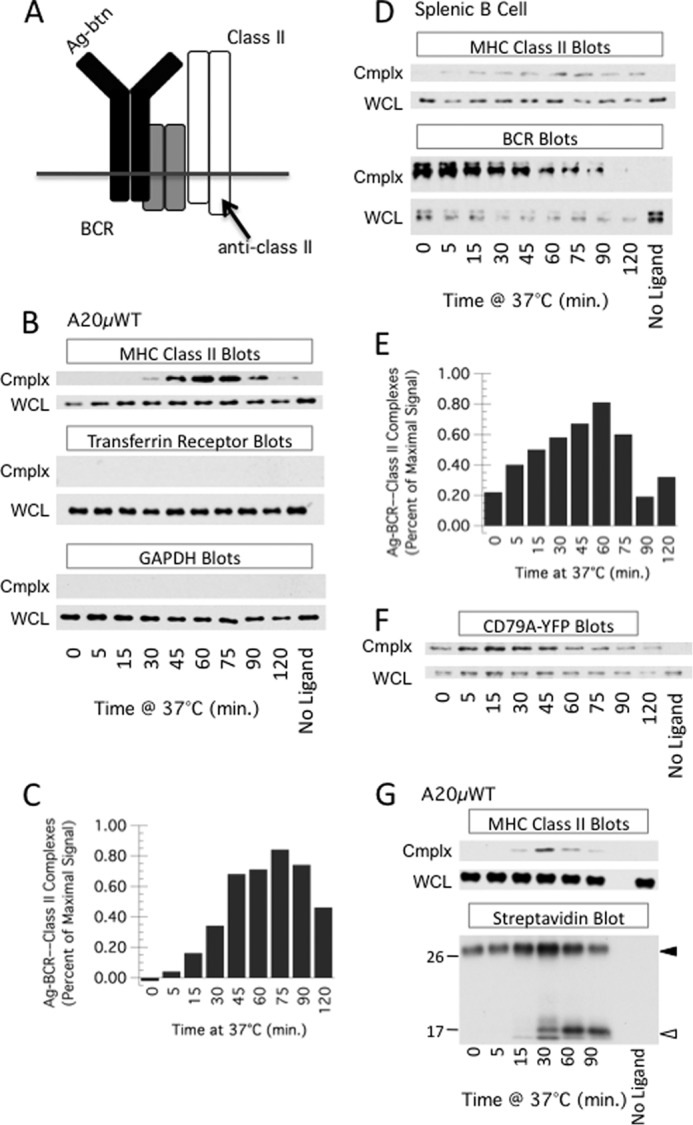
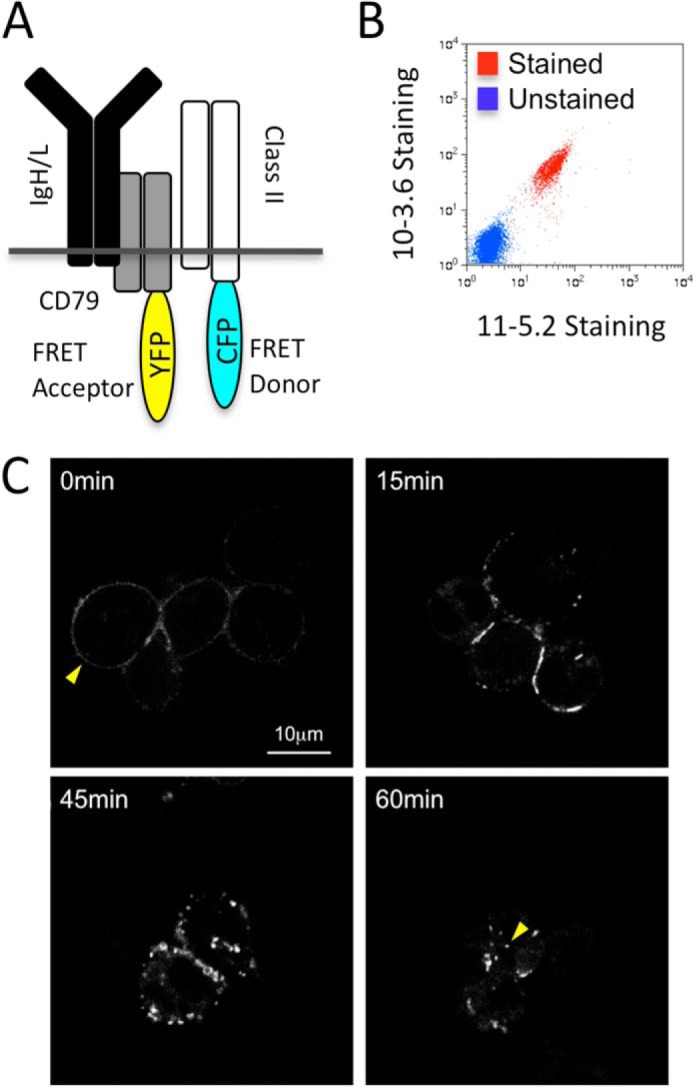
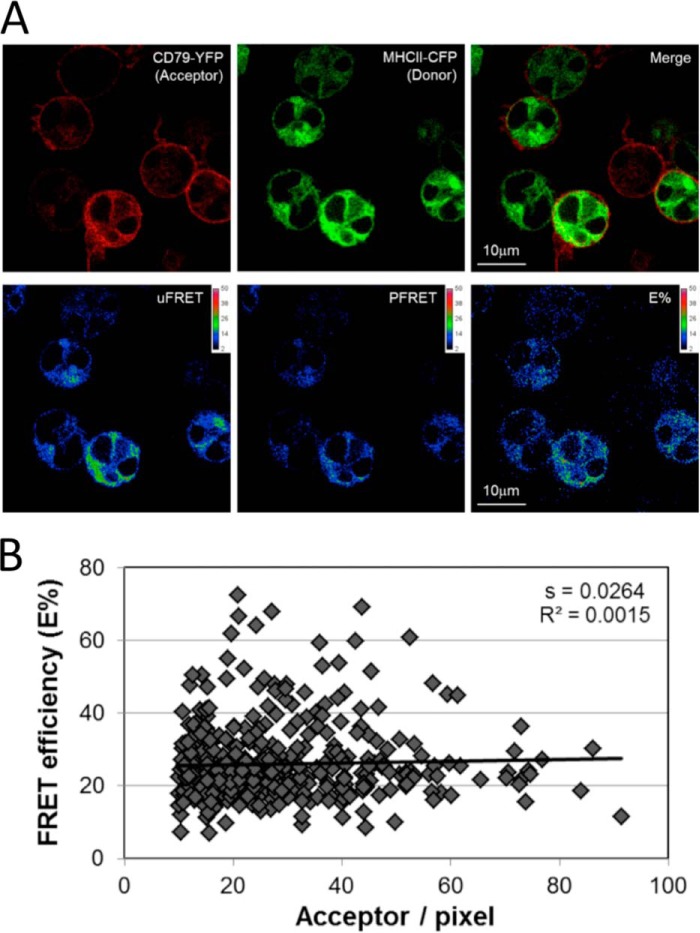
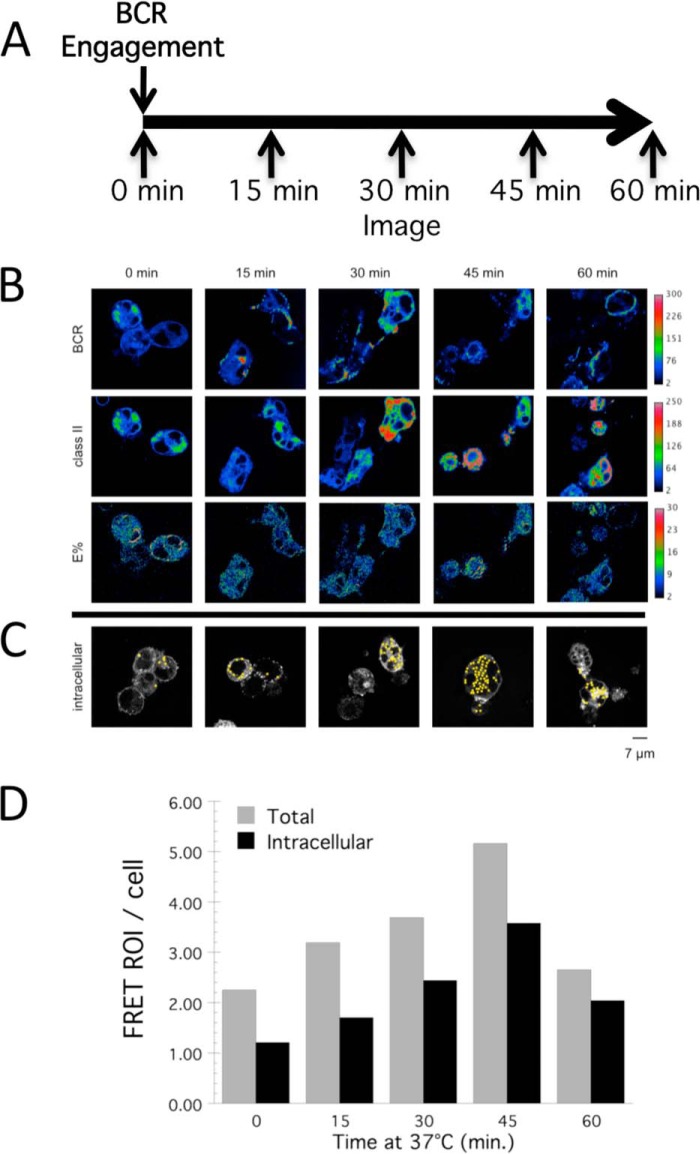
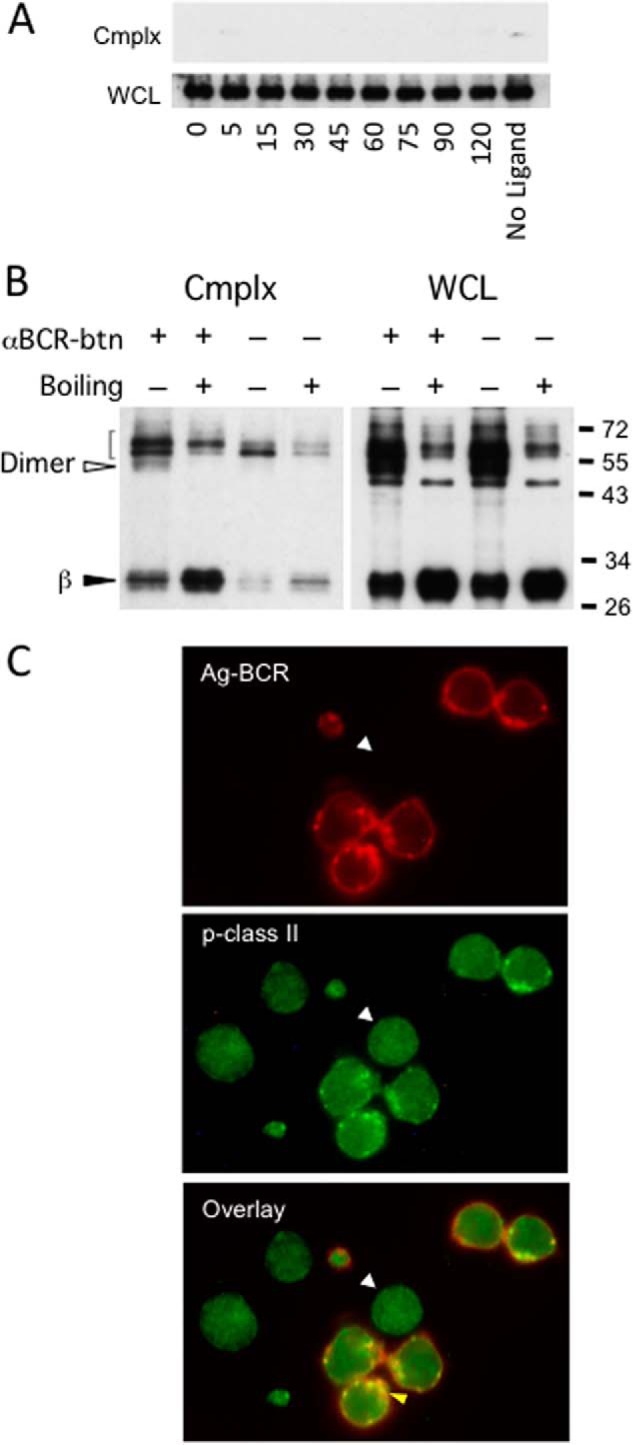
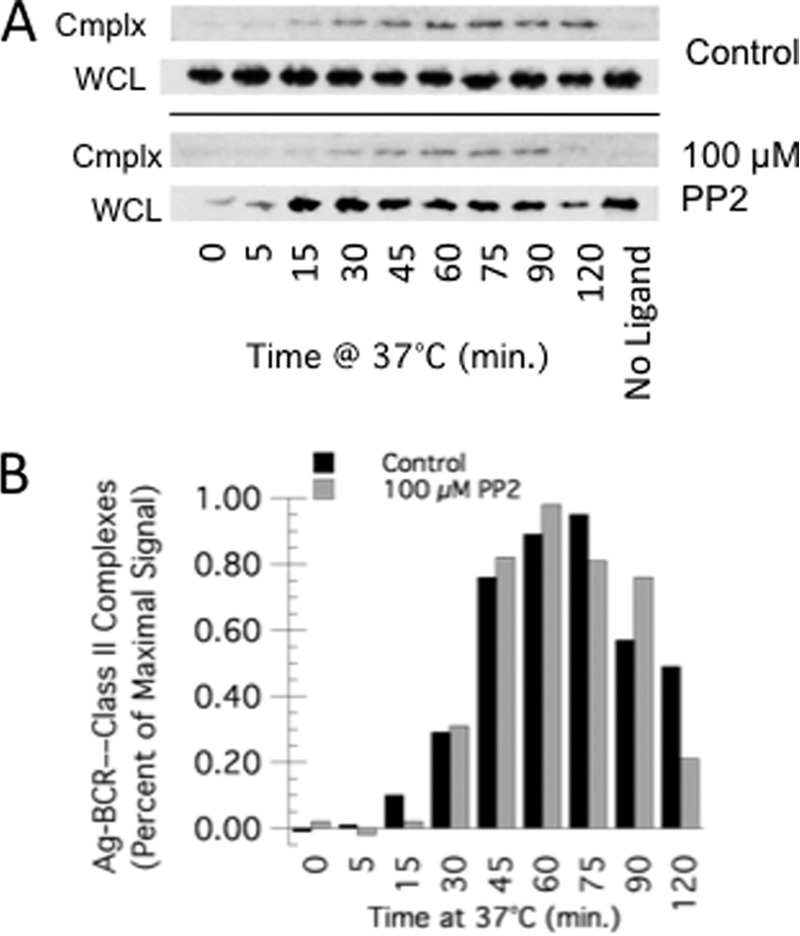
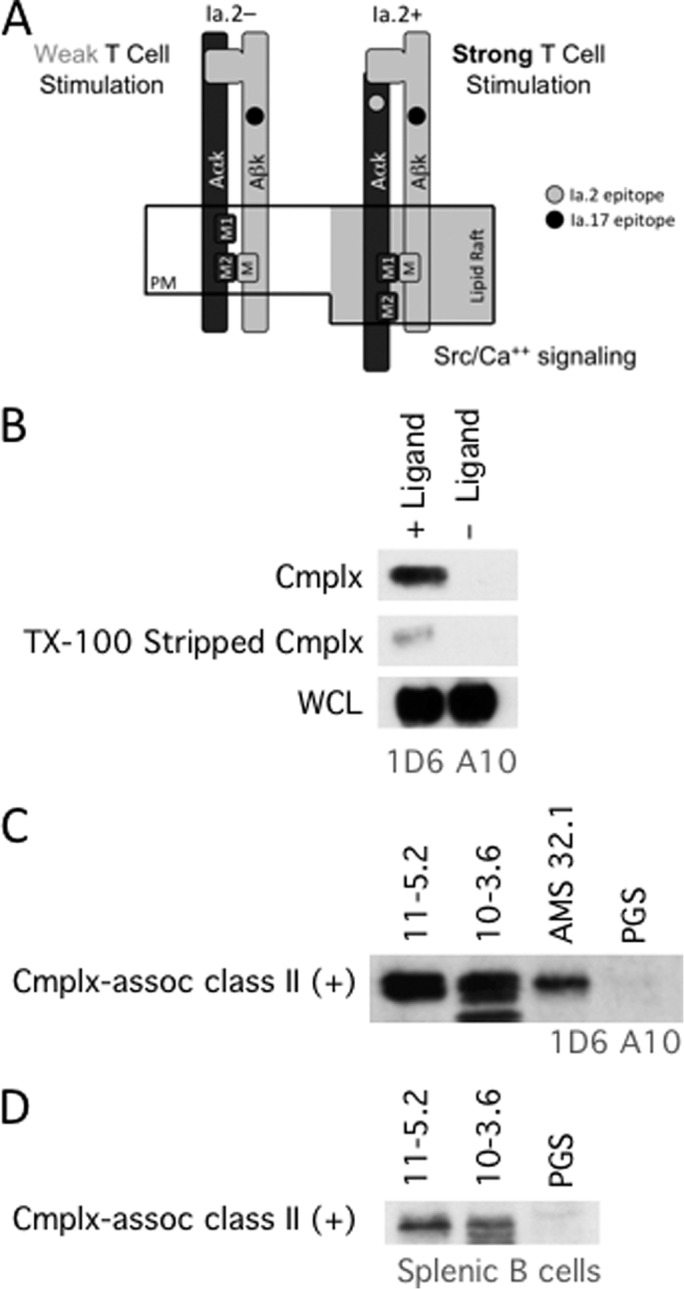
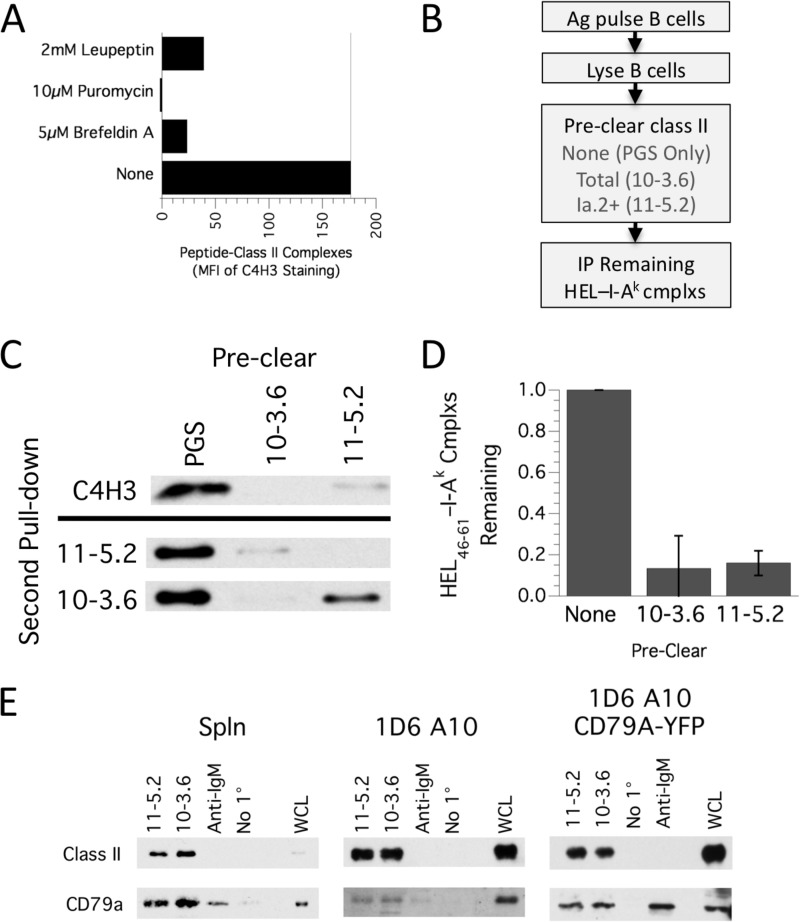
Antigen processing and MHC class II-restricted antigen presentation by antigen-presenting cells such as dendritic cells and B cells allows the activation of naïve CD4+ T cells and cognate interactions between B cells and effector CD4+ T cells, respectively. B cells are unique among class II-restricted antigen-presenting cells in that they have a clonally restricted antigen-specific receptor, the B cell receptor (BCR), which allows the cell to recognize and respond to trace amounts of foreign antigen present in a sea of self-antigens. Moreover, engagement of peptide-class II complexes formed via BCR-mediated processing of cognate antigen has been shown to result in a unique pattern of B cell activation. Using a combined biochemical and imaging/FRET approach, we establish that internalized antigen-BCR complexes associate with intracellular class II molecules. We demonstrate that the M1-paired MHC class II conformer, shown previously to be critical for CD4 T cell activation, is incorporated selectively into these complexes and loaded selectively with peptide derived from BCR-internalized cognate antigen. These results demonstrate that, in B cells, internalized antigen-BCR complexes associate with intracellular MHC class II molecules, potentially defining a site of class II peptide acquisition, and reveal a selective role for the M1-paired class II conformer in the presentation of cognate antigen. These findings provide key insights into the molecular mechanisms used by B cells to control the source of peptides charged onto class II molecules, allowing the immune system to mount an antibody response focused on BCR-reactive cognate antigen.

Keywords: B cell receptor (BCR); FRET; MHC; antigen presentation; antigen processing; antigen-presenting cell (APC); imaging; lymphocyte.


Figures

FIGURE 1.
FIGURE 1.
Time-dependent association of antigen-B cell receptor complexes with MHC class II molecules. A, diagram of the approach. B cells are pulsed with biotin-labeled BCR ligand (antigen or anti-BCR mAb). Cells are lysed, and biotin-labeled BCR ligand (and associated proteins) are recovered by pulldown with streptavidin beads. Pulldowns are probed for MHC class II by Western blot analysis for class II β chain cytoplasmic tail (anti-class II). B, A20μWT B cells were pulsed with PC-BSA-btn for the indicated times and then analyzed for PC-BSA-btn—BCR—class II complexes (cmplx) as diagrammed in A. WCL was also analyzed for class II. Shown are representative results from one of six independent experiments. Isolated complexes and WCL were also probed for transferrin receptor and GAPDH. Shown are representative results from one of three independent experiments. In all experiments, both cmplx and WCL blots for each marker (e.g. class II) were developed with the same ECL reagent and exposed for the same time. C, quantitative analysis of average level of PC-BSA-btn—BCR—class II complexes across six independent experiments. D and E, splenic B cells were pulsed with anti-IgM-btn and ligand-BCR-class II complexes detected as in B and C (quantitation of results from three independent experiments). Isolated complexes and WCL were also probed for the IgM heavy chain of the BCR (BCR Blots). The difference in signal between “No Ligand” and T = 0 in the WCL is likely due to ligation-induced association of some BCR molecules with detergent-insoluble cellular elements such as the cytoskeleton. F, 1D6 A10 CD79A-YFP cells were pulsed with anti-IgM-btn for the indicated time, lysed in Brig-58 lysis buffer, and BCR—anti-IgM-btn was pulled down with streptavidin beads. The pulldown (Cmplx) and WCL were then analyzed by Western blotting with anti-YFP antibody. Shown are representative results from one of two independent experiments. G, A20μWT B cells were cultured in the continued presence of low levels of biotin-labeled F(ab')2 fragments of goat anti-human IgM antibody for the indicated times. The cells were analyzed for ligand-BCR-class II complexes as in B. Parallel streptavidin pulldown samples were also analyzed for anti-BCR-btn by streptavidin-HRP blotting. Closed and open arrowheads indicate the position of the anti-BCR-btn antibody (heavy chain F(ab')2 fragment and/or intact light chain) and proteolytic breakdown fragments, respectively. The position of the molecular weight markers (in kilodaltons) is shown. The increase in signal for the intact heavy chain and CD79-YFP (F) from 0–30 min is due to ligand binding to intracellular receptors that are recruited to the cell surface upon exposure to BCR ligand (data not shown). Shown are representative results from one of three independent experiments.
FIGURE 2.
FIGURE 2.
Characterization of FRET B cells. A, diagram of fluorescent protein-labeled molecules. K46μ B cells were sequentially transfected with expression vectors encoding expression of CD79a-YFP (FRET acceptor) and MHC class II-CFP (FRET donor, I-Ak β chain-CFP + unlabeled α chain). B, non-permeabilized stable CD79a-YFP/class II-CFP transfectants (2C1 FRET B cells) were stained with anti-I-Ak mAbs (10-3.6 anti-total I-Ak and 11-5.2 anti-Ia.2+ I-Ak) and analyzed by flow cytometry. Unlabeled cells were also analyzed. Shown are representative results from one of three independent experiments. C, 2C1 cells were pulsed with anti-BCR antibody on ice or for up to 60 min at 37 °C. The cells were then imaged for CD79a-YFP by confocal microscopy. Mid-plane slices of representative images are shown. In the T = 0 image, the yellow arrow indicates cell surface CD79a-YFP (cell surface BCR). In the T = 60 image, the yellow arrow indicates one example of intracellular CD79a-YFP (intracellular BCR). Shown are representative results from one of three independent experiments.
FIGURE 3.
FIGURE 3.
Distribution of BCR-YFP and class II-CFP in non-BCR-engaged B cells. A, 2C1 B cells were imaged by confocal laser-scanning microscopy and analyzed for FRET between BCR-YFP (i.e. CD79a-YFP) and class II-CFP (i.e. Aβk-CFP). The top row shows the distribution of each protein alone, followed by a two-color overlay. The bottom row shows uncorrected FRET (uFRET), corrected FRET (PFRET) and FRET corrected for varying donor levels (E%). See “Experimental Procedures” for details. B, multiple images were analyzed on a pixel-by-pixel basis for both FRET efficiency (E%) and acceptor level. The resulting analysis reveals that the slope of the linear curve fit is <0.03, which we have shown previously to be the threshold for detecting effects of molecular crowding (15, 16). Therefore, molecular crowding is not driving FRET in this system. This relationship did not change in samples stimulated with BCR ligand (data not shown).
FIGURE 4.
FIGURE 4.
Association of BCR and MHC class II molecules within intracellular compartments. A, time line of the experimental protocol. B, representative images of anti-BCR-pulsed FRET cells from each time point. Rows from top to bottom: CD79a-YFP (BCR), I-Ak-CFP (class II), corrected FRET between CD79a-YFP, and class II-CFP (E%). C, representative images with identified intracellular FRET events. D, quantitation of the number of FRET events/cell at each time point across all samples analyzed. Both total FRET events/cell (Total) and morphologically identifiable intracellular FRET events/cell (Intracellular) are reported.
FIGURE 5.
FIGURE 5.
The presence of peptide-class II complexes within antigen-BCR-class II complexes. A, A20μWT cells were pulsed with PC-BSA-btn, lysed, and analyzed for ligand-BCR complexes as in Fig. 1, but pulldowns and WCL were probed for Ii (CD74) by Western blot analysis. Shown are representative results from one of three independent experiments. B, 1D6 A10 I-Ak-expressing K46μ B cells were pulsed for 1 h with anti-IgM-btn and anti-IgM-btn—BCR—class II complexes isolated by streptavidin pulldown. The isolated complexes were released with SDS-PAGE sample buffer either at room temperature or at 100 °C (boiling). The released class II molecules were analyzed by SDS-PAGE and Western blotting for MHC class II β chain. The open arrowhead indicates the position of SDS-stable class II αβ dimers. The closed arrowhead indicates free β chain. The bracket indicates background bands. Shown are representative results from one of three independent experiments. C, MD4.B10.Br B cells (expressing an HEL-specific BCR and I-Ak class II molecules) were pulsed with 100 nm HEL for 4 h. The cells were then fixed, stained for BCR-bound HEL (2D1 anti-HEL, red) and derivative HEL46–61—I-Ak peptide-class II complexes (C4H3, green), and imaged by confocal microscopy. The lack of staining of trace-contaminating non-B cells (arrowheads) for Ag-BCR complexes or derivative peptide-class II complexes (these cells exhibit no puncta of FITC staining) confirms the specificity of staining. Shown are representative results from one of three independent experiments.
FIGURE 6.
FIGURE 6.
BCR signaling is not required for Ag-BCR association with MHC class II molecules. A, A20μWT B cells were pretreated with 100 μm PP2 (an Src kinase inhibitor) for 20 min at 37 °C or left untreated. The cells were then pulsed with PC-BSA-btn for the indicated time, and PC-BSA-btn—BCR—class II complexes (cmplx) were isolated and analyzed as in Fig. 1. Shown are representative results from one of three independent experiments (the ECL exposure for the cmplx blots of control and PP2-treated cells was identical). B, quantitative analysis of the average level of PC-BSA-btn-BCR—class II complex levels in control and PP2-treated cells across three independent experiments.
FIGURE 7.
FIGURE 7.
Selective association of M1-paired class II with internalized Ag-BCR complexes. A, diagrammatic summary of Ia.2+ M1-paired I-Ak class II molecules and Ia.2 M2-paired I-Ak class II molecules. See Refs. , for details. PM, plasma membrane. B, anti-IgM-btn—BCR—class II complexes were isolated from 1D6 A10 B cells by streptavidin pulldown as in Fig. 1 (+ Ligand, anti-IgM-btn-pulsed cells; − Ligand, no anti-IgM-btn (negative control)). A fraction of the pulldown was analyzed for MHC class II β chain (Cmplx). The remainder of the pulldown was treated with 1% Triton X-100 at room temperature to release non-covalently associated class II molecules. The Triton X-100-stripped beads were then analyzed for remaining unreleased class II. Shown are representative results from one of three independent experiments. C, the Triton X-100 pulldown supernatant (containing released MHC class II molecules) was divided into four equal samples and immunoprecipitated with either PGS alone (negative control) or PGS plus 11-5.2 (anti-Ia.2+ I-Ak class II), 10-3.6 (anti-Ia.2- I-Ak class II), or AMS-32.1 (anti-I-Ad class II). Immunoprecipitates were analyzed for MHC class II β chain by Western blotting. Across three independent experiments, the band density for the 11-5.2 IP was 1.36 times that of 10-3.6 (± 0.24 S.D.). D, Ag-BCR—class II complexes isolated from splenic B cells pulsed with anti-IgM-btn were analyzed for Ia.2+ I-Ak class II as in C. Across three independent experiments, the band density for the 11-5.2 IP was 1.16 times that of 10-3.6 (± 0.21 S.D.). B–D show representative results from one of three independent experiments. The lower molecular weight band present in the 10-3.6 IP in C and D is a nonspecific background band because it is also seen in IPs from lysis buffer.
FIGURE 8.
FIGURE 8.
Selective loading of antigen-BCR-derived peptide onto M1-paired MHC class II molecules. A, MD4.B10.Br B cells were pulsed overnight with 100 nm HEL in the presence of the listed pharmacological agents (leupeptin, a protease inhibitor, blocks Ii degradation; puromycin, a protein synthesis inhibitor, or Brefeldin A disrupt ER/Golgi vesicle-mediated trafficking). The level of cell surface HEL46–61—I-Ak peptide-class II complexes was determined by staining with C4H3 mAb and analysis by flow cytometry. Plotted is the MFI of HEL-induced C4H3 staining (MFI of C4H3 staining of HEL-pulsed cells minus MFI of C4H3 staining of non-HEL-pulsed cells). Shown are representative results from one of three independent experiments. MFI, mean fluorescent intensity. B, diagram of the experimental flow generating the results presented in C and D. IP, immunoprecipitation. C, detergent lysates of HEL-pulsed MD4.B10.Br B cells were precleared with PGS only (negative control) or PGS plus 10-3.6 (anti-total I-Ak class II) or PGS plus 11-5.2 (anti-Ia.2+ I-Ak class II). HEL46–61—I-Ak peptide-class II complexes remaining in the precleared supernatants were immunoprecipitated with C4H3 and PGS. Immunoprecipitates were analyzed for MHC class II β chain by Western blotting. Shown are representative results from one of three independent experiments. As a control, the precleared SN was also analyzed by IP with either the 10-3.6 or 11-5.2 anti-I-Ak mAbs, as reported previously (10) (blots below the black line). D, quantitative analysis of HEL46–61—I-Ak peptide-class II complexes remaining in the precleared supernatants. In each experiment, the level of complexes in the PGS precleared sample was set to 1.00, and the level of complexes in the other samples was reported as a fraction of this value. Results are mean ± S.E. across three independent experiments. E, the indicated cell type was lysed in 0.05% Brij-58 and either Ia.2+ or total I-Ak class II molecules immunoprecipitated with 11-5.2 or 10-3.6 mAb, respectively. As controls, samples were also immunoprecipitated with anti-IgM (which brings down associated CD79 but no class II) or just protein G-Sepharose (No 1°, which brings down neither class II nor CD79). Each sample, along with some WCL, was then probed for class II β chain and CD79A/CD79A-YFP by Western blotting. For each cell type, shown are representative results from one of three independent experiments.

References

    1. Hulpke S., and Tampé R. (2013) The MHC I loading complex: a multitasking machinery in adaptive immunity. Trends Biochem. Sci. 38, 412–420 - PubMed
    1. Chesnut R. W., and Grey H. M. (1985) Antigen presenting cells and mechanisms of antigen presentation. Crit. Rev. Immunol. 5, 263–316 - PubMed
    1. Chesnut R. W., and Grey H. M. (1986) Antigen presentation by B cells and its significance in T-B interactions. Adv. Immunol. 39, 51–94 - PubMed
    1. Lanzavecchia A. (1987) Antigen uptake and accumulation in antigen-specific B cells. Immunol. Rev. 99, 39–51 - PubMed
    1. Nashar T. O., and Drake J. R. (2005) The pathway of antigen uptake and processing dictates MHC class II-mediated B cell survival and activation. J. Immunol. 174, 1306–1316 - PubMed

Publication types

MeSH terms

Substances