. 2015 Oct 15;142(20):3601-11.
doi: 10.1242/dev.118836. Epub 2015 Sep 23.

Tracking and transforming neocortical progenitors by CRISPR/Cas9 gene targeting and piggyBac transposase lineage labeling

Affiliations

Tracking and transforming neocortical progenitors by CRISPR/Cas9 gene targeting and piggyBac transposase lineage labeling

Fuyi Chen et al. Development. .

Abstract

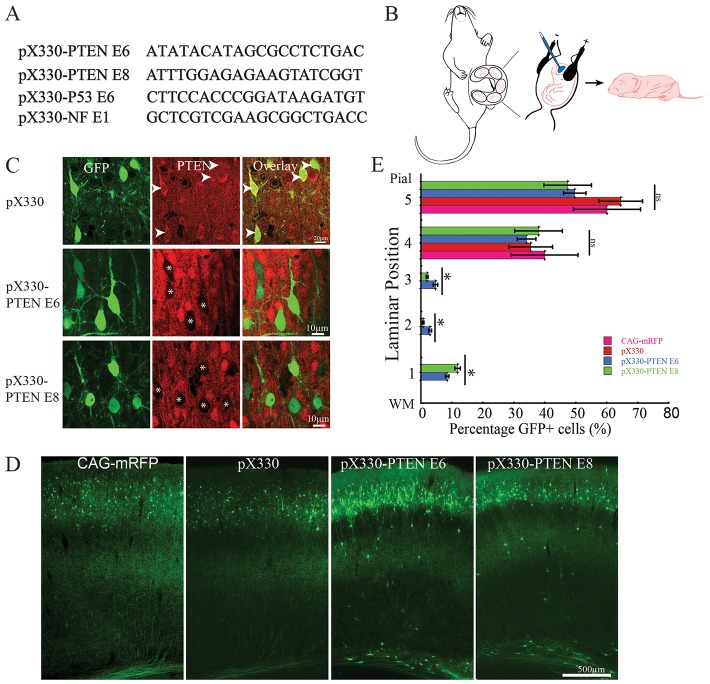
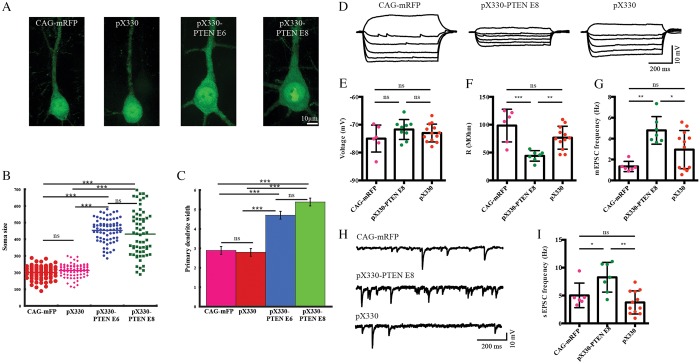
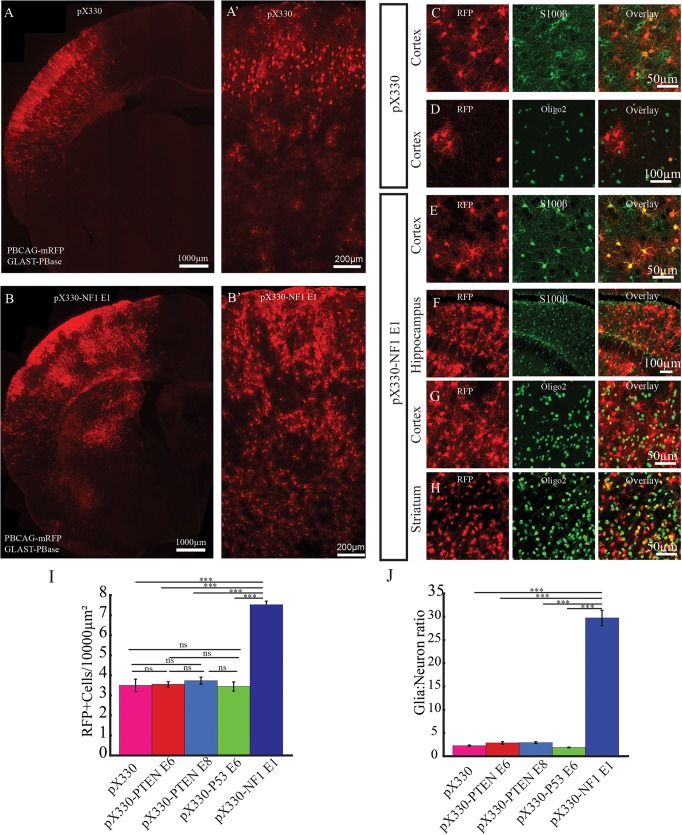
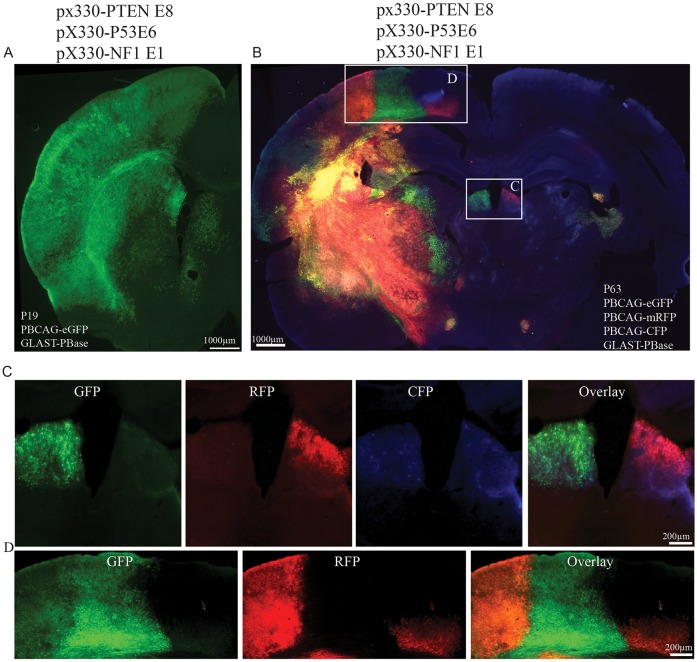
The ability to induce targeted mutations in somatic cells in developing organisms and then track the fates of those cells is a powerful approach both for studying neural development and for modeling human disease. The CRISPR/Cas9 system allows for such targeted mutagenesis, and we therefore tested it in combination with a piggyBac transposase lineage labeling system to track the development of neocortical neural progenitors with targeted mutations in genes linked to neurodevelopmental disruptions and tumor formation. We show that sgRNAs designed to target PTEN successfully decreased PTEN expression, and led to neuronal hypertrophy and altered neuronal excitability. Targeting NF1, by contrast, caused increased astrocytogenesis at the expense of neurogenesis, and combined targeting of three tumor suppressors (PTEN, NF1 and P53) resulted in formation of glioblastoma tumors. Our results demonstrate that CRISPR/Cas9 combined with piggyBac transposase lineage labeling can produce unique models of neurodevelopmental disruption and tumors caused by somatic mutation in neural progenitors.

Keywords: CRISPR/Cas9; Glioblastoma multiforme; In utero electroporation; Lineage; Neural progenitors; piggyBac.


Conflict of interest statement

Competing interests

The authors declare no competing or financial interests.

Figures

Fig. 1.
Fig. 1.
CRISPR/Cas9 knocks out PTEN expression in vivo. (A) sgRNA sequences used in this study. (B) Schematic of IUE. Plasmids DNA were injected into lateral ventricle of E14-15 rat embryos followed by electroporation. Analyses were performed at various postnatal times. (C) Representative images of PTEN antibody staining on brains sections from pX330-, pX330-PTEN E6- and pX330-PTEN E8-transfected brains. CRISPR constructs targeting PTEN exon 6 and 8 abolished endogenous PTEN expression in postmitotic neurons. IUE was performed at E14 and brains were analyzed at P19. Arrowheads indicate GFP-labeled PTEN positive neurons. Asterisks indicate GFP-labeled PTEN-negative neurons. (D) Representative images from P19 brains transfected with CAG-mRFP, pX330, pX330-PTEN E6 and pX330-PTEN E8. A small fraction neurons transfected with PTEN-targeting CRISPR constructs showed disrupted migration. IUE was performed at E14 and brains were analyzed at P19. (E) Quantification results of neuronal migration. Cerebral cortex was divided into five bins with bin 1 close to white matter and bin 5 close to pial surface. About 10% of PTEN-targeting CRISPR-transfected neurons failed to migrate to their normal laminar position (n=3, one-way ANOVA; *P<0.05; ns, no significant difference; data are presented as means±s.e.m.). WM, white matter.
Fig. 2.
Fig. 2.
PTEN null neurons were hypertrophic and exhibited altered membrane properties. (A) Representative images of P19 neurons transfected at E14 with CAG-mRFP, pX330, pX330-PTEN E6 and pX330-PTEN E8. (B,C) Neurons transfected with PTEN-targeting CRISPR were hypertrophic. PTEN-targeting CRISPR-transfected neurons displayed increased soma size (B) and thickened primary dendrite (C). (D-I) PTEN-targeting CRISPR-transfected neurons showed altered neurophysiological properties. (D) Representative traces from CAG-mRFP-, pX330- and PTEN-targeting CRISPR-transfected neurons representing voltage responses to −300, −250, −200, −150, −100, −50, −20 and 50 pA step current injections. (E) CAG-mRFP-, empty CRISPR construct pX330- and PTEN-targeting CRISPR-transfected neurons showed similar resting membrane potential. However, PTEN-targeting CRISPR-transfected neurons demonstrated markedly decreased input resistance (F), increased miniature EPSCs (G) and spontaneous EPSCs (I). Representative traces of spontaneous EPSCs are shown in H. One-way ANOVA followed by Turkey's multiple comparison test, *P<0.05; **P<0.01; ***P<0.001; ns, no significant difference; data are presented as means±s.e.m.
Fig. 3.
Fig. 3.
Loss of NF1 expression and increased gliogenesis. (A-B′) Representative images of P19 rat brains transfected with either control empty pX330 (A,A′) or pX330-NF1 E1 (B,B′). IUE was performed at E14 with the piggyBac transposon system (GLAST-PBase and PBCAG-mRFP) to track the lineage of transfected neural progenitors. A and B are representative images of transfected hemispheres. A′ and B′ are representative images of transfected neocortex. (C-H) In brains transfected with pX330, astrocytes (C) and oligodendrocytes (D) were labeled in neocortex. However, in brains transfected with pX330-NF1 E1, mRFP-labeled astrocytes (E,F) and oligodendrocytes (G,H) were frequently found in neocortex (E,G), hippocampus (F) and striatum (H). (I,J) The density of mRFP-labeled cells in neocortex (I) as well as the glia:neuron ratio of mRFP-labeled cells (J) were significantly higher in pX330-NF1 E1-transfected brains (n=3, one-way ANOVA, followed by post hoc Tukey HSD; ***P<0.001; ns, no significant difference; data are presented as means±s.e.m.).
Fig. 4.
Fig. 4.
Multiplex CRISPR-induced tumors. (A) Representative images of P19 brain transfected with CRISPR targeting PTEN, P53 and NF1. Densely packed GFP-labeled cells were frequently found throughout the transfected cerebral hemisphere. (B) Representative image from postmortem P63 rat brains transfected with CRISPR targeting PTEN, P53 and NF1 together with multicolor piggyBac system. (C) Magnified view of boxed area in B shows two different colored tumor clusters, suggesting clonal separation. (D) Magnified view of boxed area in B shows mixing of three different colored tumor clusters.
Fig. 5.
Fig. 5.
Induced mutations at targeted loci in sorted tumor cells. (A-C) Indels at PTEN (A), P53 (B) and NF1 (C) locus in induced GBM. Wild-type (WT) sequences are listed at the top of each figure. sgRNA sequence is marked in green and protospacer adjacent motif (PAM) sequence is underlined. Identified mutations are shown in red. −, deletion; +, insertion; S, substitution; numbers in red indicate number of nucleotides that have changed. (D) Summary of the mutation type (indel in frame, indel out frame and amino acids substitution) introduced at PTEN, P53 and NF1 loci.

References

    1. Backman S. A., Stambolic V., Suzuki A., Haight J., Elia A., Pretorius J., Tsao M.-S., Shannon P., Bolon B., Ivy G. O. et al. (2001). Deletion of Pten in mouse brain causes seizures, ataxia and defects in soma size resembling Lhermitte-Duclos disease. Nat. Genet. 29, 396-403. 10.1038/ng782 - DOI - PubMed
    1. Bae S., Kweon J., Kim H. S. and Kim J.-S. (2014). Microhomology-based choice of Cas9 nuclease target sites. Nat. Methods 11, 705-706. 10.1038/nmeth.3015 - DOI - PubMed
    1. Chen F. and LoTurco J. (2012). A method for stable transgenesis of radial glia lineage in rat neocortex by piggyBac mediated transposition. J. Neurosci. Methods 207, 172-180. 10.1016/j.jneumeth.2012.03.016 - DOI - PMC - PubMed
    1. Chen B., Gilbert L. A., Cimini B. A., Schnitzbauer J., Zhang W., Li G.-W., Park J., Blackburn E. H., Weissman J. S., Qi L. S. et al. (2013). Dynamic imaging of genomic loci in living human cells by an optimized CRISPR/Cas system. Cell 155, 1479-1491. 10.1016/j.cell.2013.12.001 - DOI - PMC - PubMed
    1. Chen F., Becker A. J. and LoTurco J. J. (2014a). Contribution of tumor heterogeneity in a new animal model of CNS tumors. Mol. Cancer Res. 12, 742-753. 10.1158/1541-7786.MCR-13-0531 - DOI - PMC - PubMed

Publication types

MeSH terms