Transfer RNA detection by small RNA deep sequencing and disease association with myelodysplastic syndromes
- PMID: 26400237
- PMCID: PMC4581457
- DOI: 10.1186/s12864-015-1929-y
Transfer RNA detection by small RNA deep sequencing and disease association with myelodysplastic syndromes
Abstract
Background: Although advances in sequencing technologies have popularized the use of microRNA (miRNA) sequencing (miRNA-seq) for the quantification of miRNA expression, questions remain concerning the optimal methodologies for analysis and utilization of the data. The construction of a miRNA sequencing library selects RNA by length rather than type. However, as we have previously described, miRNAs represent only a subset of the species obtained by size selection. Consequently, the libraries obtained for miRNA sequencing also contain a variety of additional species of small RNAs. This study looks at the prevalence of these other species obtained from bone marrow aspirate specimens and explores the predictive value of these small RNAs in the determination of response to therapy in myelodysplastic syndromes (MDS).
Methods: Paired pre and post treatment bone marrow aspirate specimens were obtained from patients with MDS who were treated with either azacytidine or decitabine (24 pre-treatment specimens, 23 post-treatment specimens) with 22 additional non-MDS control specimens. Total RNA was extracted from these specimens and submitted for next generation sequencing after an additional size exclusion step to enrich for small RNAs. The species of small RNAs were enumerated, single nucleotide variants (SNVs) identified, and finally the differential expression of tRNA-derived species (tDRs) in the specimens correlated with diseasestatus and response to therapy.
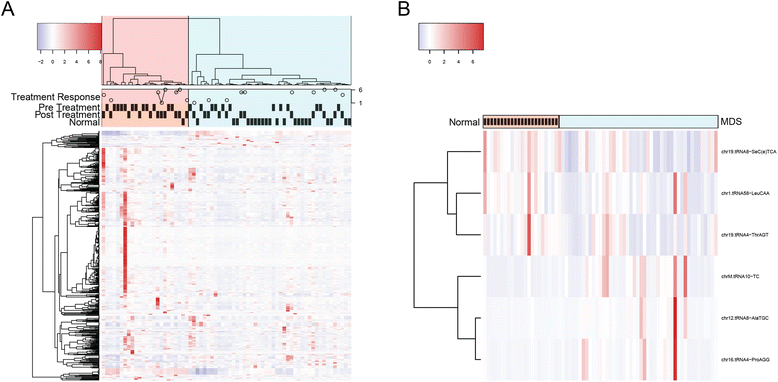
Results: Using miRNA sequencing data generated from bone marrow aspirate samples of patients with known MDS (N = 47) and controls (N = 23), we demonstrated that transfer RNA (tRNA) fragments (specifically tRNA halves, tRHs) are one of the most common species of small RNA isolated from size selection. Using tRNA expression values extracted from miRNA sequencing data, we identified six tRNA fragments that are differentially expressed between MDS and normal samples. Using the elastic net method, we identified four tRNAs-derived small RNAs (tDRs) that together can explain 67 % of the variation in treatment response for MDS patients. Similar analysis of specifically mitochondrial tDRs (mt-tDRs) identified 13 mt-tDRs which distinguished disease status in the samples and a single mt-tDR which predited response. Finally, 14 SNVs within the tDRs were found in at least 20 % of the MDS samples and were not observed in any of the control specimens.
Discussion: This study highlights the prevalence of tDRs in RNA-seq studies focused on small RNAs. The potential etiologies of these species, both technical and biologic, are discussed as well as important challenges in the interpretation of tDR data.
Conclusions: Our analysis results suggest that tRNA fragments can be accurately detected through miRNA sequencing data and that the expression of these species may be useful in the diagnosis of MDS and the prediction of response to therapy.
Figures


Similar articles
-
MicroRNAs and tRNA-derived fragments predict the transformation of myelodysplastic syndromes to acute myeloid leukemia.Leuk Lymphoma. 2017 Sep;58(9):1-15. doi: 10.1080/10428194.2016.1272680. Epub 2017 Jan 13. Leuk Lymphoma. 2017. PMID: 28084850 Free PMC article.
-
Integrative analysis of next generation sequencing for small non-coding RNAs and transcriptional regulation in Myelodysplastic Syndromes.BMC Med Genomics. 2011 Feb 23;4:19. doi: 10.1186/1755-8794-4-19. BMC Med Genomics. 2011. PMID: 21342535 Free PMC article.
-
Circulating Small Noncoding RNAs Have Specific Expression Patterns in Plasma and Extracellular Vesicles in Myelodysplastic Syndromes and Are Predictive of Patient Outcome.Cells. 2020 Mar 26;9(4):794. doi: 10.3390/cells9040794. Cells. 2020. PMID: 32224889 Free PMC article.
-
Deregulated microRNA expression and its pathogenetic implications for myelodysplastic syndromes.Hematology. 2016 Dec;21(10):593-602. doi: 10.1080/10245332.2016.1193962. Epub 2016 Jun 30. Hematology. 2016. PMID: 27357100 Review.
-
The use of high-throughput sequencing methods for plant microRNA research.RNA Biol. 2015;12(7):709-19. doi: 10.1080/15476286.2015.1053686. RNA Biol. 2015. PMID: 26016494 Free PMC article. Review.
Cited by
-
On the expanding roles of tRNA fragments in modulating cell behavior.Nucleic Acids Res. 2020 Sep 25;48(17):9433-9448. doi: 10.1093/nar/gkaa657. Nucleic Acids Res. 2020. PMID: 32890397 Free PMC article. Review.
-
Emerging roles of novel small non-coding regulatory RNAs in immunity and cancer.RNA Biol. 2020 Aug;17(8):1196-1213. doi: 10.1080/15476286.2020.1737442. Epub 2020 Mar 18. RNA Biol. 2020. PMID: 32186461 Free PMC article.
-
Comprehensive evaluation of extracellular small RNA isolation methods from serum in high throughput sequencing.BMC Genomics. 2017 Jan 7;18(1):50. doi: 10.1186/s12864-016-3470-z. BMC Genomics. 2017. PMID: 28061744 Free PMC article.
-
A micro-RNA expression signature for human NAFLD progression.J Gastroenterol. 2016 Oct;51(10):1022-30. doi: 10.1007/s00535-016-1178-0. Epub 2016 Feb 13. J Gastroenterol. 2016. PMID: 26874844 Free PMC article.
-
Global analysis of tRNA and translation factor expression reveals a dynamic landscape of translational regulation in human cancers.Commun Biol. 2018 Dec 21;1:234. doi: 10.1038/s42003-018-0239-8. eCollection 2018. Commun Biol. 2018. PMID: 30588513 Free PMC article.
References
Publication types
MeSH terms
Substances
Grants and funding
LinkOut - more resources
Full Text Sources
Other Literature Sources
Medical
Research Materials
Miscellaneous

