. 2015 Nov;114(5):2967-82.
doi: 10.1152/jn.00434.2015. Epub 2015 Sep 23.

Learning to balance on one leg: motor strategy and sensory weighting

Affiliations

Learning to balance on one leg: motor strategy and sensory weighting

Jaap H van Dieën et al. J Neurophysiol. 2015 Nov.

Abstract

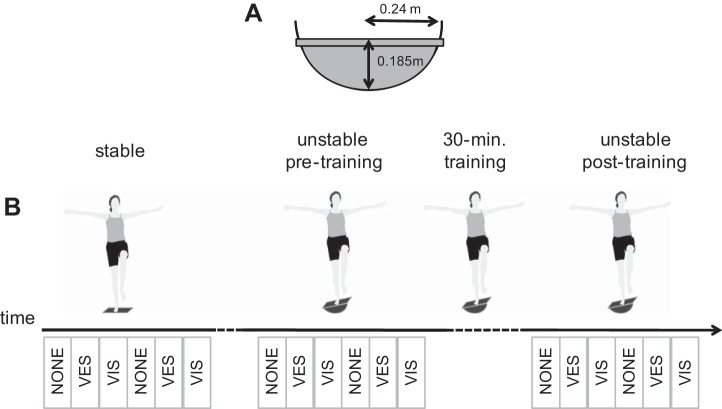
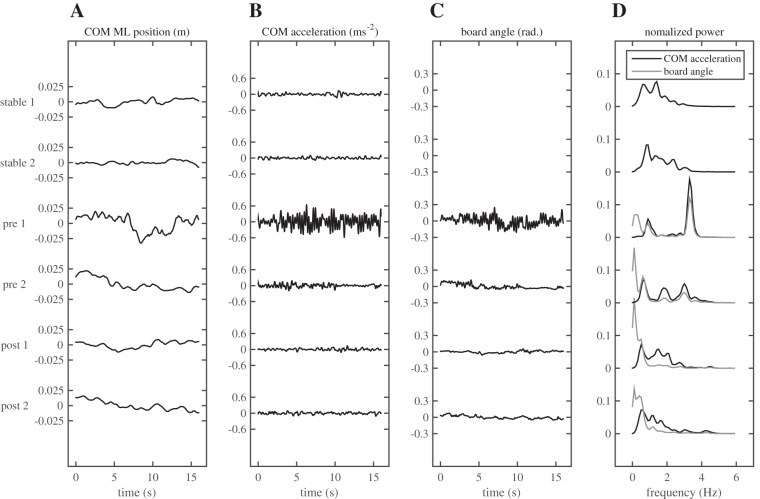
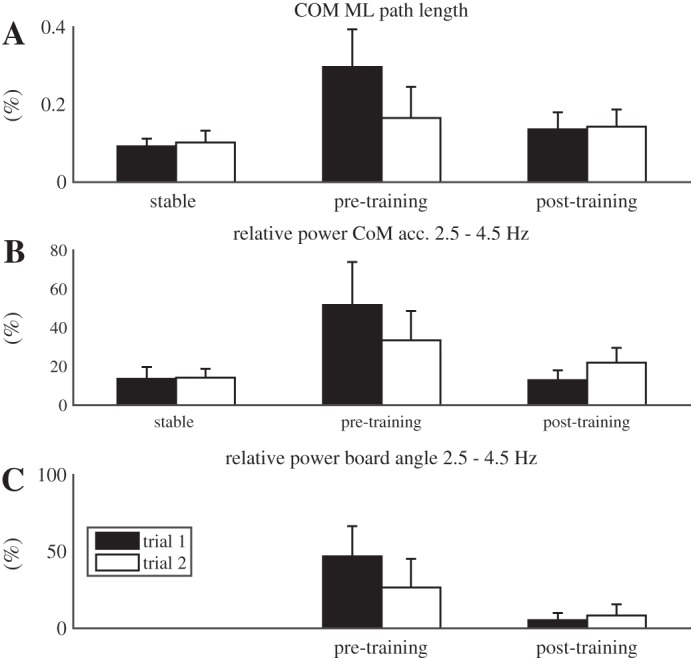
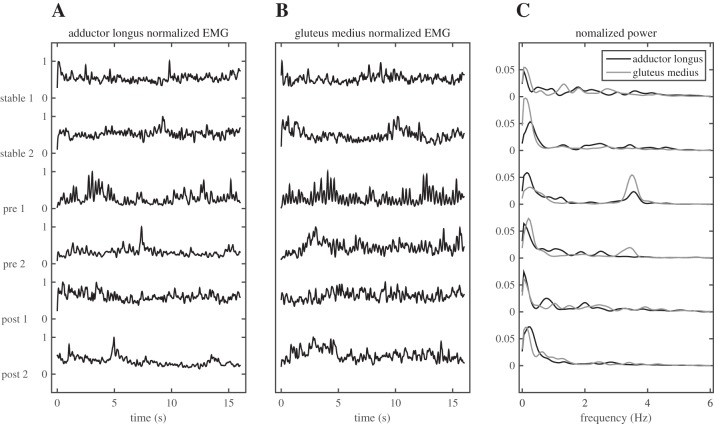
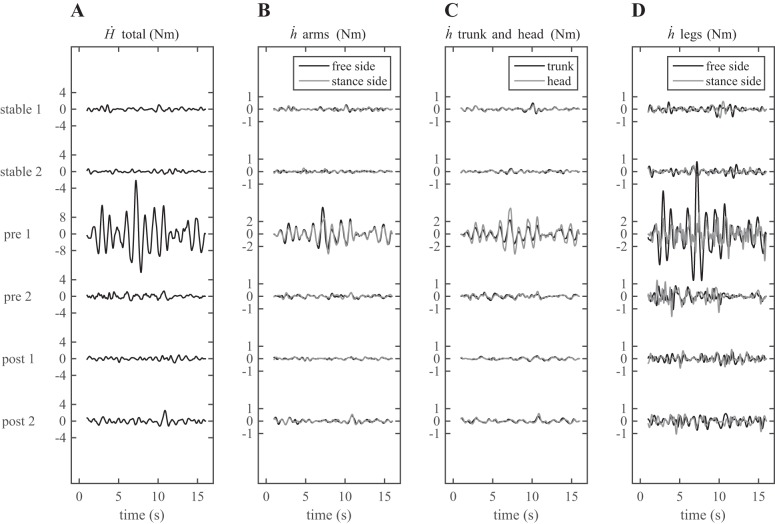
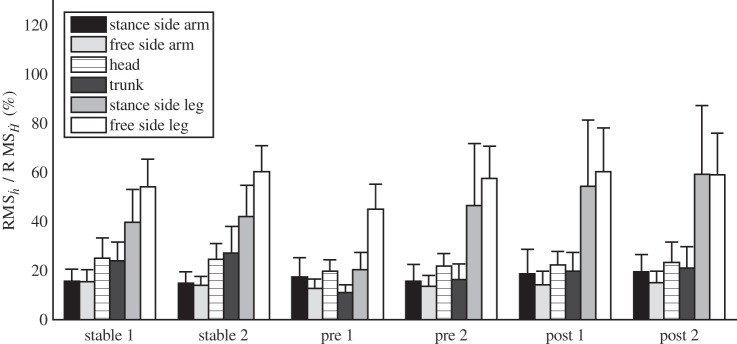
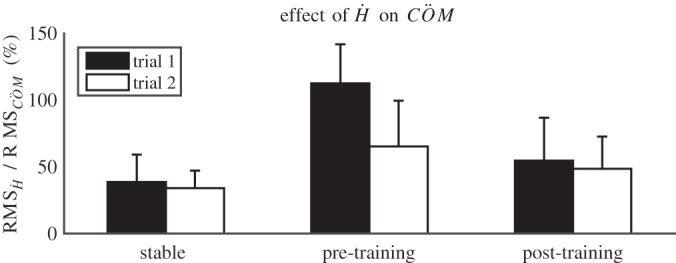
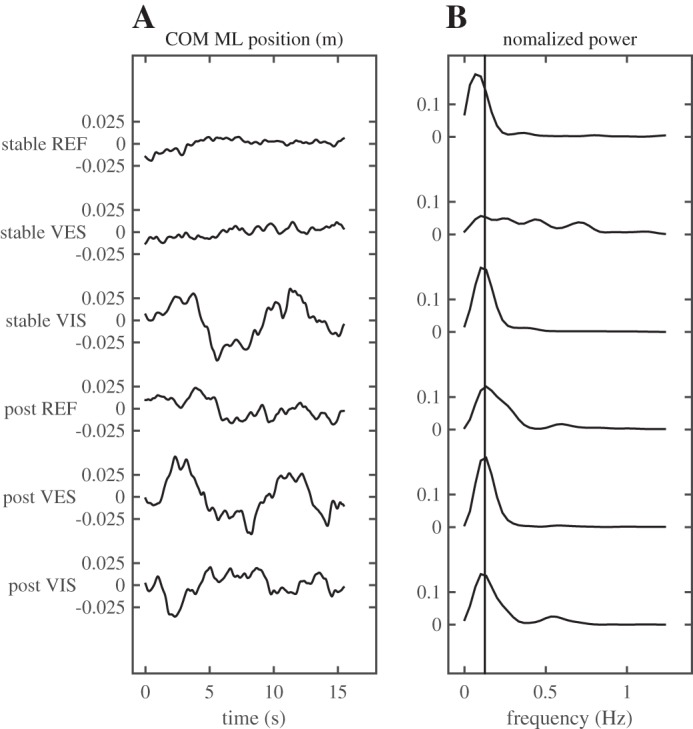
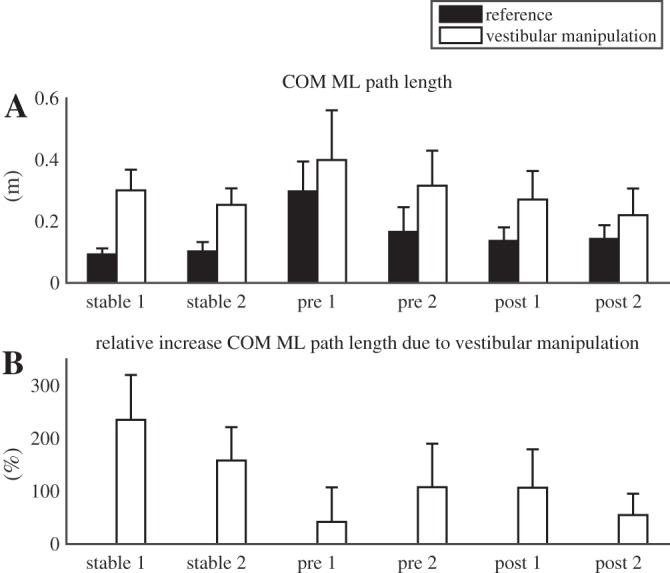
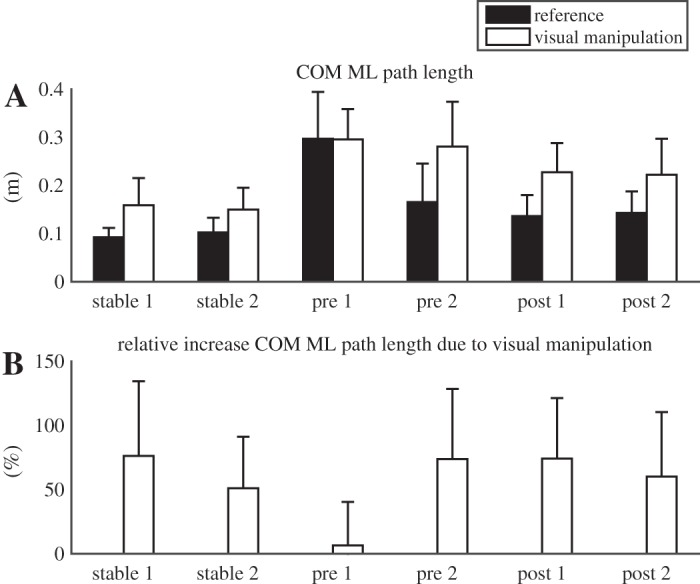
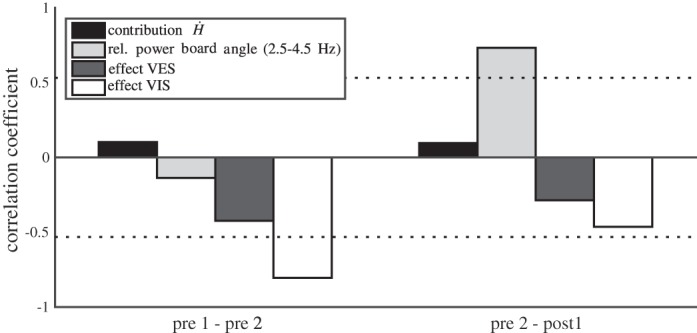
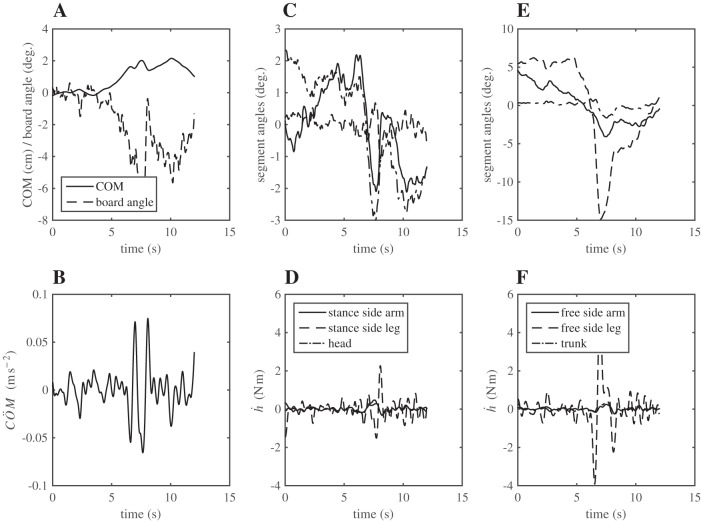
We investigated motor and sensory changes underlying learning of a balance task. Fourteen participants practiced balancing on one leg on a board that could freely rotate in the frontal plane. They performed six, 16-s trials standing on one leg on a stable surface (2 trials without manipulation, 2 with vestibular, and 2 with visual stimulation) and six trials on the balance board before and after a 30-min training. Center of mass (COM) movement, segment, and total angular momenta and board angles were determined. Trials on stable surface were compared with trials after training to assess effects of surface conditions. Trials pretraining and posttraining were compared to assess rapid (between trials pretraining) and slower (before and after training) learning, and sensory manipulation trials were compared with unperturbed trials to assess sensory weighting. COM excursions were larger on the unstable surface but decreased with practice, with the largest improvement over the pretraining trials. Changes in angular momentum contributed more to COM acceleration on the balance board, but with practice this decreased. Visual stimulation increased sway similarly in both surface conditions, while vestibular stimulation increased sway less on the balance board. With practice, the effects of visual and vestibular stimulation increased rapidly. Initially, oscillations of the balance board occurred at 3.5 Hz, which decreased with practice. The initial decrease in sway with practice was associated with upweighting of visual information, while later changes were associated with suppression of oscillations that we suggest are due to too high proprioceptive feedback gains.

Keywords: motor learning; postural control; sensory integration; sway.


Figures

Fig. 1.
Fig. 1.
Overview of the experimental conditions. A: illustration of the unstable object. B: illustration of the posture of the subjects and the procedure with the 3 experimental conditions: stable surface, unstable surface pretraining, and unstable surface posttraining, intermitted by 30 min of training. In between trials on stable and unstable surfaces, subjects performed 2 practice trials of 16 s on the unstable surface. The total period between measurements on stable and unstable surfaces was ∼5 min. Rest periods between trials within each block of 6 trials lasted 20–30 s. The blocks below the time line represent the 18 trials, with NONE referring to no sensory manipulations, VES referring to vestibular manipulation, and VIS to visual manipulation. Note that the order of the latter 2 conditions varied over subjects. Motor strategies used in balancing were analyzed based on the trials without manipulations. Surface effects were analyzed based on averages over the trials on the stable surface and averages over the trials in the unstable posttraining condition. Training effects were analyzed based on separate trials of the unstable pretraining and unstable posttraining conditions.
Fig. 2.
Fig. 2.
Typical example of the times series of the mediolateral (ML) position of the center of mass (COM; A), its acceleration (B), the angle of the board with the horizontal (C), and of the normalized power spectra of the latter 2 variables (D) for all trials without sensory manipulations. Note the much larger COM excursion in the 1st pretraining trial and the peaks in the power spectra at ∼3.5 Hz in both pretraining trials.
Fig. 3.
Fig. 3.
Mean values of the total excursion of the body COM in ML direction (A), the relative power of COM acceleration between 2.5 and 4.5 Hz (B), and the relative power of the board angle between 2.5 and 4.5 Hz (C) for all trials without sensory manipulations. Error bars indicate 1 SD.
Fig. 4.
Fig. 4.
Typical example of EMG data in trials without sensory manipulations, showing the linear envelopes normalized to their maximum values (A and B) and the power spectra of the linear envelopes (C) for all trials without sensory manipulations. Note the strong increase in muscle activity in the 1st pretraining trial or the unstable surface and the peaks in power at ∼3.5 Hz in the pretraining trials on the unstable surface.
Fig. 5.
Fig. 5.
Typical examples of the time series of the derivatives of the total angular momentum (; A) and of the angular momenta () of both arms (B), trunk and head (C), and both legs (D) for all trials without sensory manipulations. Note that the y-axes scales have been adjusted for the 1st trial pretraining to improve readability.
Fig. 6.
Fig. 6.
Average root mean squared (RMS) values of the derivatives of the angular momenta () of the separate segments expressed as percentage of the RMS values of the total angular momentum () for all trials without sensory manipulations. Error bars indicate 1 SD.
Fig. 7.
Fig. 7.
Factor loading of the time series of after varimax rotation of principal component analysis (PCA) results on data of all participants and all trials. Factor 1 mainly describes of the arms, head, and trunk. Factor 2 describes out-of-phase variations of of the stance leg, and factor 3 mainly describes variations in of the free (nonstance) leg.
Fig. 8.
Fig. 8.
Mean values of the effect of the derivative of body angular momentum () or the hip strategy on the COM acceleration (calculated according to Eq. 3). Note that the effect of on the acceleration exceeds 100% when the ankle strategy counteracts effects of on the control of the COM (i.e., of the hip strategy). Error bars indicate 1 SD.
Fig. 9.
Fig. 9.
Typical example of the times series of the ML position of the COM (A) and its normalized power spectrum (B), comparing trials with and without sensory manipulations. The last three trials on the rigid and on the unstable surface are plotted here. Note the increase in COM excursion and the peaks in the power spectra at the 0.125 Hz frequency in trials with sensory manipulations. REF, reference; VES, vestibular manipulation (galvanic vestibular stimulation); VIS, visual manipulation (moving scenery).
Fig. 10.
Fig. 10.
Mean values of the total excursion of the body COM in ML direction (A) and the relative effects (B) of the vestibular manipulation, surface condition and training on the ML excursion of the COM. Error bars indicate 1 SD.
Fig. 11.
Fig. 11.
Mean values of the total excursion of the body COM in ML direction (A) and the relative effects (B) of the visual manipulation, surface condition, and training on the ML excursion of the COM. Error bars indicate 1 SD.
Fig. 12.
Fig. 12.
Pearson's correlation coefficients between changes between trials in balance performance (COM mediolateral path length) and changes between trials in the contribution of the derivative of the angular momentum () to COM acceleration in the relative power between 2.5 and 4.5 Hz of the board angle and in the effects of the vestibular and visual manipulation on COM excursion. Pre 1-pre 2 refers to the differences between the 2 pretraining trials. Pre 2-post 1 refers to differences between the 2nd pretraining trial and the 1st posttraining trial. The dashed horizontal line indicates the threshold for significance at α < 0.05.
Fig. 13.
Fig. 13.
Example of a participant decelerating COM movement with a sudden movement of the nonstance leg. The COM can be seen to start moving towards the right (positive) side after ∼3 s in the trial, coinciding with gradual tilting of the balance board (A). After 6 s in the trial the COM is decelerated, as reflected in a negative peak in the COM acceleration (B). This peak is the result of a left, nonstance leg movement initiated after ∼6 s as illustrated in C and D, which shows the orientation of the segments after subtraction of their mean values. This movement gives rise to the negative angular momentum of the free leg (E and F), which causes the negative acceleration of the COM that limits further right COM movement.

References

    1. Andreopoulou G, Maaswinkel E, Cofre Lizama LE, van Dieen JH. Effects of support surface stability on feedback control of trunk posture. Exp Brain Res 233: 1079–1087, 2015. - PubMed
    1. Asseman FB, Caron O, Crémieux J. Are there specific conditions for which expertise in gymnastics could have an effect on postural control and performance? Gait Posture 27: 76–81, 2008. - PubMed
    1. Assländer L, Peterka RJ. Sensory reweighting dynamics in human postural control. J Neurophysiol 111: 1852–1864, 2014. - PMC - PubMed
    1. Carriot J, Brooks JX, Cullen KE. Multimodal integration of self-motion cues in the vestibular system: active versus passive translations. J Neurosci 33: 19555–19566, 2013. - PMC - PubMed
    1. Chalmers GR, Knutzen KM. Soleus H-reflex gain in healthy elderly and young adults when lying, standing, and balancing. J Gerontol A Biol Sci Med Sci 57: B321–B329, 2002. - PubMed

LinkOut - more resources