. 2015 Sep 23;35(38):12994-3005.
doi: 10.1523/JNEUROSCI.0407-15.2015.

Amygdala Signaling during Foraging in a Hazardous Environment

Affiliations

Amygdala Signaling during Foraging in a Hazardous Environment

Alon Amir et al. J Neurosci. .

Abstract

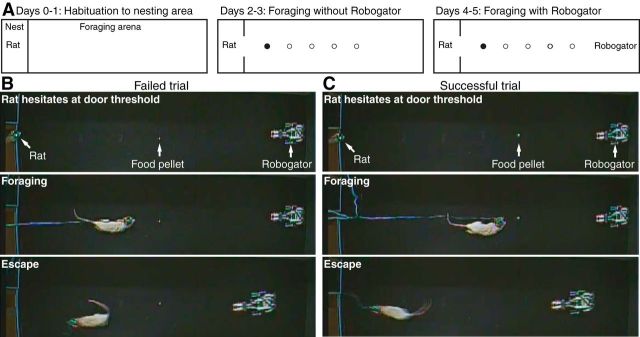
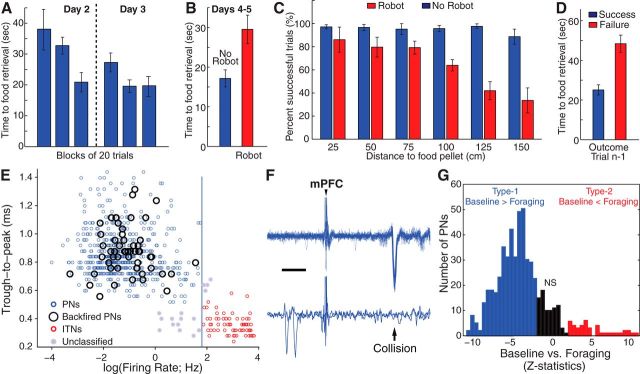
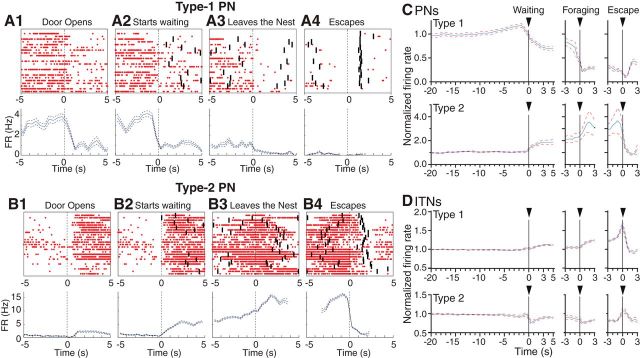
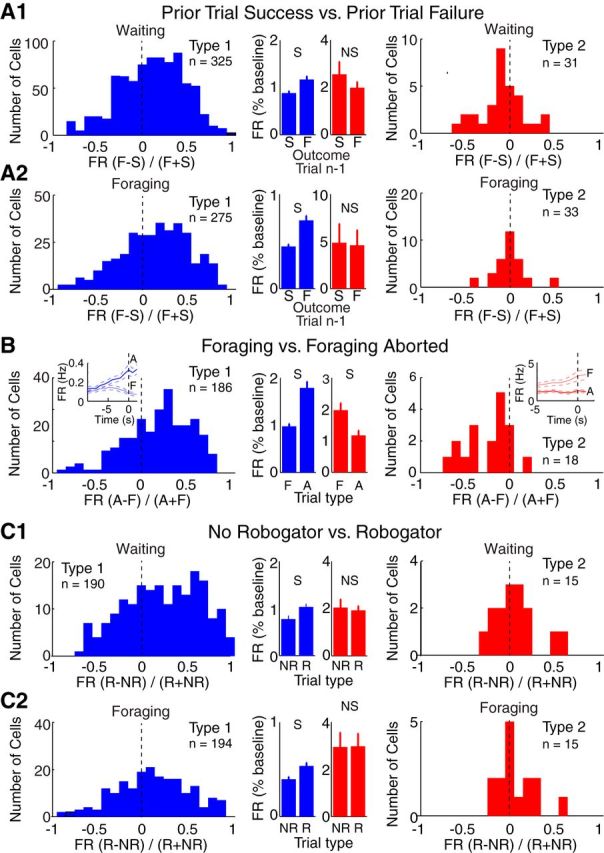
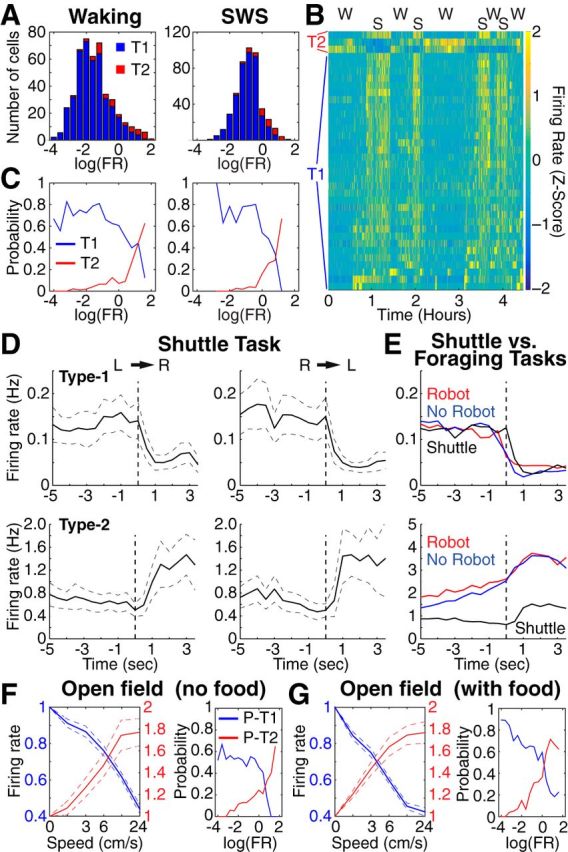
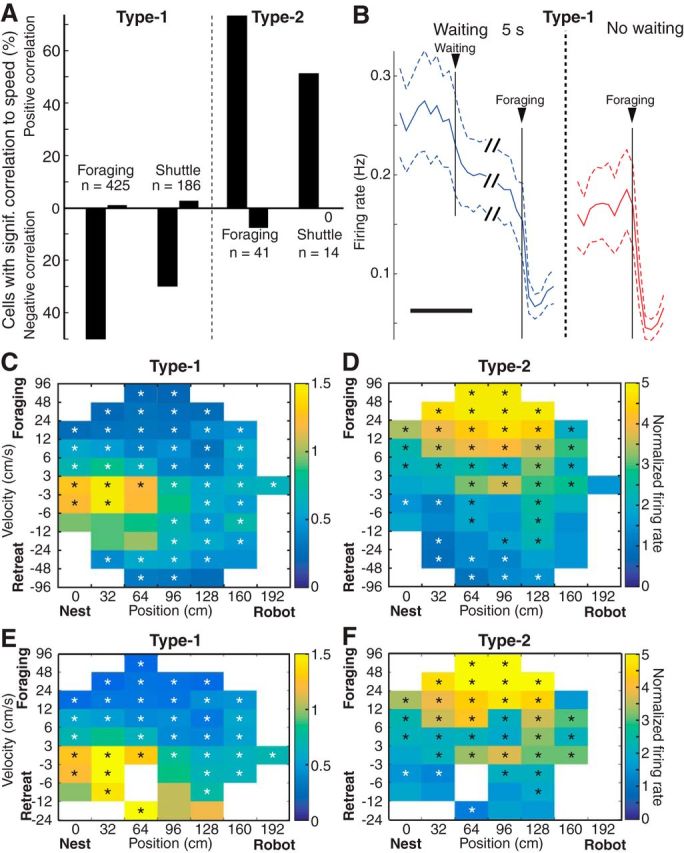
We recorded basolateral amygdala (BL) neurons in a seminaturalistic foraging task. Rats had to leave their nest to retrieve food in an elongated arena inhabited by a mechanical predator. There were marked trial-to-trial variations in behavior. After poking their head into the foraging arena and waiting there for a while, rats either retreated to their nest or initiated foraging. Before initiating foraging, rats waited longer on trials that followed failed than successful trials indicating that prior experience influenced behavior. Upon foraging initiation, most principal cells (Type-1) reduced their firing rate, while in a minority (Type-2) it increased. When rats aborted foraging, Type-1 cells increased their firing rates, whereas in Type-2 cells it did not change. Surprisingly, the opposite activity profiles of Type-1 and Type-2 units were also seen in control tasks devoid of explicit threats or rewards. The common correlate of BL activity across these tasks was movement velocity, although an influence of position was also observed. Thus depending on whether rats initiated movement or not, the activity of BL neurons decreased or increased, regardless of whether threat or rewards were present. Therefore, BL activity not only encodes threats or rewards, but is closely related to behavioral output. We propose that higher order cortical areas determine task-related changes in BL activity as a function of reward/threat expectations and internal states. Because Type-1 and Type-2 cells likely form differential connections with the central amygdala (controlling freezing), this process would determine whether movement aimed at attaining food or exploration is suppressed or facilitated. Significance statement: For decades, amygdala research has been dominated by pavlovian and operant conditioning paradigms. This work has led to the view that amygdala neurons signal threats or rewards, in turn causing defensive or approach behaviors. However, the artificial circumstances of conditioning studies bear little resemblance to normal life. In natural conditions, subjects are simultaneously presented with potential threats and rewards, forcing them to engage in a form of risk assessment. We examined this process using a seminaturalistic foraging task. In constant conditions of threats and rewards, amygdala activity could be high or low, depending on the rats' decisions on a given trial. Therefore, amygdala activity does not only encode threats or rewards but is also closely related to behavioral output.

Keywords: amygdala; approach; defensive behaviors; reward; threat.


Figures

Figure 1.
Figure 1.
Experimental paradigm and behavioral apparatus. A, The behavioral apparatus consisted of a small, dimly lit nesting area and a longer and brighter foraging arena. After 2 d of habituation to the nest (left), rats learned to retrieve food pellets in the foraging arena (middle) over a period of 2 d. One the fourth and fifth day, a mechanical predator (Robogator) was introduced (right). B, C, Examples of failed (B) and successful (C) trials.
Figure 2.
Figure 2.
Behavior and classification of BL unit recordings. A, Time from door opening to food retrieval (y-axis) in successive blocks of 20 trials on Days 2–3 in six rats. Trials with nest to food distance ≤ 50 cm were ignored, leaving 352 trials. B, Time to food retrieval on alternating trial blocks with (red) or without (blue) Robogator. C, Proportion of successful trials (y-axis) as a function of distance to food pellet (x-axis) in trials with (red) or without (blue) Robogator. D, Time to food retrieval (y-axis) when the prior Robogator trial (trial n − 1) was a success (blue) versus a failure (red). E, Scatter plot of spike duration (y-axis), defined as trough to peak interval, as a function of firing rate (x-axis). Units were classified as PNs (blue) when they had a spike duration ≥ 0.55 ms and firing rate ≤ 6 Hz and as ITNs (red) when they generated spikes < 0.6 ms and fired at > 6 Hz. Empty black circles, units formally identified as PNs by antidromic invasion from a BL projection field. F, Example of PN backfired from mPFC (top, 25 superimposed responses; bottom, two trials where the antidromic spike collided with a spontaneously occurring action potential). Scale bar, 5 ms. G, Frequency distribution of z-statistics (from Wilcoxon rank sum test) for firing rate differences between baseline and foraging in PNs. Blue and red, Units with significantly higher or lower firing rates during baseline than foraging, respectively. Black, Cells with nonsignificant (NS) differences.
Figure 3.
Figure 3.
Histological verification of recording sites. A, Coronal sections of the amygdala at relatively anterior (A1) and posterior (A2) levels showing location of silicon probes in the BL nucleus and electrolytic lesions (arrows) marking the deepest recording sites. B, Schemes showing location and trajectory of silicon probes on nine coronal sections arranged from rostral (top left) to caudal (bottom right). Different colors are used for the six different rats. Gray indicates recording sites we did not consider because they were not inside the BL nucleus. CE, central nucleus of the amygdala; CO, cortical nucleus of the amygdala; BM, basomedial nucleus of the amygdala; LA, lateral nucleus of the amygdala; ME, medial nucleus of the amygdala; OT, optic tract; rh, rhinal sulcus; V, ventricle.
Figure 4.
Figure 4.
Examples and average activity of PNs. A1–A4, Top, Type-1 PN. Rasters showing spikes (red dots) generated within ±5 s of salient task events in 25 trials: door opening (A1), waiting onset (A2), foraging onset (A3), and escape (A4). The “start waiting” time point was defined as when the rat approached the door threshold and had at least its snout extending past the door, into the foraging arena. The start of the “escape” phase was defined as when the rat, after approaching the food pellet, abruptly turned around to run all the way to the nest. This behavior was observed whether the Robogator was present or not and whether the trial was successful or not. However, only successful trials are shown in this figure. Black bars indicate, for each trial, when the preceding and following task events occurred. A1–A4, Bottom, Average firing rate (±SEM) for a larger sample of trials than depicted in rasters (0.5 s bins). Type-2 PN. B1–B4, Top, Rasters showing spikes (red dots) generated within ±5 s of salient task events in 25 trials: door opening (B1), waiting onset (B2), foraging onset (B3), and escape (B4). Only successful trials are shown. Black bars indicate, for each trial, when the preceding and following task events occurred. B1–B4, Bottom, Average firing rate (±SEM) for a larger sample of trials than depicted in rasters (0.5 s bins). C, D, Population analyses. Normalized average firing rates (thick lines) ± SEM (thin dashed lines) of different types of units in relation to the main task events (marked above). Data were normalized to baseline firing rates (C, Type-1 0.22 ± 0.03, Type-2 1.64 ± 0.31; D, Type-1 24.2 ± 2.5, Type-2 23.8 ± 4.3). C, PNs of Type-1 (top; n = 425) and Type-2 (bottom, n = 41). D, ITNs of Type-1 (top, n = 44) and Type-2 (bottom, n = 14).
Figure 5.
Figure 5.
Firing rates of Type-1 and Type-2 PNs as a function of trial type. A–C, Comparison of firing rates as a function of trial type in Type-1 (blue, left) and Type-2 (red, right). Comparisons are as follows: (A) depending on whether the prior Robogator trial was a failure (F) or success (S) during waiting (A1) or foraging (A2); (B) depending on whether waiting at door threshold is followed by retreat back to the nest (A) or foraging (F); (C) depending on whether Robogator was present (R) or not (NR) during waiting (C1) and foraging (C2). Units were only included if ≥5 trials of each type were available and if they fired one spike in at least one trial. These exclusion criteria explain variations in the number of unit recordings considered in the various analyses (Type-1: A1, n = 325; A2, n = 275; B, n = 186; C1, n = 190; C2, n = 194; Type-2: A1, n = 31; A2, n = 33; B, n = 18; C1, n = 15; C2, n = 15). B, Insets, Firing rate as a function of time during waiting period followed by foraging (thin line) versus retreat in the nest (thick line). S, significant at 0.05 level. Central histograms and insets, averages ± SEM.
Figure 6.
Figure 6.
Activity variations of Type-1 and Type-2 PNs during QW, SWS, and in control tasks. A, Frequency distribution of firing rates among Type-1 (blue, n = 425) and Type-2 (red, n = 41) PNs in QW (left) and SWS (right). B, Z-scored firing rate of 36 simultaneously recorded PNs during spontaneous alternations between QW and SWS. C, Probability that a PN belongs to the Type-1 (blue, n = 425) or Type-2 (red, n = 41) classes plotted as a function of firing rate. D, Firing rate of Type-1 (top) or Type-2 (bottom) during shuttle task (left, left to right trials; right, right to left trials). D, E, Population averages (Type-1, n = 186; Type-2, n = 14). E, Comparison between PN activity during Robogator and shuttle tasks. Vertical dashed lines in D and E indicate when rats left the nest. F, Left, Firing rate during open field exploration (no food) plotted as a function of movement speed. Blue (n = 189) and red (n = 51), Units with significant negative or positive correlation to speed, respectively. Right, Probability that the firing rate of a PN is negatively (blue) or positively (red) correlated with speed plotted as a function of overall firing rate in QW. G, Left, Firing rate during open field exploration (with food pellets) plotted as a function of movement speed. Blue (n = 141) and red (n = 49), Units with significant negative or positive correlation to speed, respectively. Right, Probability that the firing rate of a PN is negatively (blue) or positively (red) correlated with speed plotted as a function of overall firing rate in QW.
Figure 7.
Figure 7.
Relation between the firing rate of PNs and movement speed in the foraging and shuttle tasks. A, Proportion of Type-1 (left) and Type-2 (right) PNs whose firing rate shows a significant negative (bottom) or positive (top) correlation to movement speed. B, Firing rates of Type-1 PNs on Robogator trials with long waiting periods (≥5 s, blue) or no waiting (red; n = 244; averages ± SEM). Scale bar, 10 s. Units were only included if ≥5 trials of each type were available. C, D, Color-coded firing rates of Type-1 (n = 339) and Type-2 (n = 33) PNs plotted as a function of movement speed (y-axis) and position (x-axis). Firing rates are normalized to baseline values. E, F, Same analysis as in C and D, with the exception that the final escape phase was excluded. C–F, Rectangles are only shown if (1) rats spent ≥4 s at the given position and velocity and (2) data from ≥50% of unit recordings had to be available for that position and speed. To assess significance, we shuffled the actual spike trains 1000 times while keeping velocity and position constant and then compared the actual data to the distribution of shuffled values. Black and white asterisks indicate bins that were higher or lower than 97.5% of shuffled values, respectively.

References

    1. Aarts E, Verhage M, Veenvliet JV, Dolan CV, van der Sluis S. A solution to dependency: using multilevel analysis to accommodate nested data. Nat Neurosci. 2014;17:491–496. doi: 10.1038/nn.3648. - DOI - PubMed
    1. Amano T, Duvarci S, Popa D, Paré D. The fear circuit revisited: contributions of the basal amygdala nuclei to conditioned fear. J Neurosci. 2011;31:15481–15489. doi: 10.1523/JNEUROSCI.3410-11.2011. - DOI - PMC - PubMed
    1. Ambroggi F, Ishikawa A, Fields HL, Nicola SM. Basolateral amygdala neurons facilitate reward-seeking behavior by exciting nucleus accumbens neurons. Neuron. 2008;59:648–661. doi: 10.1016/j.neuron.2008.07.004. - DOI - PMC - PubMed
    1. Anglada-Figueroa D, Quirk GJ. Lesions of the basal amygdala block expression of conditioned fear but not extinction. J Neurosci. 2005;25:9680–9685. doi: 10.1523/JNEUROSCI.2600-05.2005. - DOI - PMC - PubMed
    1. Barthó P, Hirase H, Monconduit L, Zugaro M, Harris KD, Buzsáki G. Characterization of neocortical principal cells and interneurons by network interactions and extracellular features. J Neurophysiol. 2004;92:600–608. doi: 10.1152/jn.01170.2003. - DOI - PubMed

Publication types

LinkOut - more resources