. 2015 Sep 23;35(38):13029-42.
doi: 10.1523/JNEUROSCI.1698-15.2015.

Complement C3-Deficient Mice Fail to Display Age-Related Hippocampal Decline

Affiliations

Complement C3-Deficient Mice Fail to Display Age-Related Hippocampal Decline

Qiaoqiao Shi et al. J Neurosci. .

Abstract

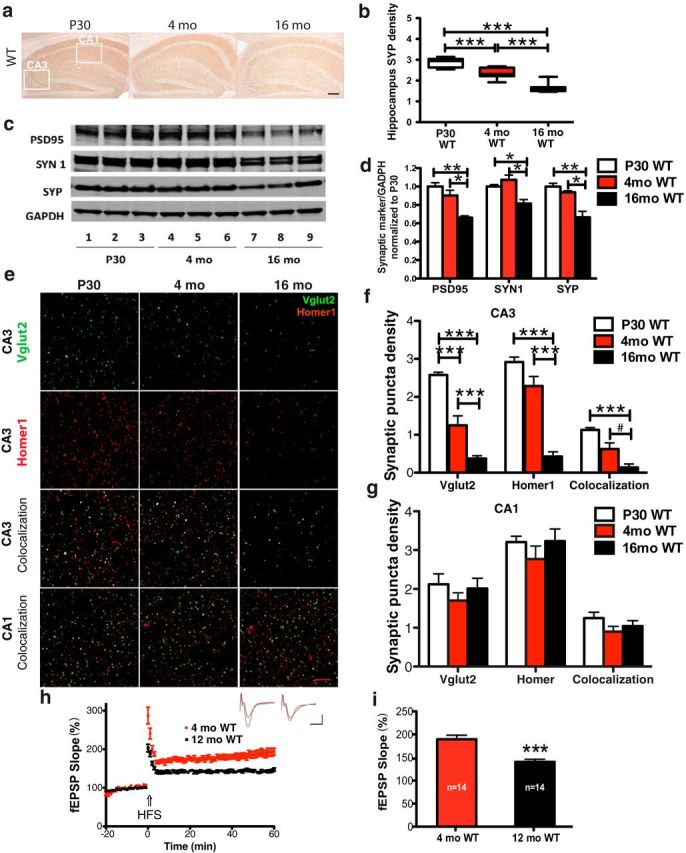
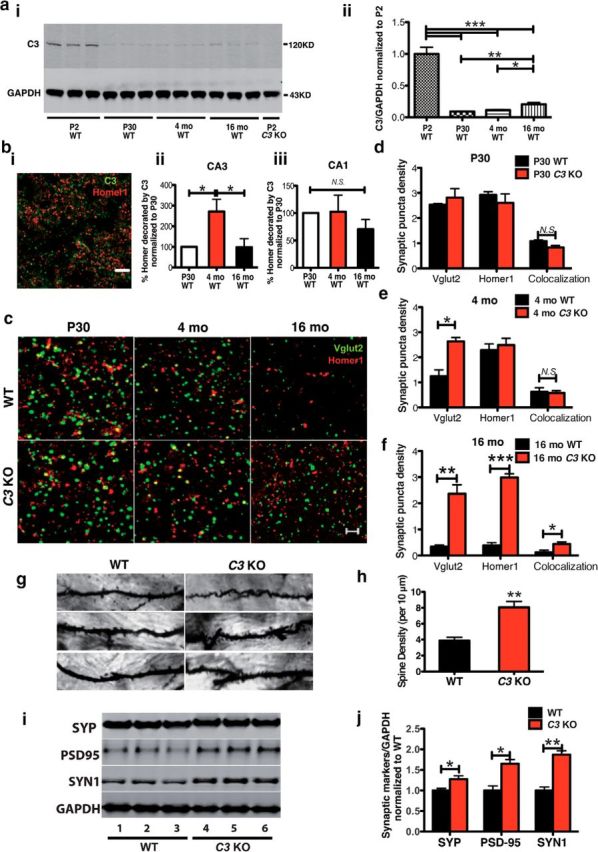
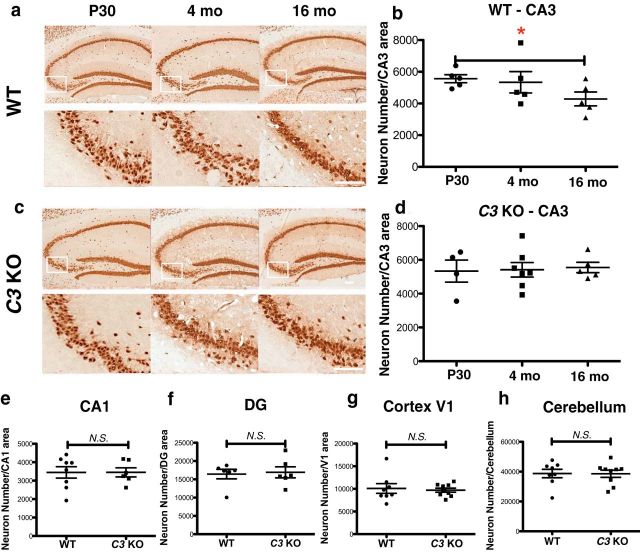
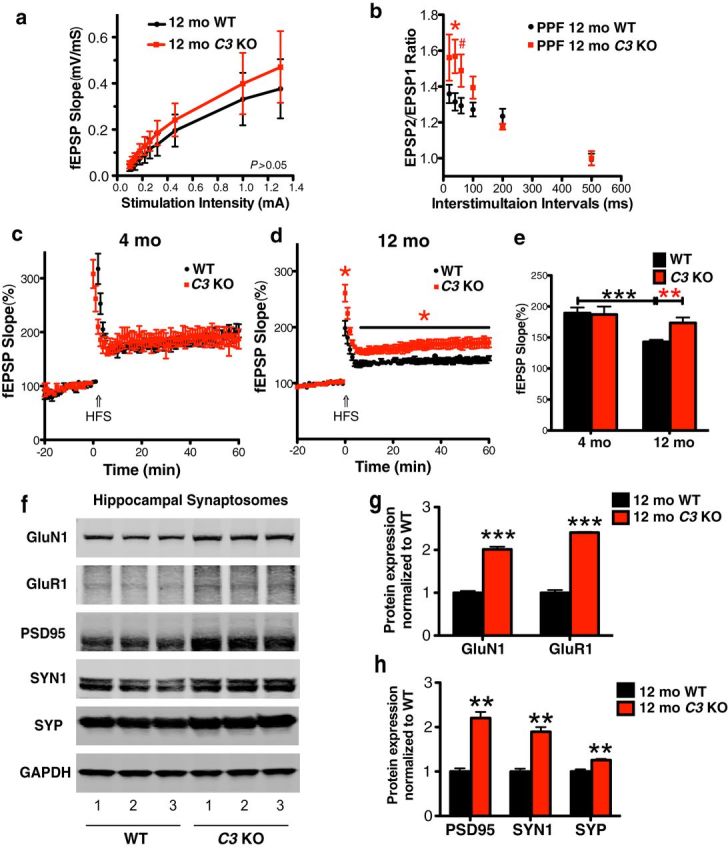
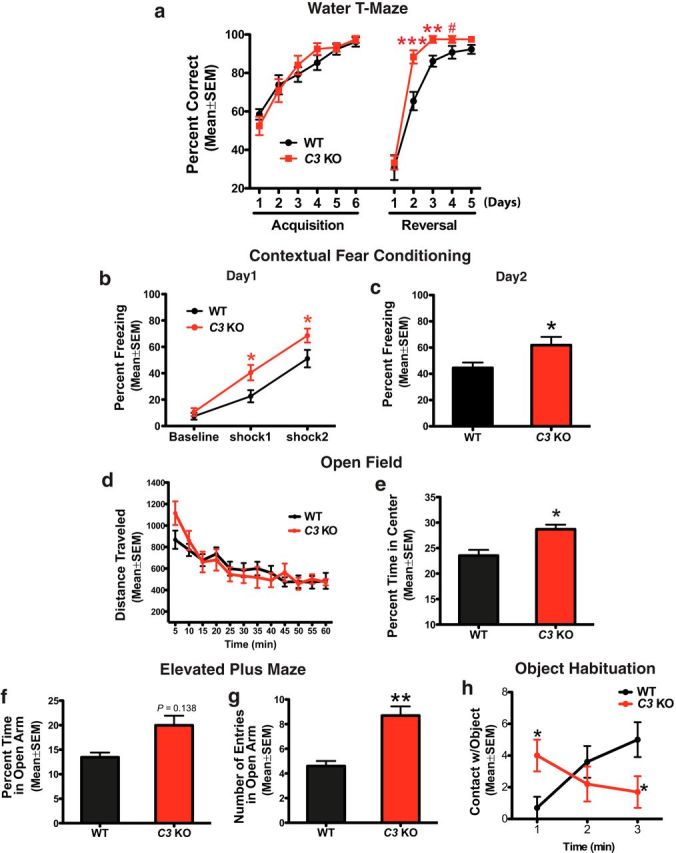
The complement system is part of the innate immune response responsible for removing pathogens and cellular debris, in addition to helping to refine CNS neuronal connections via microglia-mediated pruning of inappropriate synapses during brain development. However, less is known about the role of complement during normal aging. Here, we studied the role of the central complement component, C3, in synaptic health and aging. We examined behavior as well as electrophysiological, synaptic, and neuronal changes in the brains of C3-deficient male mice (C3 KO) compared with age-, strain-, and gender-matched C57BL/6J (wild-type, WT) control mice at postnatal day 30, 4 months, and 16 months of age. We found the following: (1) region-specific and age-dependent synapse loss in aged WT mice that was not observed in C3 KO mice; (2) age-dependent neuron loss in hippocampal CA3 (but not in CA1) that followed synapse loss in aged WT mice, neither of which were observed in aged C3 KO mice; and (3) significantly enhanced LTP and cognition and less anxiety in aged C3 KO mice compared with aged WT mice. Importantly, CA3 synaptic puncta were similar between WT and C3 KO mice at P30. Together, our results suggest a novel and prominent role for complement protein C3 in mediating aged-related and region-specific changes in synaptic function and plasticity in the aging brain. Significance statement: The complement cascade, part of the innate immune response to remove pathogens, also plays a role in synaptic refinement during brain development by the removal of weak synapses. We investigated whether complement C3, a central component, affects synapse loss during aging. Wild-type (WT) and C3 knock-out (C3 KO) mice were examined at different ages. The mice were similar at 1 month of age. However, with aging, WT mice lost synapses in specific brain regions, especially in hippocampus, an area important for memory, whereas C3 KO mice were protected. Aged C3 KO mice also performed better on learning and memory tests than aged WT mice. Our results suggest that complement C3, or its downstream signaling, is detrimental to synapses during aging.

Keywords: CA3; aging; cognition; complement C3; innate immunity; synapse.


Figures

Figure 1.
Figure 1.
Age-dependent HC synapse loss in male C57BL/6J WT mice. a, Densitometric analysis reveals age-dependent decrease of SYP immunoreactivity in P30, 4-month-old, and 16-month-old WT mice. Scale bar, 100 μm. b, SYP density was lower at 4 months and 16 months of age relative to P30 (***p < 0.001, n = 12, one-way ANOVA). c, d, Western blotting of HC homogenates revealed age-dependent decreases of synaptic proteins (pre: SYN1, SYP; post: PSD95) in 16-month-old versus P30 WT mice (*p < 0.05, **p < 0.01, n = 6; one-way ANOVA). e, Representative confocal microscopy images display an age-dependent reduction in Vglut2 (green, presynaptic marker) and Homer1 (red, postsynaptic marker) IR in CA3 but not CA1 from P30 to 16 months of age. Scale bar, 15 μm. f, g, Quantification of synaptic puncta density revealed age-dependent decreases in Vglut2 and Homer1 IR and colocalization in CA3 but not CA1 (#p = 0.0523, ***p < 0.001, n = 6; 3 equidistant planes 200 μm apart per mouse; one-way ANOVA). h, LTP field recording of HC CA3–CA1 revealed a loss of synaptic plasticity from 4 to 12 months of age. Inset traces are typical fEPSPs recorded before (black) and after (red) high-frequency stimulation recorded in 4-month-old (left) and 12-month-old (right) mice. Horizontal bars: 10 ms; vertical bars: 0.5 mV. i, Statistical analysis of the mean value of the last 10 min of LTP recording confirmed an age-dependent reduction in synaptic potentiation from 4 months to 12 months of age (***p < 0.001, n = 14; unpaired Student's t test).
Figure 2.
Figure 2.
Complement C3 deficiency rescues age-dependent synapse loss in C57BL/6 WT mice. a, Western blotting of C3 in HC homogenates of WT mice at P2, P30, 4-month-old, and 16-month-old WT mice and P2 C3 KO mice. C3 protein levels in WT mice were high at P2, but dropped dramatically by P30. The C3 protein was absent in C3 KO mice. C3 protein levels were modestly but significantly elevated in P30 compared with 16 months of age. (*p < 0.05, **p < 0.01, ***p < 0.0001, one-way ANOVA; n = 3 mice per age). b, Confocal image of C3 (green) and Homer1 (red) synaptic puncta in CA3 of a 4-month-old WT mouse. Scale bar, 10 μm (i). b, The density of C3-tagged Homer1 puncta was significantly increased in CA3 (ii) but not CA1 (iii), of WT mice at 4 months of age compared with P30 and 16 months of age. (*p < 0.05, n = 4 or 5 mice per age; one-way ANOVA). c, High-resolution confocal microscopy of presynaptic (Vglut2, green) and postsynaptic (Homer1, red) IR puncta in CA3 of HC in WT and C3 KO mice at P30, 4 months, and 16 months of age. Scale bar, 5 μm. d, At P30, WT and C3 KO mice had similar synaptic puncta densities. e, f, At 4 months, Vglut2-synaptic density was higher in C3 KO versus WT mice, whereas at 16 months, Homer1, Vglut2, and colocalized puncta were significantly increased in C3 KO mice compared with WT mice (*p < 0.05, **p < 0.01, ***p < 0.001, n = 6 mice per age and genotype; 3 equidistant planes 200 μm apart per mouse; unpaired Student's t test). g, Golgi staining of dendritic spines in CA3 of WT and C3 KO mice at 16 months of age. Scale bar, 10 μm. h, Quantification of Golgi-labeled dendritic spines revealed a significant increase in spine density in C3 KO mice compared with WT at 16 months of age (**p < 0.01, n = 2 mice per genotype; unpaired Student's t test). i, j, Western blotting of HC homogenates revealed elevated SYP, PSD95, and SYN1 synaptic proteins in 16-month-old C3 KO mice compared with age-matched WT mice (*p < 0.05, **p < 0.01, n = 6 mice per age and genotype; unpaired Student's t test). N.S., Not significant.
Figure 3.
Figure 3.
C3 deficiency rescues neuron loss in the HC CA3 region in aged WT mice. a, c, NeuN-immunostained neurons in HC of WT (a), C3 KO (c) mice at P30, 4 months and 16 months of age (HC shown in top and CA3 in bottom) Scale bar, 50 μm. b, Unbiased stereological neuron counts revealed an age-dependent decrease in neurons in HC CA3 of WT mice (*p < 0.05, P30 vs 16 months; n = 5 mice per age and genotype; 3 equidistant planes 500 μm apart per mouse; unpaired Student's t test). d, Neuron numbers remained stable from P30 to 16 months of age in C3 KO mice, indicating the absence of age-dependent neuron loss (n = 4–7 mice per age and genotype; 3 equidistant planes 500 μm apart per mouse; unpaired Student's t test). eh, No significant differences were observed between genotypes in neuron number in HC CA1, DG, cortex V1, and CB of 16-month-old WT and C3 KO mice (n = 8 mice per age and genotype; 3 equidistant planes per mouse; unpaired Student's t test). N.S., Not significant.
Figure 4.
Figure 4.
C3 deficiency rescues age-dependent LTP attenuation in 12-month-old mice. a, The I/O curve revealed that the relationship between the range of stimulus intensities and the fEPSP rising slope was similar between 12-month-old WT and C3 KO mice. b, At 12 months of age, C3 KO mice had increased PPF compared with WT mice (*p < 0.05 at 40 ms intervals and #p = 0.0916 at 60 ms intervals; n = 8–10 per genotype; unpaired Student's t test). c, At 4 months, LTP induced by high-frequency stimulation (HFS, arrow) was similar between WT and C3 KO mice (n = 14 slices in total from 7–8 mice per genotype). d, At 12 months, HFS (arrow)-induced LTP was higher in C3 KO mice versus WT mice (*p < 0.05; n = 12 slices in total from 6 mice per genotype; unpaired Student's t test). e, Based on c and d, WT mice showed an age-dependent reduction in LTP that was rescued in C3 KO mice (**p < 0.01, 4-month-old WT vs 12-month-old WT; **p < 0.01, 12-month-old C3 KO vs 12-month-old WT; unpaired Student's t test). The bar graph represents the mean value of the last 10 min of LTP recording. fh, Western blotting of HC synaptosomes revealed increases in NMDAR GluN1, AMPAR GluR1 (g), and synaptic markers PSD95, SYN1, and SYP (h) in 12-month-old C3 KO versus WT mice (**p < 0.01, ***p < 0.001, n = 6 mice per genotype; unpaired Student's t test). g and h do not have the black line comparing the two bars that are present in all other bar graphs.
Figure 5.
Figure 5.
C3 deficiency improved spatial and contextual memory in the WTM and CFC tests at 16 months of age. a, In the WTM test, 16-month-old C3 KO and WT mice were similar in their ability to find the platform location during acquisition. However, the C3 KO mice learned and remembered the new location of the platform in the reversal test significantly sooner (day 2, day 3) than the WT mice (***p < 0.001 at reversal day 2, **p < 0.01 at reversal day 3, #p = 0.093 at reversal day 4, n = 12 male mice per genotype; unpaired Student's t test). b, c, In the CFC test, 16-month-old C3 KO mice demonstrated significantly increased freezing times compared with age-matched WT mice after both the first and second shocks during training on day 1 (b) and appeared to show better retention of the shock-paired context, as indicated by increased freezing times in the absence of a shock, during the conditioning test on day 2 (*p < 0.05, n = 14 male C3 KO mice, n = 12 male WT mice; unpaired Student's t test; c). d, e, C3 KO and WT mice displayed normal locomotor activity in the OF test (d), but C3 KO mice spent significantly more time in the center of the field than WT mice, suggesting an anxiolytic phenotype (*p < 0.05, n = 12 male WT mice, n = 10 male C3 KO mice; unpaired Student's t test; e). f, g, In the EPM, C3 KO mice made significantly more open arm entries (**p < 0.01; g), suggesting that they were less anxious than WT mice (n = 12 male mice per genotype; unpaired Student's t test). h, In the OH test, C3 KO mice showed significantly more contacts with the novel object than WT mice in the first minutes, supporting an anti-anxiety like phenotype and fewer contacts at 3 min, suggesting that these mice may have lost interest in the novel object (*p < 0.05, unpaired Student's t test).

References

    1. Adams MM, Shi L, Linville MC, Forbes ME, Long AB, Bennett C, Newton IG, Carter CS, Sonntag WE, Riddle DR, Brunso-Bechtold JK. Caloric restriction and age affect synaptic proteins in hippocampal CA3 and spatial learning ability. Exp Neurol. 2008;211:141–149. doi: 10.1016/j.expneurol.2008.01.016. - DOI - PMC - PubMed
    1. Adams MM, Donohue HS, Linville MC, Iversen EA, Newton IG, Brunso-Bechtold JK. Age-related synapse loss in hippocampal CA3 is not reversed by caloric restriction. Neuroscience. 2010;171:373–382. doi: 10.1016/j.neuroscience.2010.09.022. - DOI - PMC - PubMed
    1. Aroniadou-Anderjaska V, Pidoplichko VI, Figueiredo TH, Almeida-Suhett CP, Prager EM, Braga MF. Presynaptic facilitation of glutamate release in the basolateral amygdala: a mechanism for the anxiogenic and seizurogenic function of GluK1 receptors. Neuroscience. 2012;221:157–169. doi: 10.1016/j.neuroscience.2012.07.006. - DOI - PMC - PubMed
    1. Baskerville KA, Kent C, Nicolle MM, Gallagher M, McKinney M. Aging causes partial loss of basal forebrain but no loss of pontine reticular cholinergic neurons. Neuroreport. 2006;17:1819–1823. doi: 10.1097/WNR.0b013e32800fef5a. - DOI - PubMed
    1. Brunson KL, Eghbal-Ahmadi M, Bender R, Chen Y, Baram TZ. Long-term, progressive hippocampal cell loss and dysfunction induced by early-life administration of corticotropin-releasing hormone reproduce the effects of early-life stress. Proc Natl Acad Sci U S A. 2001;98:8856–8861. doi: 10.1073/pnas.151224898. - DOI - PMC - PubMed

Publication types

MeSH terms