. 2015 Dec;89(23):12047-57.
doi: 10.1128/JVI.01057-15. Epub 2015 Sep 23.

Infectious Bronchitis Coronavirus Inhibits STAT1 Signaling and Requires Accessory Proteins for Resistance to Type I Interferon Activity

Affiliations

Infectious Bronchitis Coronavirus Inhibits STAT1 Signaling and Requires Accessory Proteins for Resistance to Type I Interferon Activity

Joeri Kint et al. J Virol. 2015 Dec.

Abstract

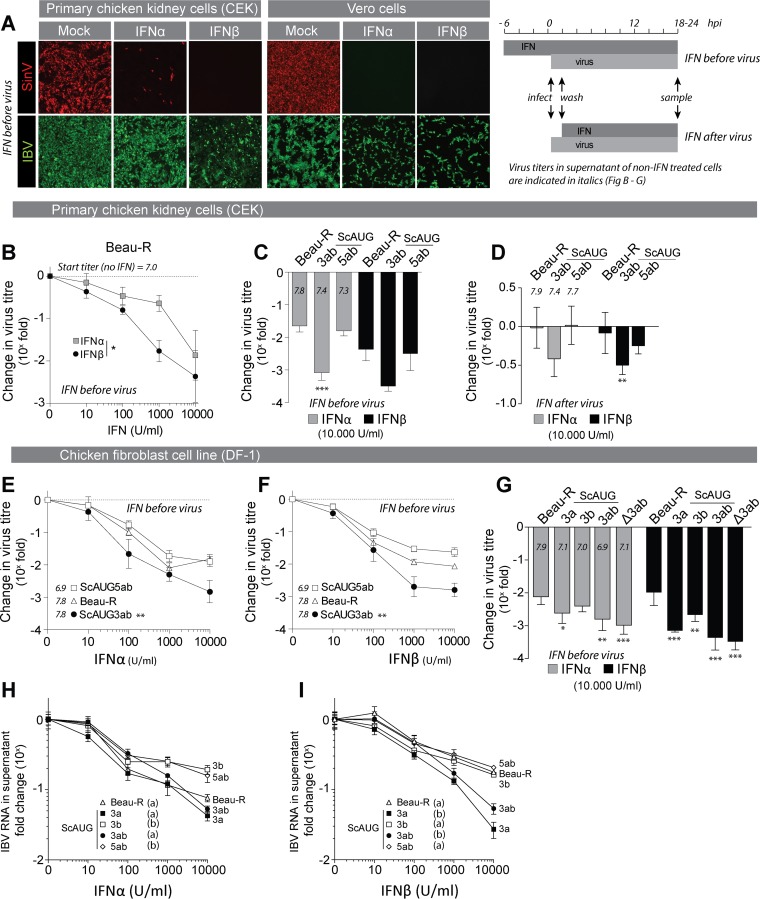
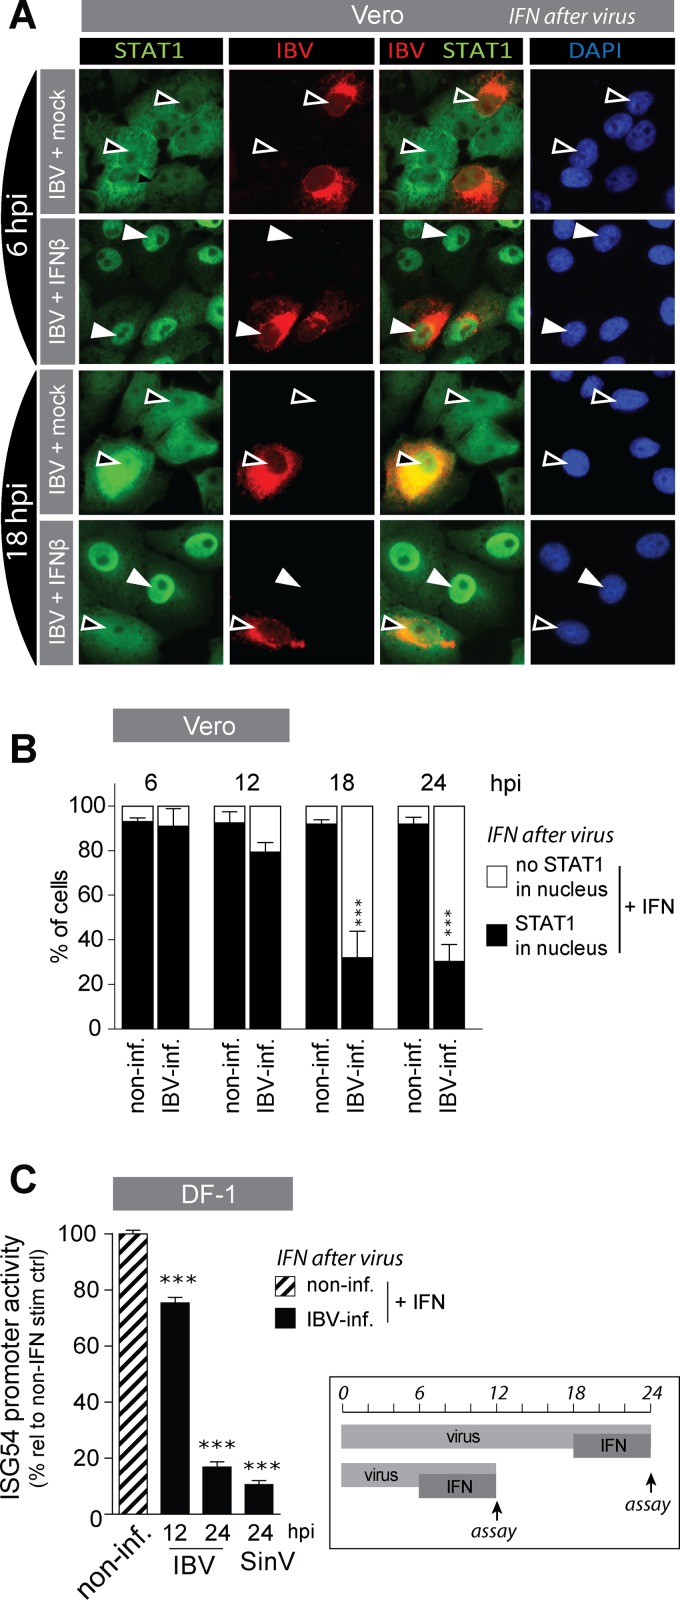
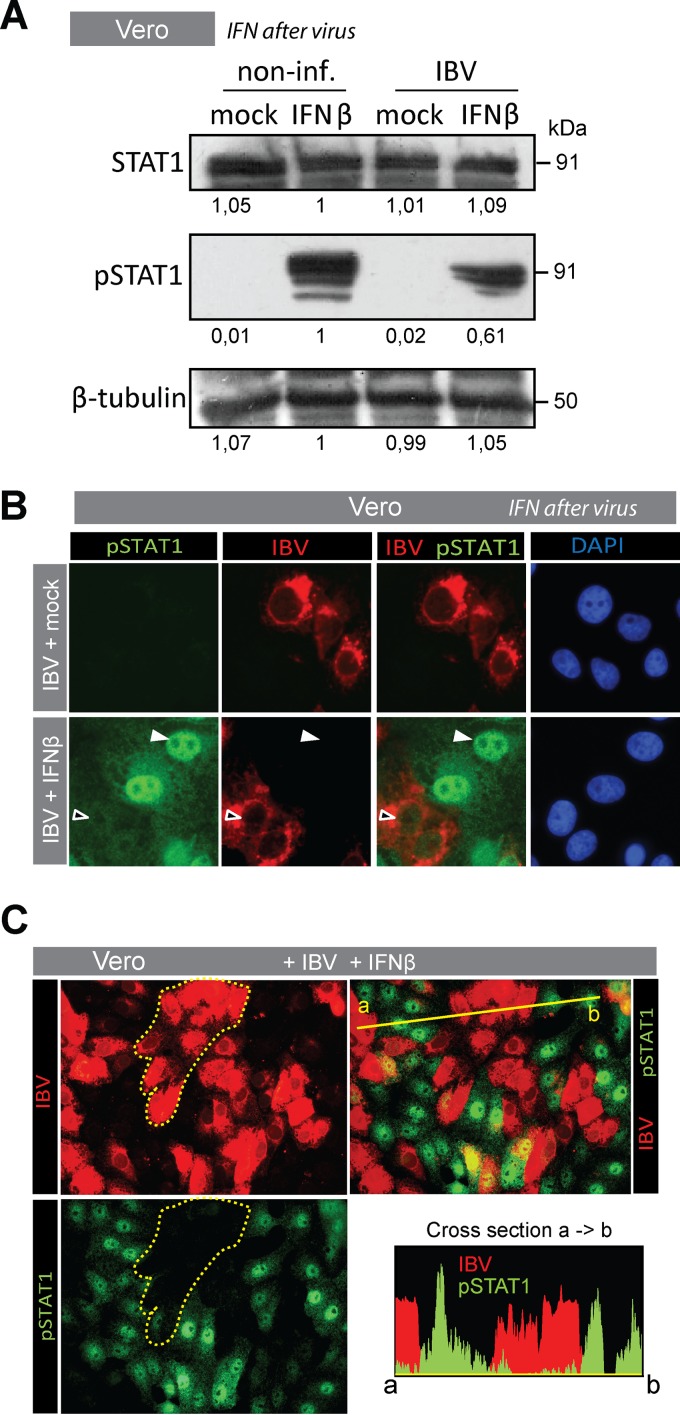
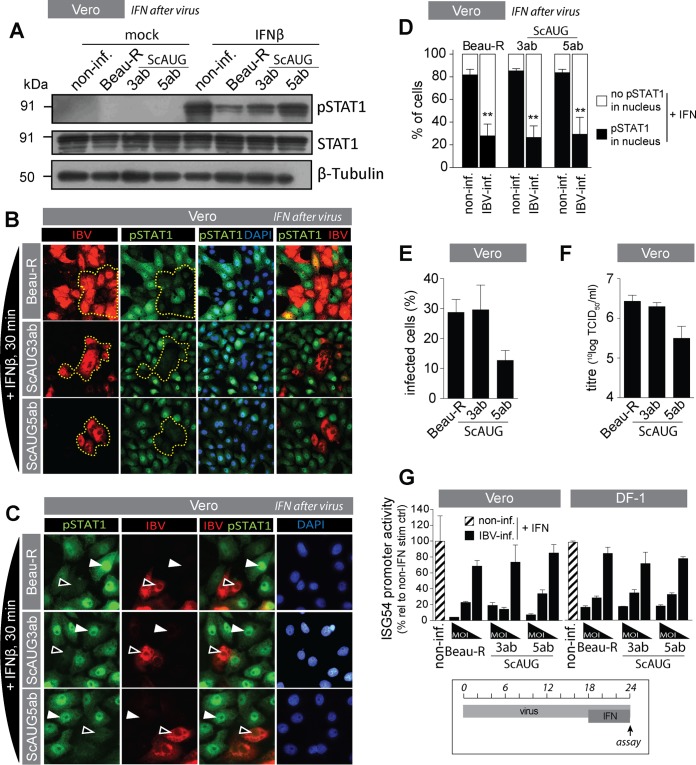
The innate immune response is the first line of defense against viruses, and type I interferon (IFN) is a critical component of this response. Similar to other viruses, the gammacoronavirus infectious bronchitis virus (IBV) has evolved under evolutionary pressure to evade and counteract the IFN response to enable its survival. Previously, we reported that IBV induces a delayed activation of the IFN response. In the present work, we describe the resistance of IBV to IFN and the potential role of accessory proteins herein. We show that IBV is fairly resistant to the antiviral state induced by IFN and identify that viral accessory protein 3a is involved in resistance to IFN, as its absence renders IBV less resistant to IFN treatment. In addition to this, we found that independently of its accessory proteins, IBV inhibits IFN-mediated phosphorylation and translocation of STAT1. In summary, we show that IBV uses multiple strategies to counteract the IFN response.

Importance: In the present study, we show that infectious bronchitis virus (IBV) is resistant to IFN treatment and identify a role for accessory protein 3a in the resistance against the type I IFN response. We also demonstrate that, in a time-dependent manner, IBV effectively interferes with IFN signaling and that its accessory proteins are dispensable for this activity. This study demonstrates that the gammacoronavirus IBV, similar to its mammalian counterparts, has evolved multiple strategies to efficiently counteract the IFN response of its avian host, and it identifies accessory protein 3a as multifaceted antagonist of the avian IFN system.


Figures

FIG 1
FIG 1
Accessory protein 3a confers resistance to treatment of IBV with type I IFN. (A) Primary chicken embryo kidney (CEK) cells and Vero cells were prestimulated with IFN (1,000 U/ml) for 6 h and subsequently infected with Sindbis virus (SinV) or IBV (Beau-R) at an MOI of 0.1. At 24 hpi, cells were fixed and stained for dsRNA (red) or IBV-N (green). (B) CEK cells were prestimulated with the indicated concentrations of IFN for 6 h and subsequently infected with Beau-R (MOI of 0.01). At 2 hpi, cells were washed to remove inoculum, and medium with IFN was added. At 18 hpi, supernatant was sampled and titrated (see panel A, graph at right, for sampling time line). Symbols represent the means of triplicate measurements (±SEM) of virus titers from two independent experiments. The asterisk indicates significant differences (P < 0.05) between IFN-α and IFN-β treatment as assessed by a two-way ANOVA. (C) CEK cells were treated with IFN, infected with virus, and sampled at 18 hpi as described for panel B using Beau-R and accessory protein-null viruses (MOI of 0.01). Titers were determined at 18 hpi and are expressed relative to titers of non-IFN-treated wells. The lower the value, the higher the reduction. Symbols indicate the means (±SEM) of triplicate measurements from two independent experiments. Triple asterisks indicate significant difference (P < 0.001) compared to Beau-R as assessed by one-way ANOVA followed by a Bonferroni post hoc test. Titers in non-IFN-treated wells are displayed for each virus. (D) CEK cells were infected with the indicated viruses (MOI of 10), and at 2 hpi, inoculum was removed and cells were incubated with IFN (10,000 U/ml). Virus titers in the supernatant were determined at 18 hpi and are expressed as fold change relative to non-IFN-treated wells infected with the same virus (see Fig. 1A, graph, for sampling time line). (E and F) DF-1 cells were treated with IFN and infected as described for panel B. Symbols indicate the mean relative titers at 24 hpi (±SEM) of triplicate wells from a representative experiment of two biological replicates. Double asterisks indicate significant differences (P < 0.01) between ScAUG3ab virus and the other viruses as assessed by a two-way ANOVA. (G) DF-1 cells were treated with IFN and infected as described for panel B. Bars represent the fold change in virus titer at 24 hpi (±SD) of triplicate wells from two biological replicates. Asterisks indicate significant differences (*, P < 0.05; **, P < 0.01; ***, P < 0.001) from Beau-R, as assessed by a one-way ANOVA followed by a Bonferroni post hoc test. (H and I) DF-1 cells were treated with IFN and infected as described for panel B. At 24 hpi, total RNA was extracted from the cell culture supernatant and virus RNA was quantified by RT-qPCR using primers against the N gene. Values are expressed as fold change relative to non-IFN-treated wells infected with the same virus. The lower the value, the higher the reduction of viral RNA. Symbols represent the means of quadruplicate wells (±SD) from one experiment. Letters indicate significant differences at the highest IFN concentration as assessed by a one-way ANOVA followed by a Tukey post hoc test.
FIG 2
FIG 2
IBV prevents translocation of STAT1 and IFN signaling at late stages of infection. (A) Vero cells were infected with IBV-Beau-R (MOI of 1 for 6 h and MOI of 0.1 for all other time points) and subsequently stimulated with 1,000 U/ml of IFN-β for 30 min before fixation and staining for IBV-N and STAT1. White arrowheads indicate nuclear accumulation of STAT1, and black arrowheads indicate absence of STAT1 accumulation in the nucleus. (B) Cells were treated as for panel A, and at the indicated time points after IBV infection, the percentage of nuclei showing translocation of STAT1 (black bars) or not (white bars) was determined in noninfected (non-inf.) and in IBV-infected (IBV-inf) cells within IFN-β-treated wells. Each bar indicates the mean percentage of nuclei showing translocation of STAT1 as determined in 50 to 400 cells from multiple images of a representative experiment of two biological replicates. Error bars indicate SD. (C) DF-1 cells were transfected with an ISG54-firefly luciferase construct and 24 h later infected with Beau-R or SinV (MOIs of 5 and 0.5, respectively); at 6 or 18 hpi, cells were stimulated with 1,000 U/ml of IFN-β for an additional 6 h. ISG54 promoter activity was calculated as percentage relative to non-IFN-β-treated wells. Shown is the ISG54 promoter activity in noninfected IFN-β-treated wells (striped bar) and in IBV-infected-IFN-β-treated wells at 12 and 24 hpi (black bars). Firefly luciferase values were normalized to Renilla luciferase to correct for differences in transfection efficiency and protein translation. Bars indicate the means (+SD) of triplicate wells from a representative experiment out of three biological replicates. Triple asterisks indicate significant differences (P < 0.001) with respect to noninfected cells, as assessed by one-way ANOVA followed by a Bonferroni post hoc test.
FIG 3
FIG 3
IBV prevents translocation and phosphorylation of STAT1 Vero cells were infected for 18 h with IBV Beau-R (MOI of 0.1) and subsequently stimulated with 1,000 U/ml of IFN-β for 30 min. (A) Western blot analysis of noninfected and IBV-infected monolayers that were either mock treated or treated with IFN-β. Staining was performed using antibodies against STAT1 and Tyr701-phosphorylated STAT1. Staining against β-tubulin was included as a loading control. Numbers below the blots indicate the intensities of the bands, expressed as fold ratio relative to the IFN-β-stimulated, noninfected sample. (B) Vero cells treated as described above were fixed and stained for IBV-N and pSTAT1. White arrowheads indicate translocation of pSTAT1, and black arrowheads indicate absence of pSTAT1 from the nucleus. (C) To verify the overall decrease of pSTAT1, an area containing IBV-infected cells within an IFN-β-stimulated monolayer is delineated by a dotted line in the top left image and is overlaid on the bottom left image to illustrate the absence of pSTAT1 in IBV-infected cells. Cross section: fluorescence intensity plot of pSTAT1 and IBV-N along the yellow line indicated in the top right image.
FIG 4
FIG 4
IBV accessory proteins are not required for inhibition of STAT1 translocation and ISG promoter activation. (A) Western blot analysis of IBV-infected (MOI of 1; 18 hpi) and noninfected Vero cells that were either mock treated or treated with IFN-β for 30 min. Staining was performed using an antibody against Tyr701-phosphorylated STAT1, and an antibody against β-tubulin was used as a loading control. (B) Vero cells were infected with the indicated viruses (MOI of 0.1) and, at 18 hpi, stimulated with 1,000 U/ml of IFN-β for 30 min and then stained for IBV-N and pSTAT1. The area delineated by the yellow dotted line indicates the overall decrease in pSTAT1 staining in IBV-infected cells. (C) Vero cells were infected with Beau-R, ScAUG3ab, or ScAUG5ab virus (MOI of 0.1) and, at 18 hpi, stimulated with 1,000 U/ml of IFN-β for 30 min and then stained for IBV-N and pSTAT1. White arrowheads indicate translocation of pSTAT1, and black arrowheads indicate absence of accumulation of pSTAT1 in the nucleus. (D) In parallel, the percentage of nuclei showing translocation of STAT1 (black bars) or not (white bars) was determined in noninfected and in IBV-infected cells within IFN-β-treated wells. Each bar indicates the mean (+SD) percentage of nuclei showing translocation based on 100 to 300 cells from multiple images of a representative experiment from two biological replicates. Double asterisks indicate significant differences (P < 0.01) with respect to noninfected cells, as assessed by one-way ANOVA followed by a Bonferroni post hoc test. (E) Quantification of the percentage of IBV-infected cells in microscopic images of cells infected with the indicated viruses at an MOI of 0.1 and stained using IBV-N-specific antibody at 18 hpi. For each virus, at least 500 cells divided over 10 microscopic fields were analyzed. (F) Virus titers in supernatants from Vero cells infected for 18 h with the indicated viruses at an MOI of 0.01. (G) Vero and DF-1 cells were transfected with an ISG54-firefly luciferase construct and 24 h later infected with Beau-R, ScAUG3ab, or ScAUG5ab at MOIs 5, 0.5, and 0.05. At 18 hpi, cells were stimulated with 1,000 U/ml of IFN-β for an additional 6 h. After a total of 24 h, firefly and Renilla luciferase activities were quantified. ISG54 promoter activity was calculated as a percentage relative to non-IFN-β-treated wells. Shown is the ISG54 promoter activity in noninfected, IFN-β-treated wells (striped bar) and in IBV-infected, IFN-β-treated wells (black bars). Firefly luciferase values were normalized to Renilla luciferase to correct for differences in transfection efficiency and protein translation. Bars indicate the means (+SD) of triplicate wells of a representative example of 3 biological replicates.

References

    1. Gorbalenya AE, Enjuanes L, Ziebuhr J, Snijder EJ. 2006. Nidovirales: evolving the largest RNA virus genome. Virus Res 117:17–37. doi:10.1016/j.virusres.2006.01.017. - DOI - PMC - PubMed
    1. Cavanagh D. 2007. Coronavirus avian infectious bronchitis virus. Vet Res 38:281–297. doi:10.1051/vetres:2006055. - DOI - PubMed
    1. Britton P, Cavanagh D. 2007. Avian coronavirus diseases and infectious bronchitis vaccine development, p 161–181. In Thiel V. (ed), Coronaviruses: molecular and cellular biology. Caister Academic Press, Norfolk, United Kingdom.
    1. Kint J, Fernandez-Gutierrez M, Maier HJ, Britton P, Langereis MA, Koumans J, Wiegertjes GF, Forlenza M. 2015. Activation of the chicken type I interferon response by infectious bronchitis coronavirus. J Virol 89:1156–1167. doi:10.1128/JVI.02671-14. - DOI - PMC - PubMed
    1. Rose KM, Elliott R, Martinez-Sobrido L, Garcia-Sastre A, Weiss SR. 2010. Murine coronavirus delays expression of a subset of interferon-stimulated genes. J Virol 84:5656–5669. doi:10.1128/JVI.00211-10. - DOI - PMC - PubMed

Publication types

MeSH terms