. 2015 Dec;89(23):12035-46.
doi: 10.1128/JVI.03664-14. Epub 2015 Sep 23.

Antiviral RNA Interference against Orsay Virus Is neither Systemic nor Transgenerational in Caenorhabditis elegans

Affiliations

Antiviral RNA Interference against Orsay Virus Is neither Systemic nor Transgenerational in Caenorhabditis elegans

Alyson Ashe et al. J Virol. 2015 Dec.

Abstract

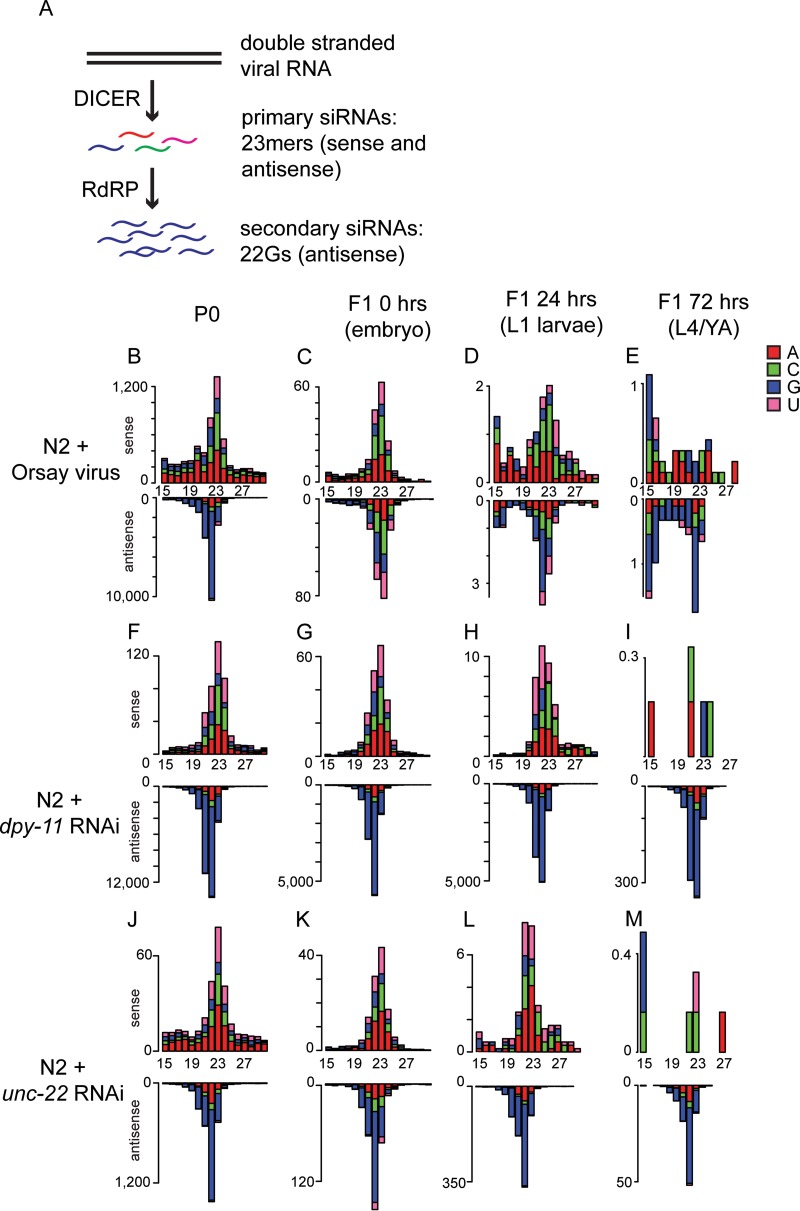
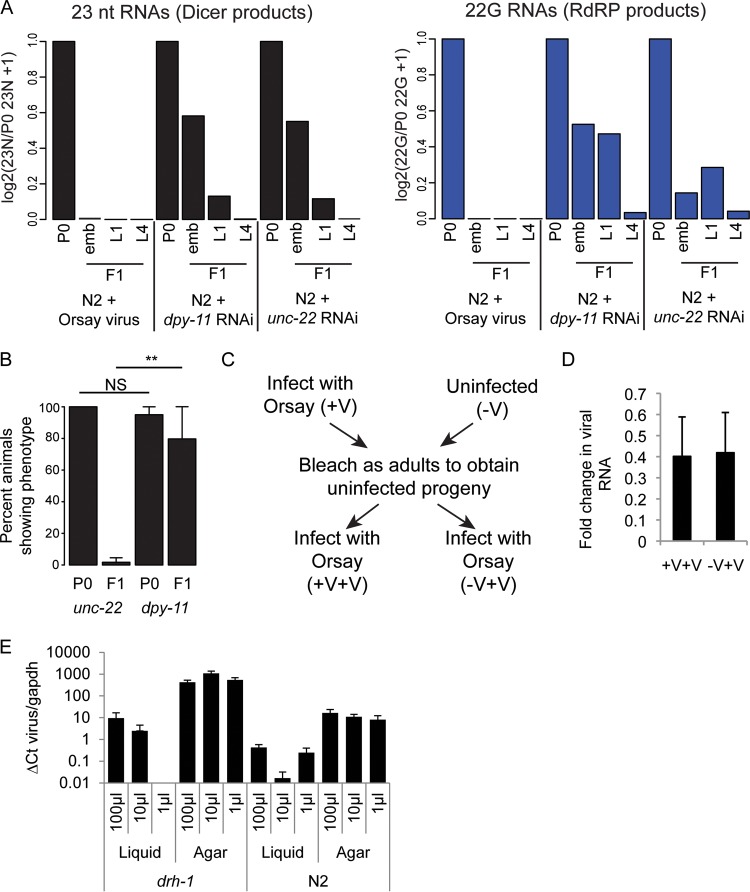
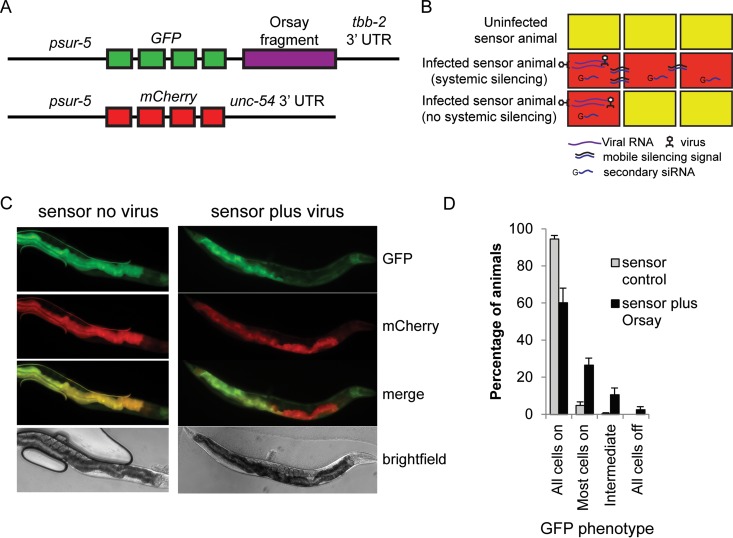
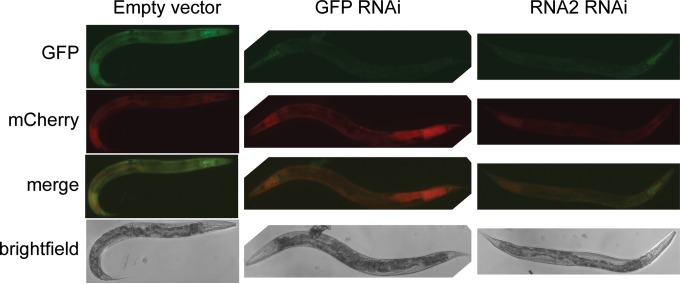
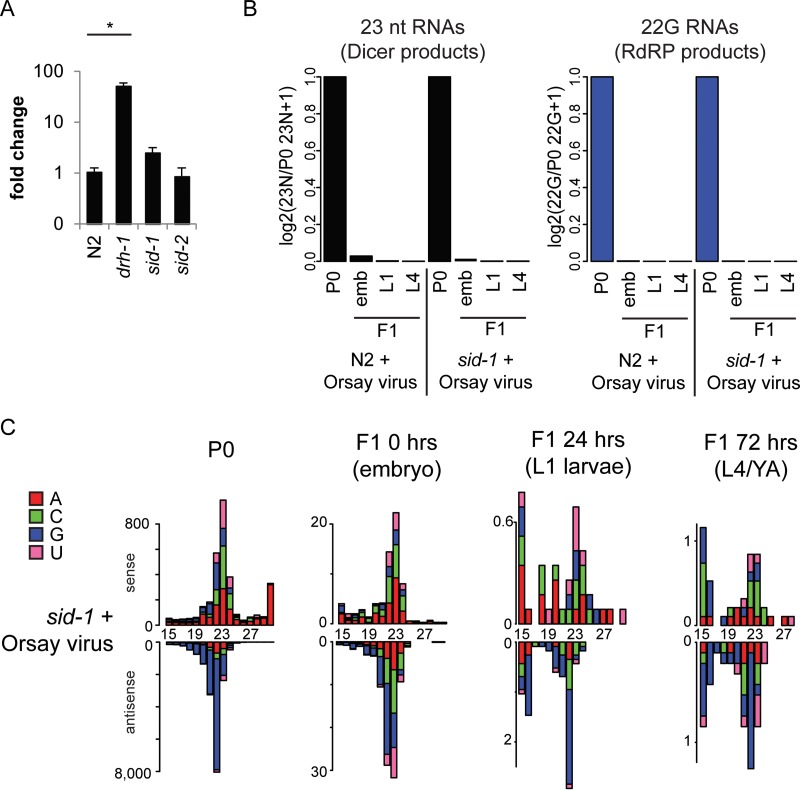
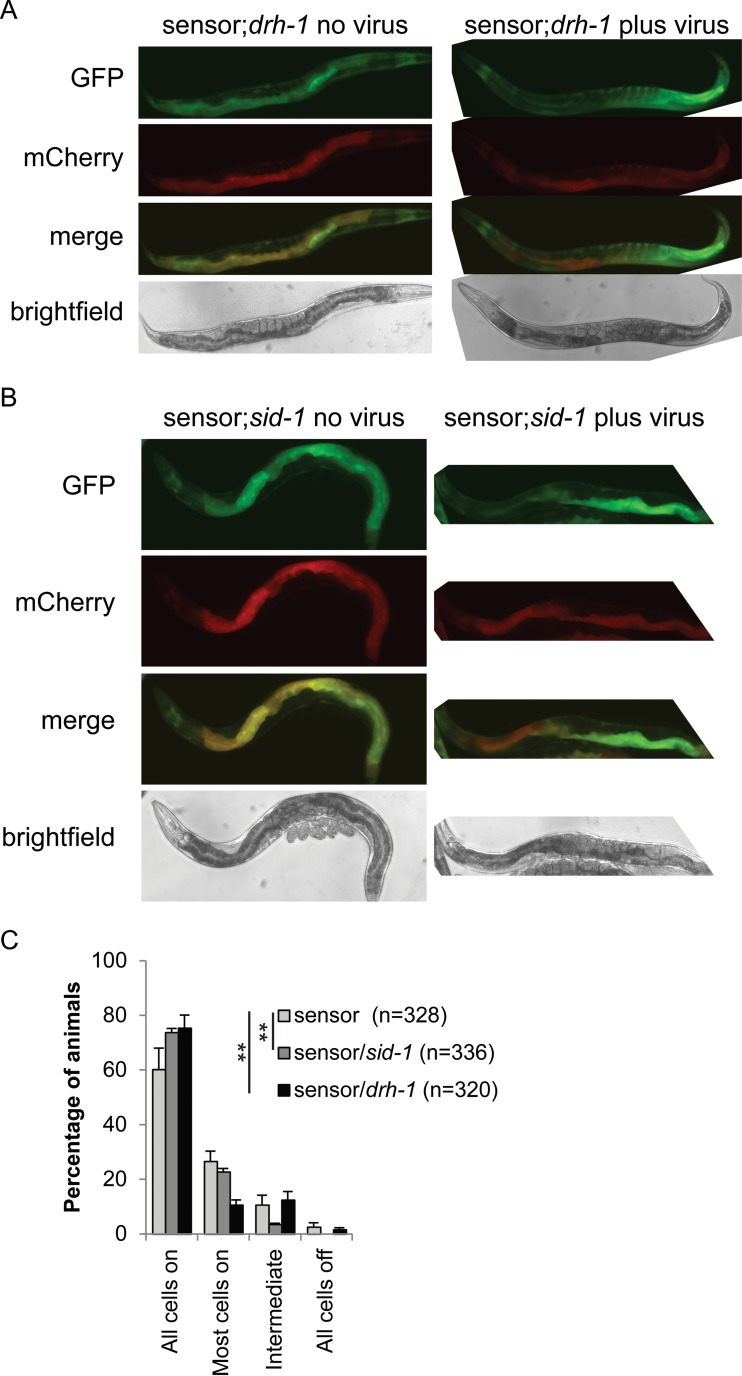
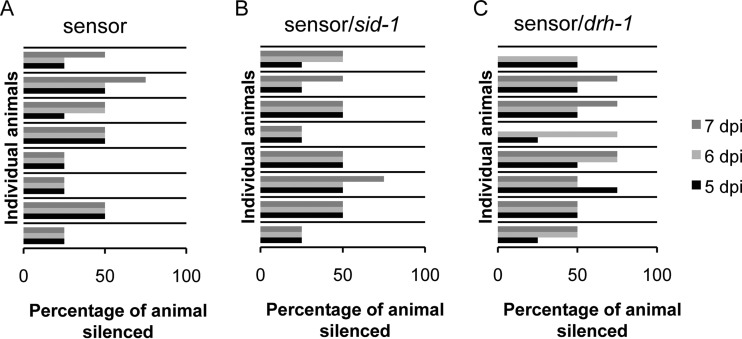
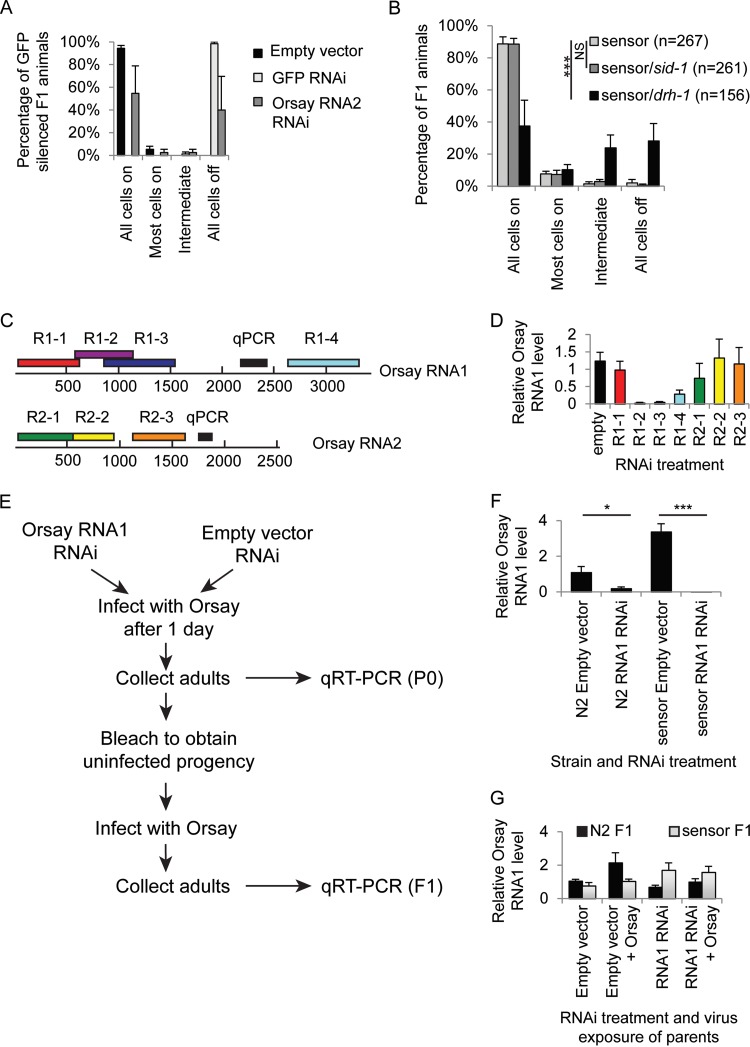
Antiviral RNA-mediated silencing (RNA interference [RNAi]) acts as a powerful innate immunity defense in plants, invertebrates, and mammals. In Caenorhabditis elegans, RNAi is systemic; i.e., RNAi silencing signals can move between cells and tissues. Furthermore, RNAi effects can be inherited transgenerationally and may last for many generations. Neither the biological relevance of systemic RNAi nor transgenerational RNAi is currently understood. Here we examined the role of both pathways in the protection of C. elegans from viral infection. We studied the Orsay virus, a positive-strand RNA virus related to Nodaviridae and the first and only virus known to infect C. elegans. Immunity to Orsay virus infection requires the RNAi pathway. Surprisingly, we found that genes required for systemic or transgenerational RNAi did not have a role in antiviral defense. Furthermore, we found that Orsay virus infection did not elicit a systemic RNAi response even when a target for RNAi was provided by using transgenes. Finally, we show that viral siRNAs, the effectors of RNAi, are not inherited to a level that provides any significant resistance to viral infection in the next generation. We conclude that systemic or transgenerational RNAi does not play a role in the defense against natural Orsay virus infection. Furthermore, our data suggest that there is a qualitative difference between experimental RNAi and antiviral RNAi. Our data are consistent with a model of systemic and transgenerational RNAi that requires a nuclear or germ line component that is lacking in almost all RNA virus infections.

Importance: Since its discovery in Caenorhabditis elegans, RNAi has proven a valuable scientific tool in many organisms. In C. elegans, exogenous RNAi spreads throughout the organism and can be passed between generations; however, there has been controversy as to the endogenous role(s) that the RNAi pathway plays. One endogenous role for which spreading both within the infected organism and between generations would be advantageous is a role in viral defense. In plants, antiviral RNAi is systemic and the spread of RNAi between cells provides protection against subsequent viral infection. Here we investigated this by using the only naturally occurring virus known to infect C. elegans, Orsay virus, and surprisingly found that, in contrast to the exogenous RNAi pathway, the antiviral RNAi response targeted against this virus does not spread systemically throughout the organism and cannot be passed between generations. These results suggest that there are differences between the two pathways that remain to be discovered.


Figures

FIG 1
FIG 1
Deep sequencing of viRNAs after Orsay virus infection and RNAi. (A) Cartoon showing the pathway of the 23-nt Dicer product and 22G RNA production in C. elegans. (B to M) 5′ independent small RNA sequencing of P0 and F1 animals after either Orsay virus exposure (B to E) or the RNAi treatment indicated (F to M). P0 animals were assayed as a mixed-stage population of predominantly adults, and F1 animals were synchronized and assayed at three different ages as indicated. Data are shown as sense or antisense and ordered according to the size of the RNA molecule. The values on the y axis are reads per million.
FIG 2
FIG 2
No evidence of inheritance of viRNAs after Orsay virus infection. (A) The 23-nt sense (left) Dicer products and 22G antisense (right) secondary RNAs from Fig. 1 normalized to library size and the level in the P0 generation. (B) Percentages of P0 and F1 animals displaying the dpy- or unc-encoded phenotype following exposure to RNAi. Error bars show the standard deviation of three (P0) or four (F1) biological replicates. **, P < 0.005; NS, not significant (t test). (C) The experimental design for the data shown in panel D. (D) qRT-PCR data for the relative levels of Orsay virus 4 days after exposure in animals whose parents were either infected with Orsay virus (+V+V) or uninfected (−V+V) (Orsay virus infection of parents was confirmed by qRT-PCR). Data are normalized to gapdh levels and the level of infection of the +V parents. Error bars show the standard error of the mean. (E) Graph showing a comparison of Orsay virus infection levels between liquid- and agar-based infection protocols in both the drh-1 mutant and N2 strains with three different concentrations of virus. Each condition was performed with five biological replicates, and error bars represent the standard error of the mean.
FIG 3
FIG 3
Development of a viRNA sensor. (A) Schematic of viRNA sensor. (B) Cartoon showing the expected phenotype of sensor animals in the absence of Orsay virus (top) and in the presence of Orsay virus with (middle) or without (bottom) systemic silencing. Yellow indicates both GFP and mCherry expression. Red indicates only mCherry expression. (C) Orsay virus sensor showing representative uninfected (left) and infected (right) animals. Infected- and uninfected-animal images were taken at the same intensity. (D) Percentages of sensor animals showing the amounts of silenced cells indicated in the absence (gray) or presence (black) of Orsay virus. Error bars indicate the standard error of the mean of six biological replicates.
FIG 4
FIG 4
Orsay virus sensor with RNAi. The Orsay virus sensor shows representative animals treated with the RNAi clones indicated. All images were taken at the same intensity.
FIG 5
FIG 5
sid-1 and sid-2 are not required for viral resistance. (A) qRT-PCR showing the relative levels of Orsay virus 4 days after infection in N2 and in drh-1, sid-1, and sid-2 mutants. drh-1 mutant animals show significantly higher levels of Orsay virus RNA than N2 animals do (P < 0.05, t test), but there is no significant difference between either sid-1 or sid-2 mutant and N2 animals. Data were normalized to gapdh and then N2. (B) Shown are the 23-nt sense (left) Dicer products and 22G antisense (right) secondary RNAs from panel C (sid-1) and Fig. 1 (N2) normalized to library size and the level in the P0 generation. emb, embryo. (C) 5′ independent small RNA sequencing of P0 and F1 sid-1 mutant animals after Orsay virus exposure. P0 animals were assayed as a mixed-stage population of predominantly adults, and F1 animals were synchronized and assayed at three different ages as indicated. Data are shown as sense or antisense and ordered according to the size of the RNA molecule. The values on the y axis are reads per million. The 5′ nucleotide is indicated by color as follows: red, A; green, C; blue, G; pink, U.
FIG 6
FIG 6
Orsay virus sensor in the sid-1 and drh-1 mutant backgrounds. (A, B) Orsay virus sensor showing representative uninfected (left) and infected (right) animals. Infected- and uninfected-animal images were taken at the same intensity. (C) Percentages of sensor N2 (light gray), sid-1 mutant (gray), and drh-1 mutant (black) animals showing the amounts of silenced intestinal cells indicated in the presence of Orsay virus. The amount of intestinal cell silencing differs significantly between both the sid-1 and drh-1 mutant backgrounds and the wild-type background (P < 0.001 [Fisher's exact test] in both cases). Error bars represent the standard error of the mean of six biological replicates.
FIG 7
FIG 7
No systemic sensor silencing following Orsay virus infection. Horizontal blocks indicate individual infected animals monitored for 3 days at 5 (black), 6 (light gray), and 7 (dark gray) days postinfection. The values on the x axis are the percentages of the animal silenced. Eight N2 (A), sid-1 mutant (B), and drh-1 mutant (C) animals each were monitored.
FIG 8
FIG 8
RNAi-induced Orsay virus silencing. (A) Graph showing the percentages of F1 animals with inherited sensor silencing after parental exposure by feeding to RNAi against either the empty vector (black), GFP (light gray), or OrsayRNA2 (dark gray). Error bars represent the standard error of the mean of two biological replicates. (B) Sensor silencing in the F1 offspring of infected animals (as judged by sensor silencing). The values on the x axis are the percentages of N2 (light gray), sid-1 mutant (dark gray), and drh-1 mutant (black) animals with the indicated amounts of sensor silencing in the intestine. ***, P < 0.0005 (Fisher's exact test). (C) Cartoon showing the position on the Orsay virus genome of the RNAi clones used in panel D and the positions of the quantitative PCR (qPCR) amplicons. (D) Graph showing the relative levels of Orsay virus (4 days postinfection) measured by qRT-PCR in N2 animals fed the RNAi clones indicated. Error bars represent the standard error of the mean of 3 (R1-1, R1-2, R2-1), 6 (R1-3, R1-4, R2-2, R2-3), or 12 (empty) biological replicates. (E) Schematic illustrating the experimental design used to test for the presence or absence of viral resistance in the F1 generation caused by previous viral exposure, viral RNAi, or both. (F) Graph showing the relative Orsay virus levels measured by qRT-PCR in P0 animals 4 days after Orsay virus exposure. Animals were wild type or carried an OrsayRNA1 sensor transgene and were exposed to either the empty vector or OrsayRNA1 RNAi. Exposure to Orsay virus RNAi in the P0 generation causes resistance to Orsay viral infection in both genetic backgrounds, although the effect is more significant in the sensor background. Data were normalized to gapdh and then the N2 empty vector. *, P < 0.05; ***, P < 0.0005 (t test). Error bars represent the standard error of the mean of three biological replicates. (G) Relative OrsayRNA1 levels in F1 animals. The x axis shows the RNAi treatment and/or Orsay exposure of their parents. N2 animal are shown in black, and RNA1 sensor animals are in light gray. There is no significant difference in any treatment or strain. Data were normalized to gapdh and then the N2 F1 empty vector. Error bars represent the standard error of the mean of three biological replicates.

References

    1. Tijsterman M, Plasterk RHA. 2004. Dicers at RISC: the mechanism of RNAi. Cell 117:1–3. doi:10.1016/S0092-8674(04)00293-4. - DOI - PubMed
    1. Wilson RC, Doudna JA. 2013. Molecular mechanisms of RNA interference. Annu Rev Biophys 42:217–239. doi:10.1146/annurev-biophys-083012-130404. - DOI - PMC - PubMed
    1. Pak J, Fire A. 2007. Distinct populations of primary and secondary effectors during RNAi in C. elegans. Science 315:241–244. doi:10.1126/science.1132839. - DOI - PubMed
    1. Sijen T, Steiner FA, Thijssen KL, Plasterk RHA. 2007. Secondary siRNAs result from unprimed RNA synthesis and form a distinct class. Science 315:244–247. doi:10.1126/science.1136699. - DOI - PubMed
    1. Pak J, Maniar JM, Mello CC, Fire A. 2012. Protection from feed-forward amplification in an amplified RNAi mechanism. Cell 151:885–899. doi:10.1016/j.cell.2012.10.022. - DOI - PMC - PubMed

Publication types