. 2014 Dec 1:3:292.
doi: 10.12688/f1000research.5775.2. eCollection 2014.

Countries' Biomedical Publications and Attraction Scores. A PubMed-based assessment

Affiliations

Countries' Biomedical Publications and Attraction Scores. A PubMed-based assessment

Qinyi Xu et al. F1000Res. .

Abstract

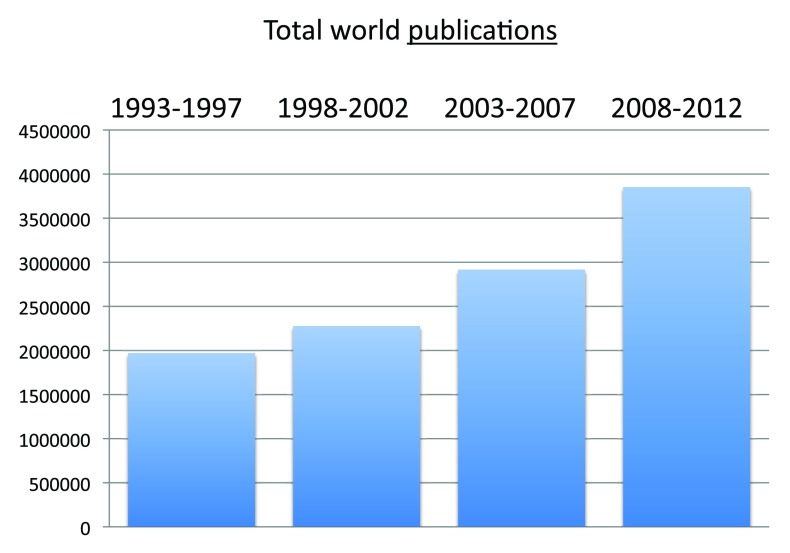
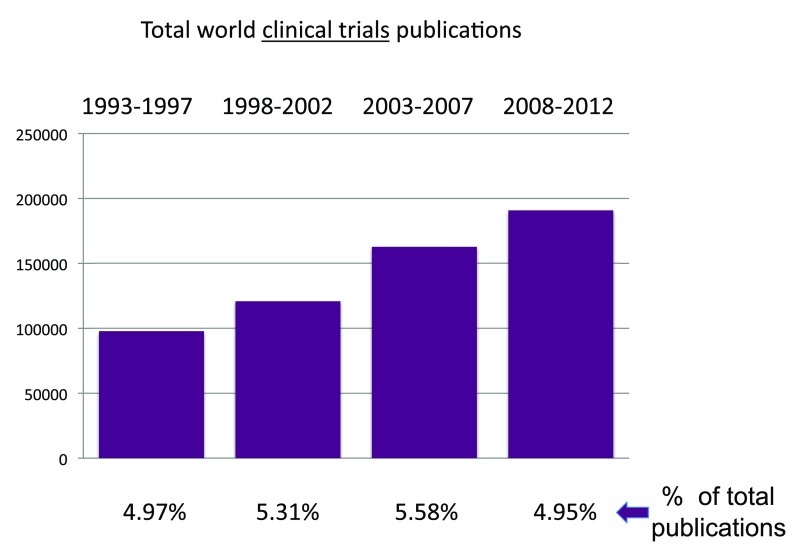
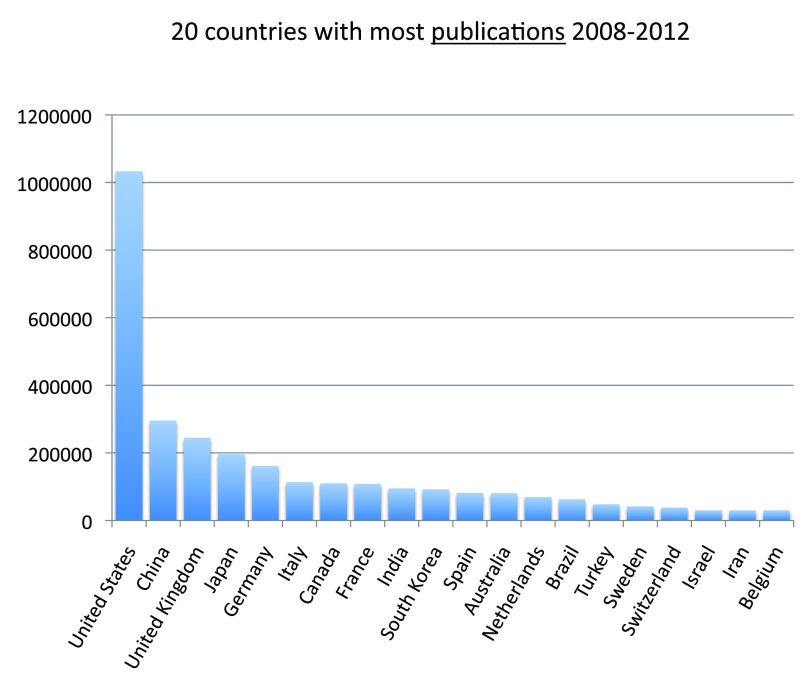
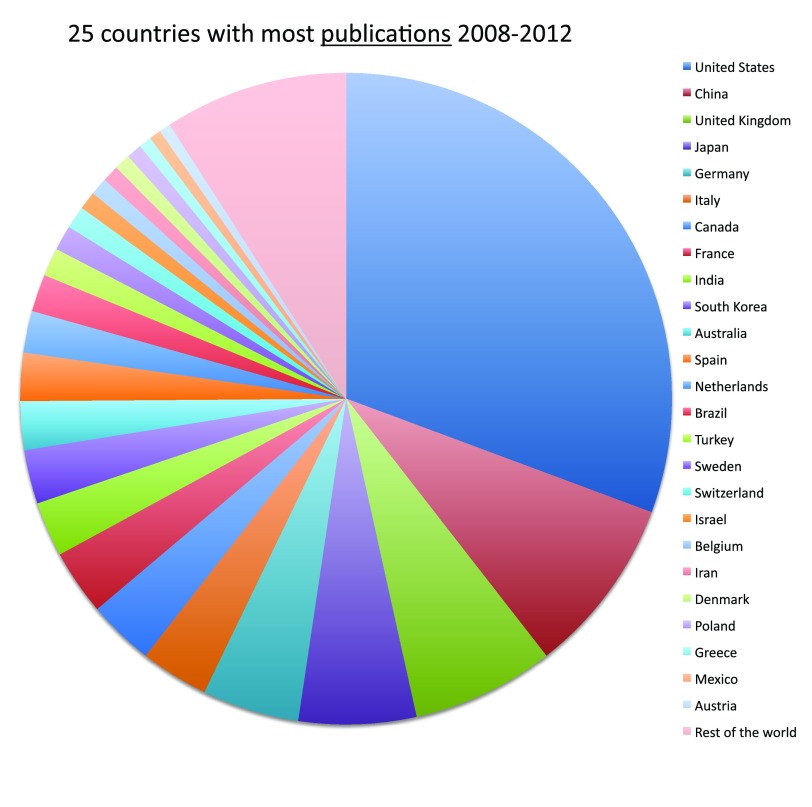
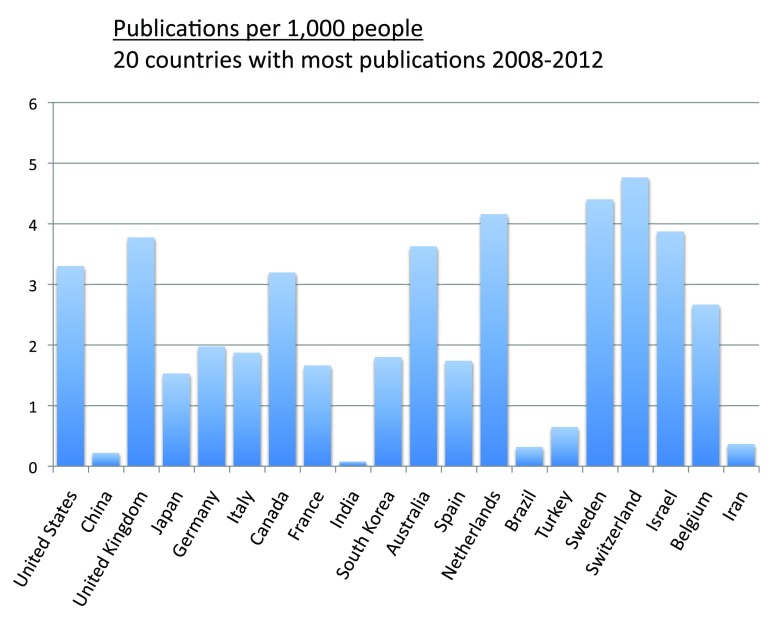
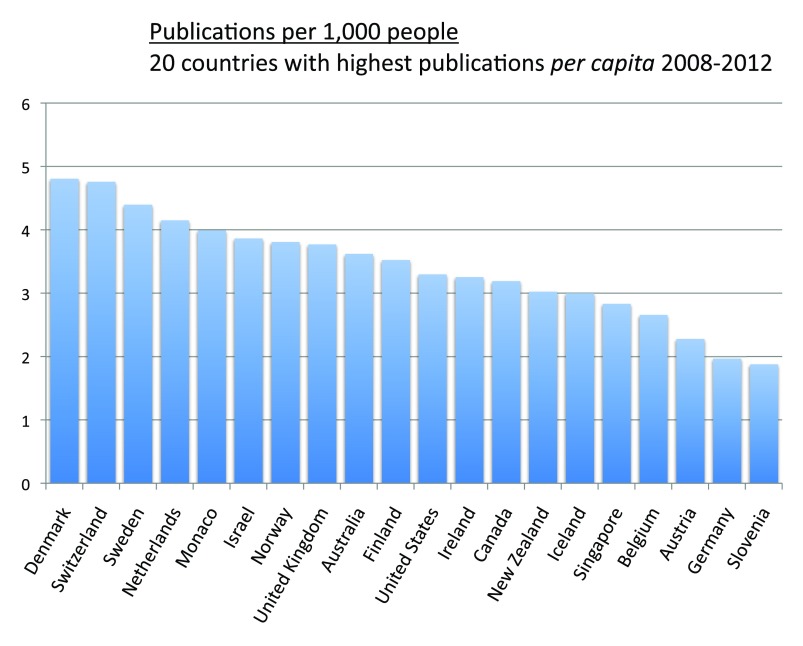
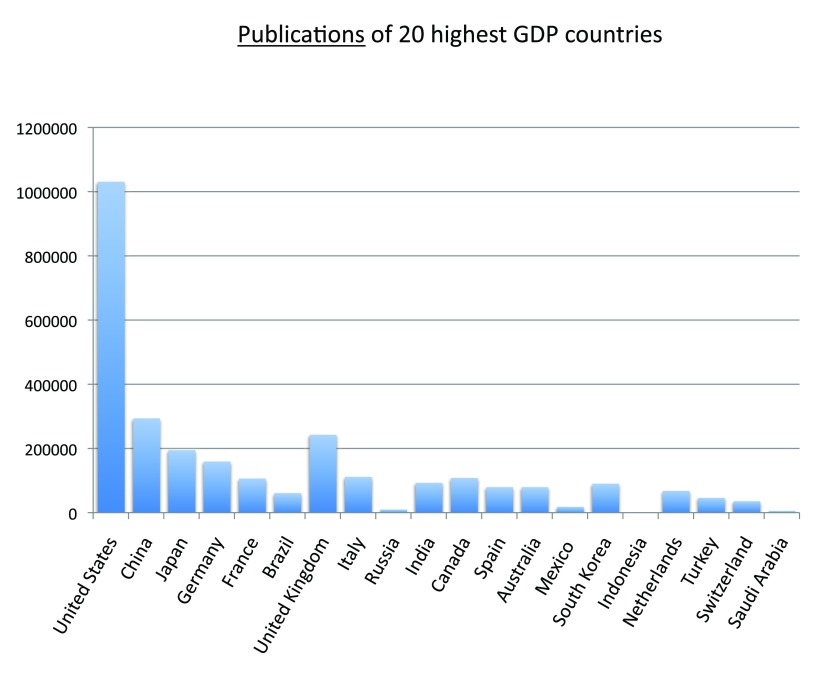
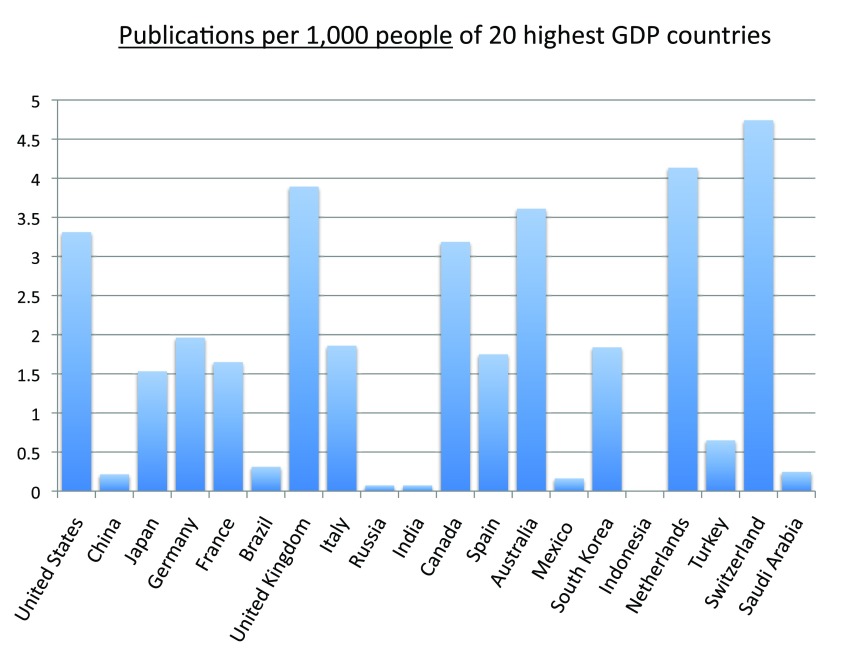
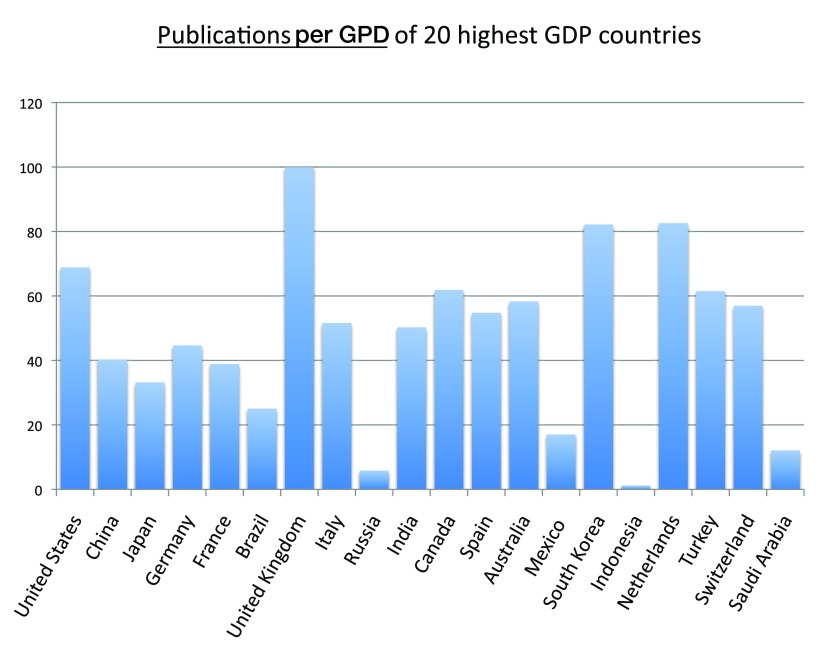
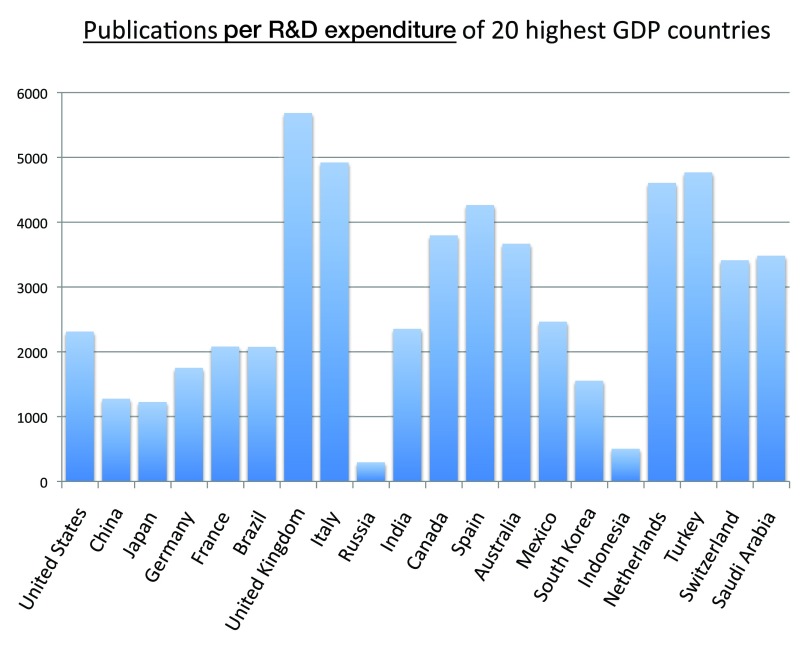
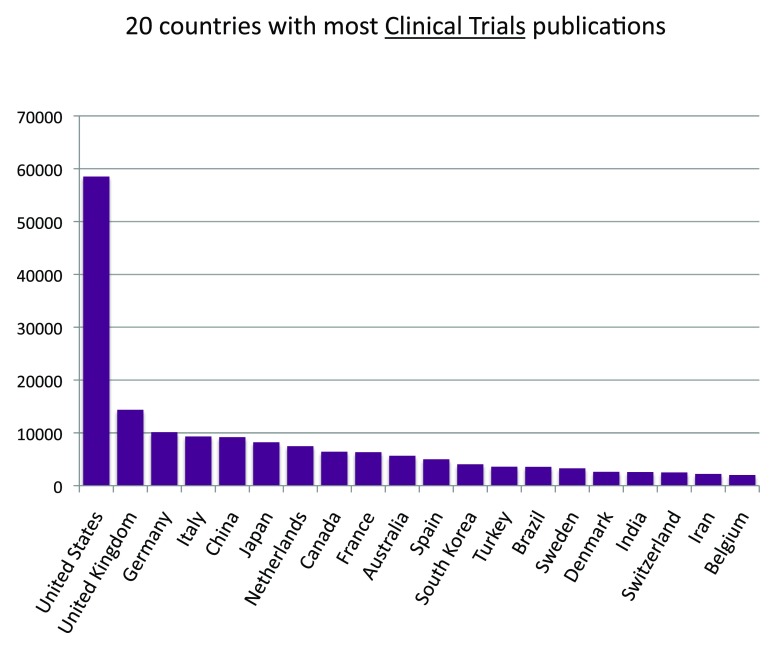
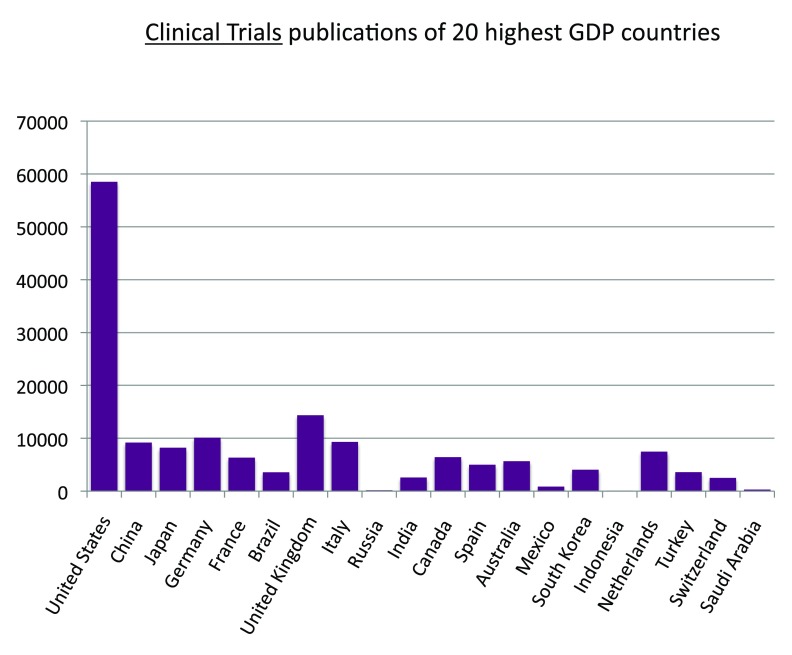
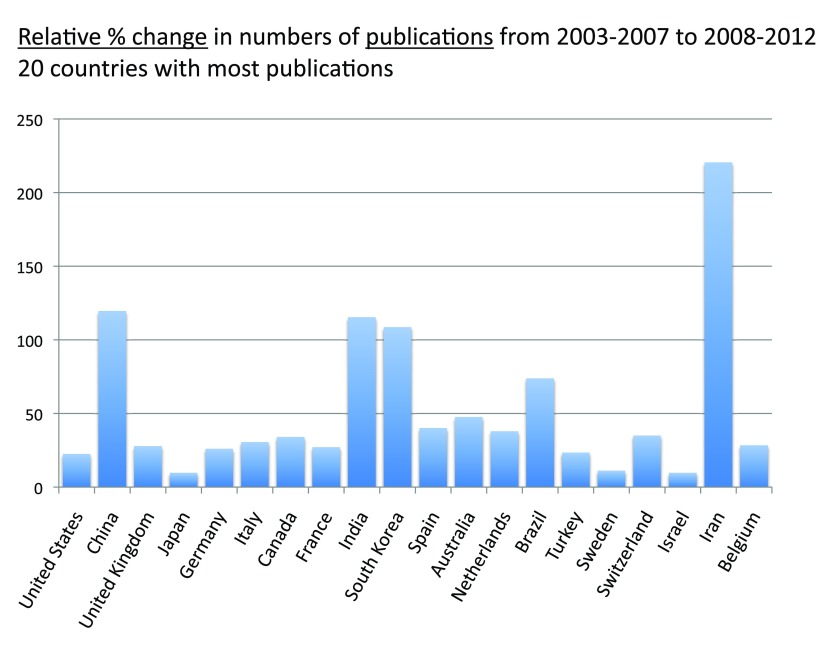
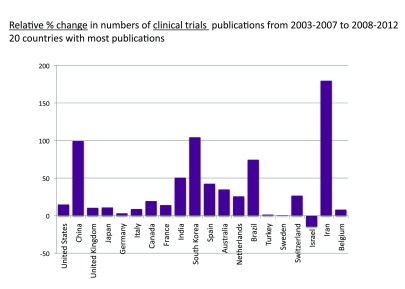
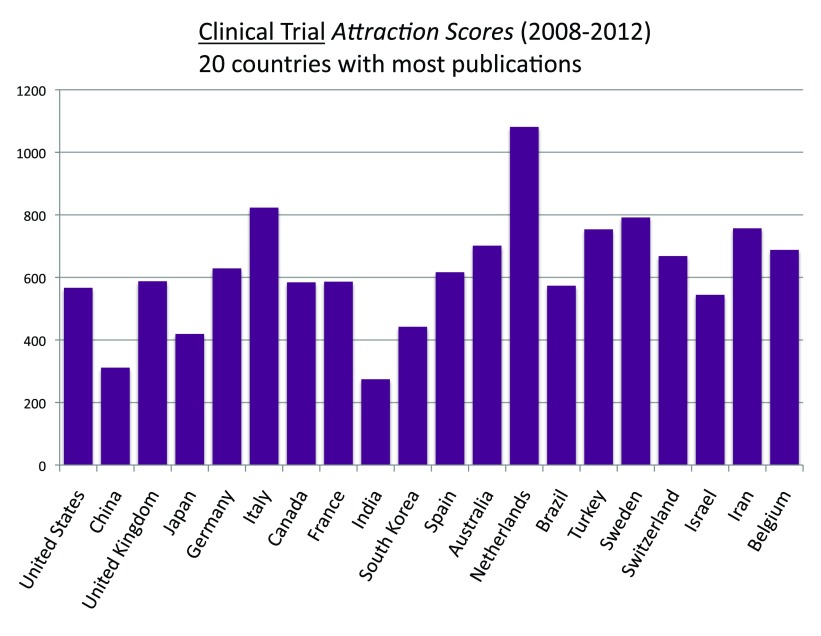
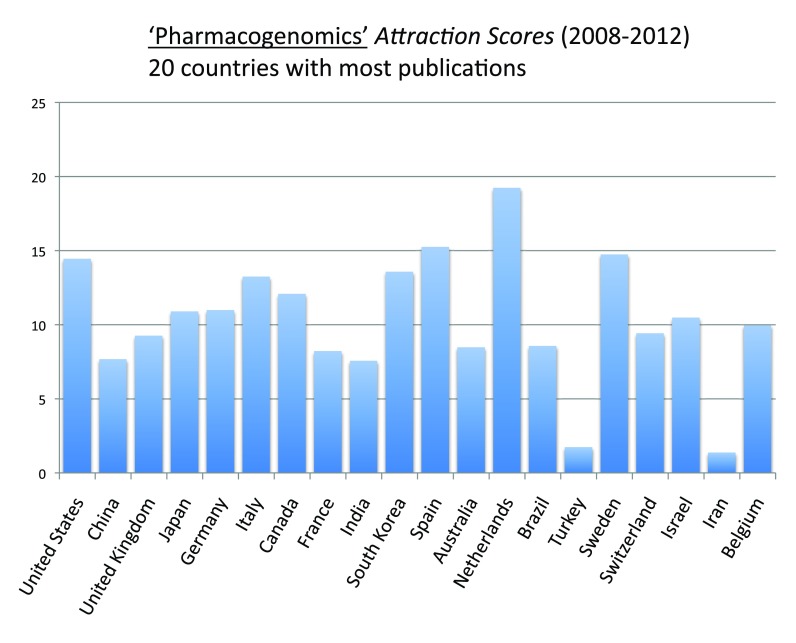
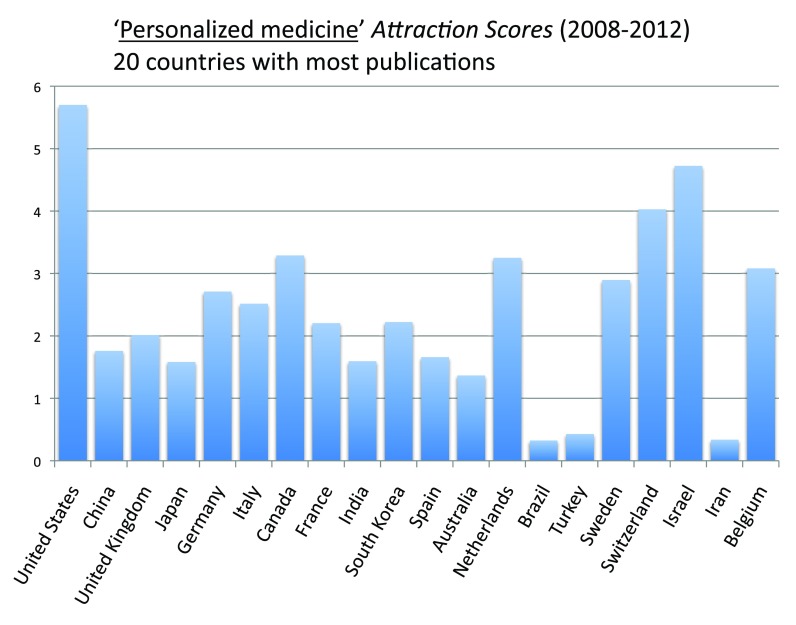
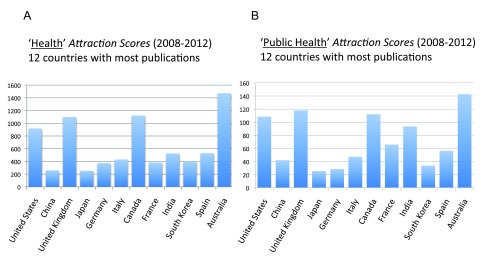
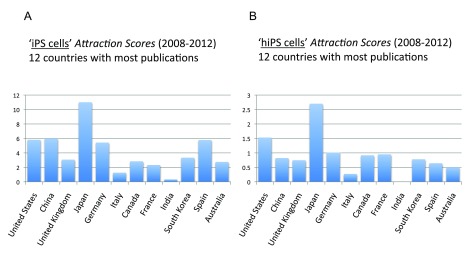
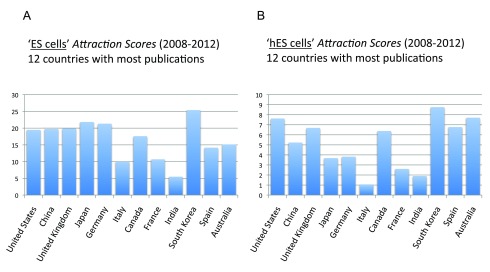
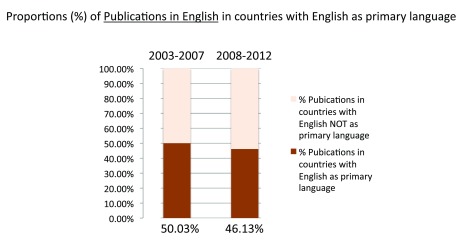
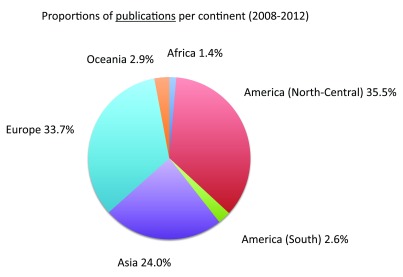
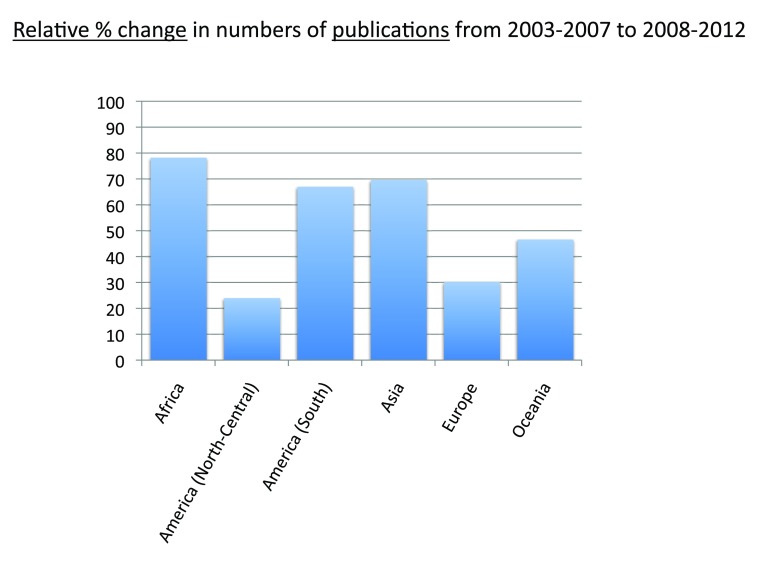
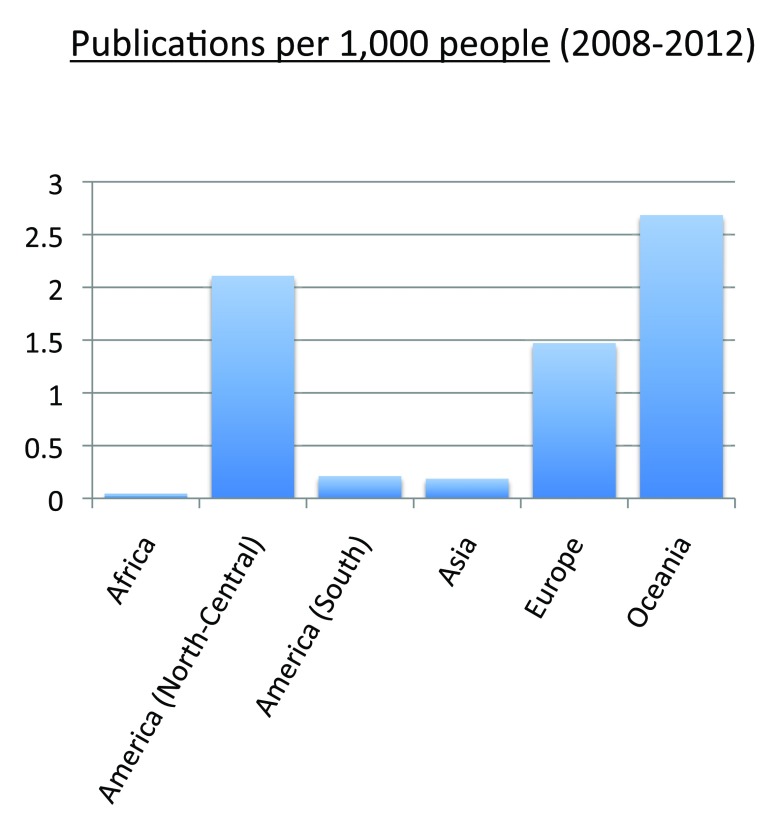
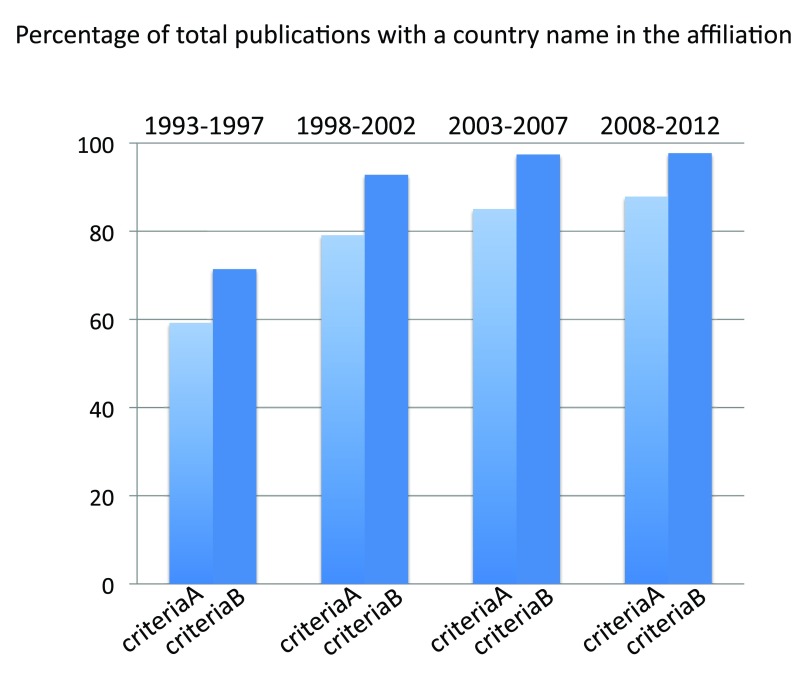
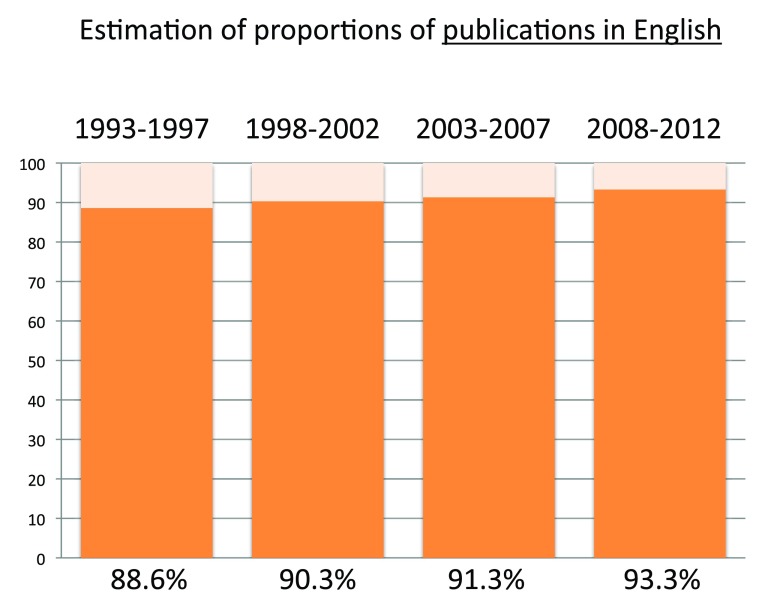
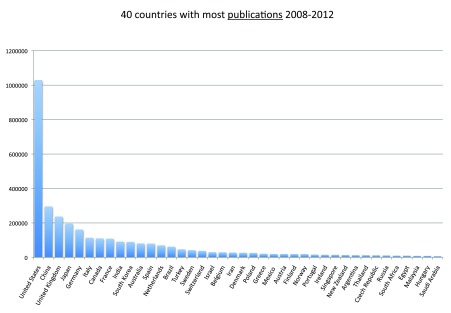
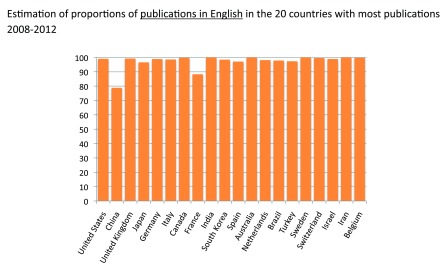
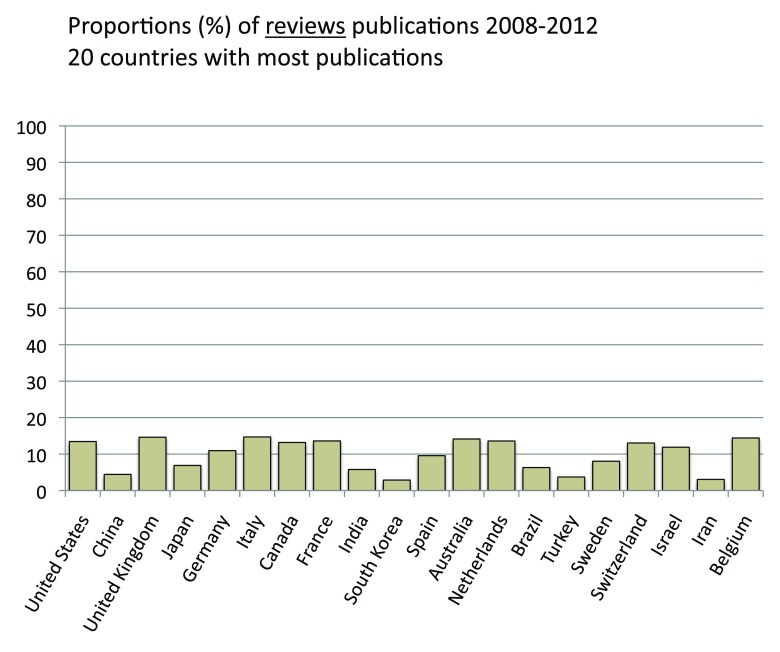
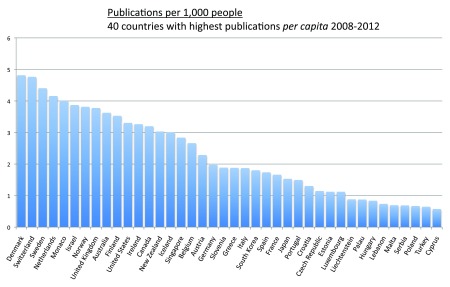
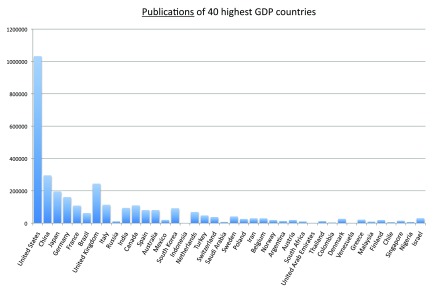
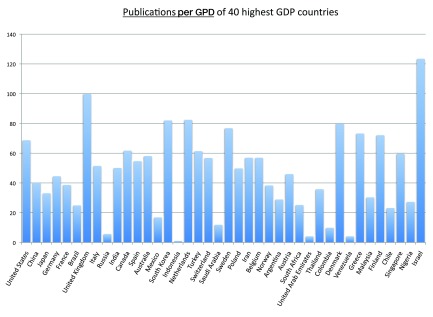
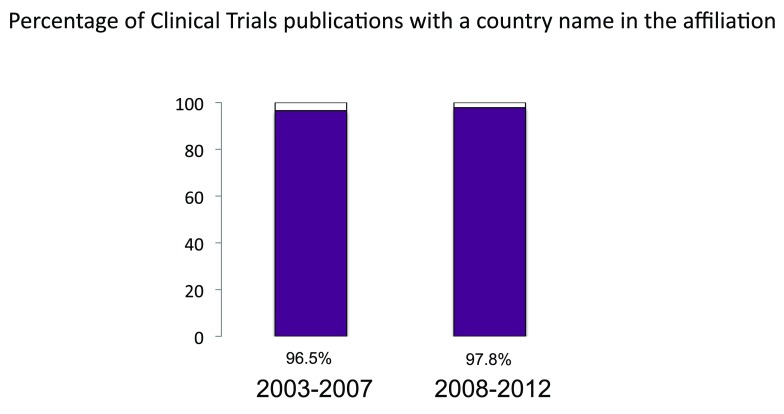
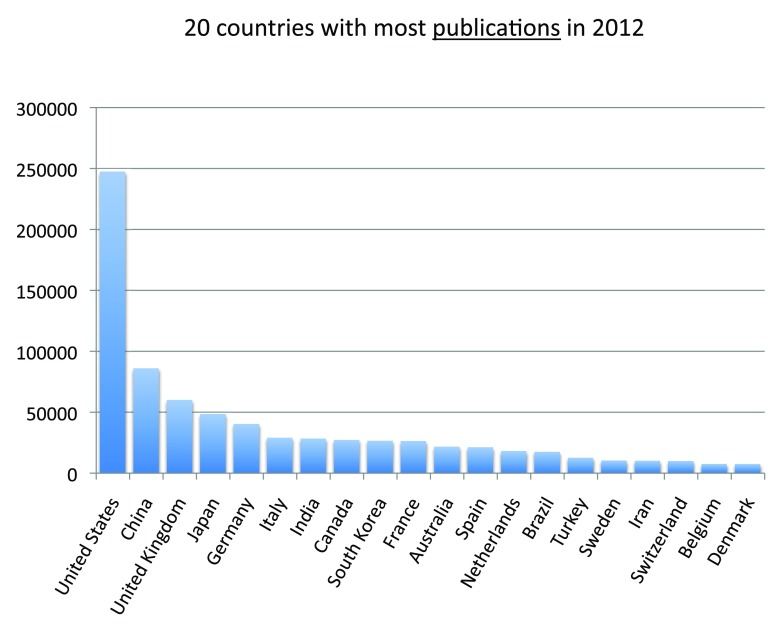
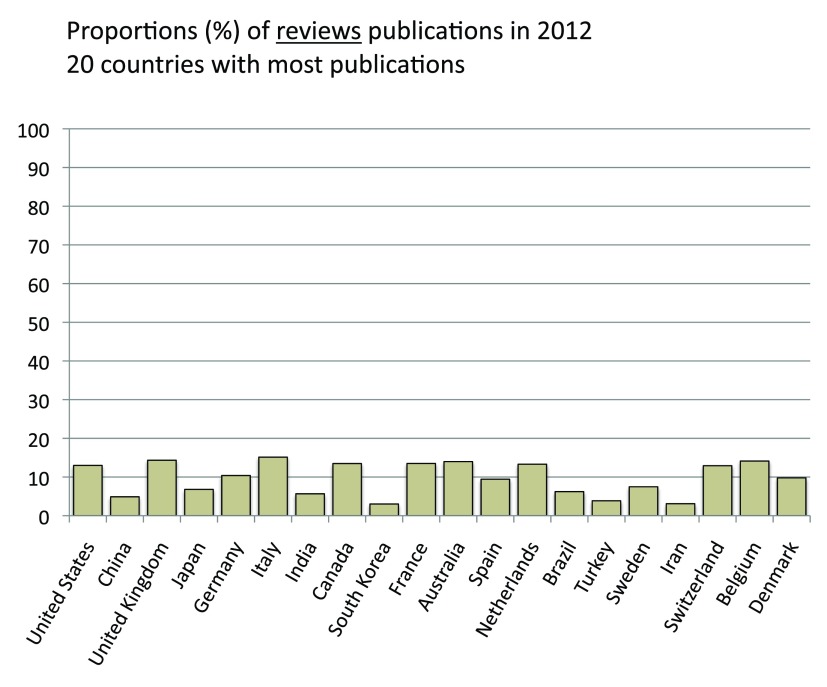
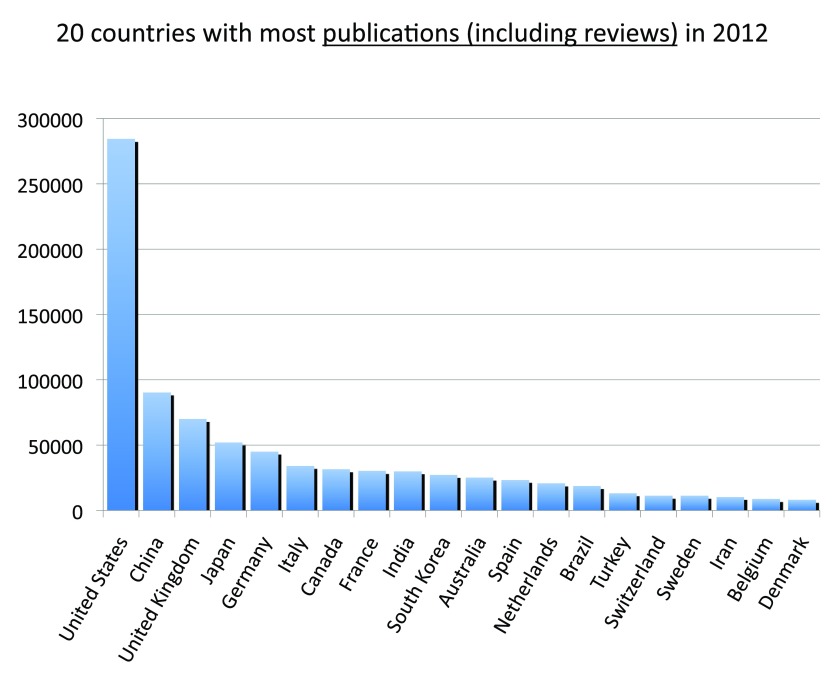
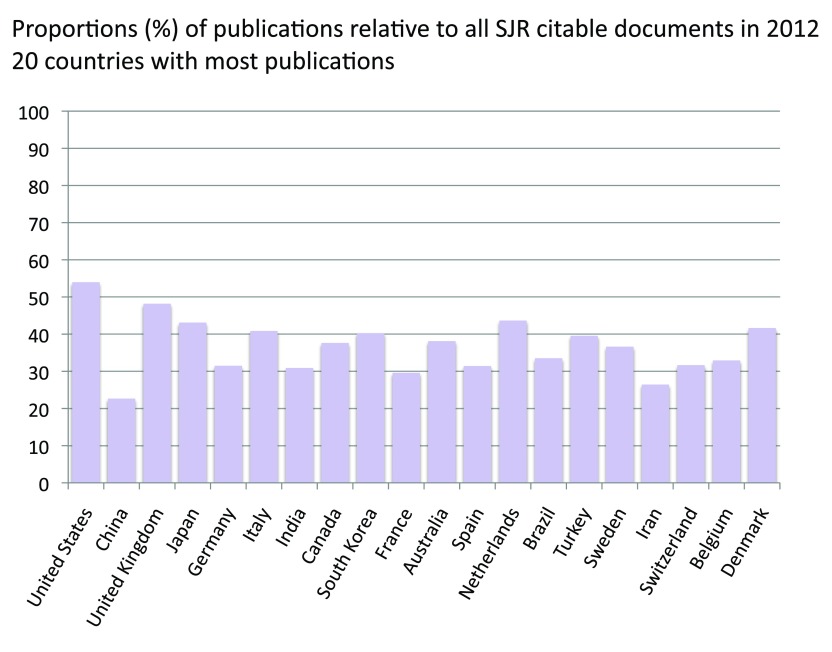
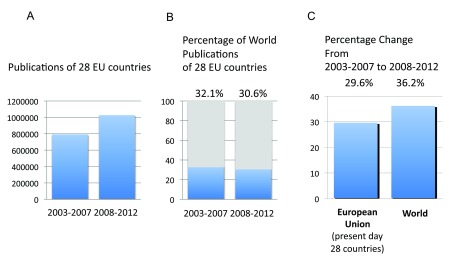
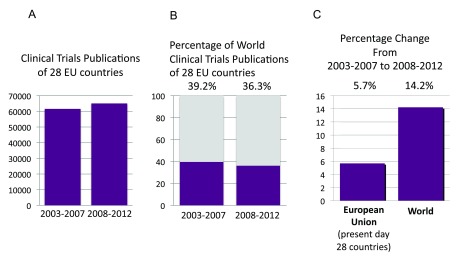
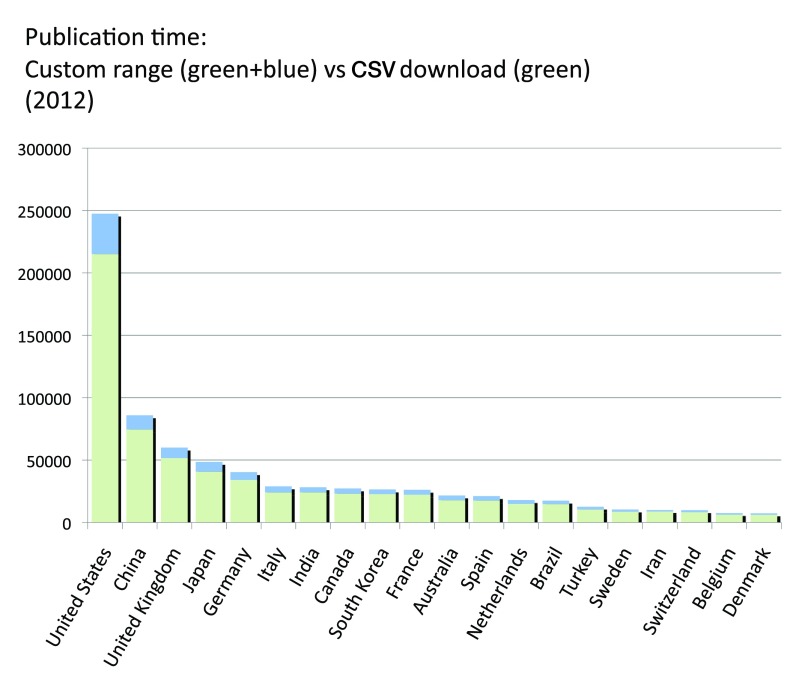
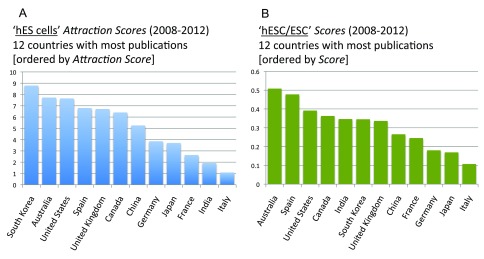
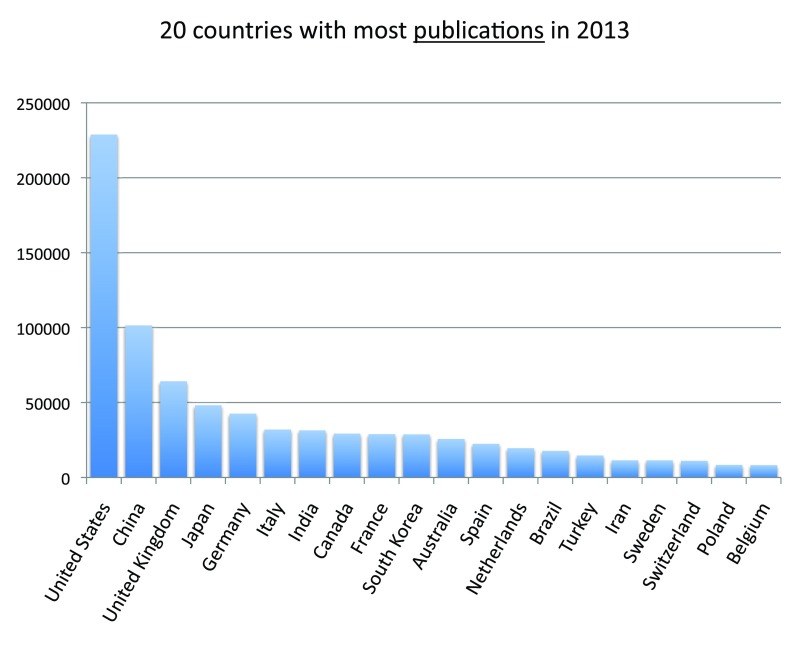
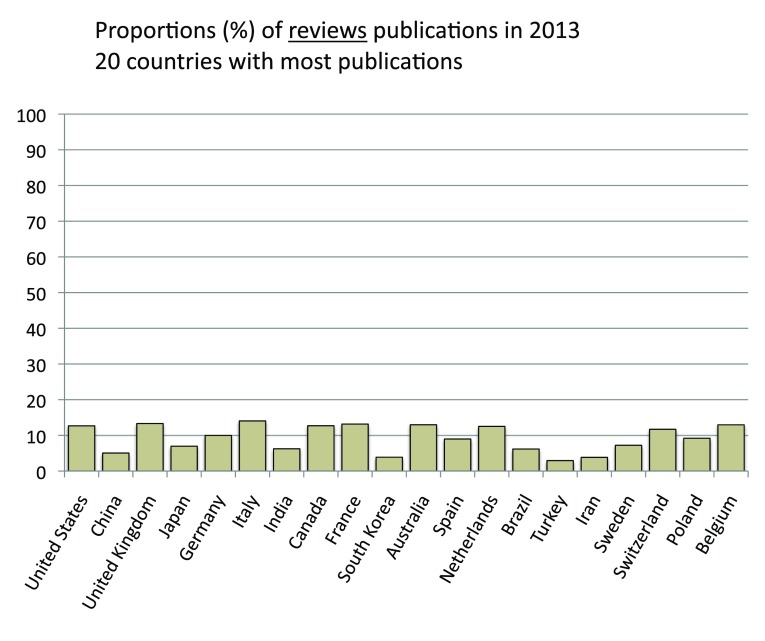
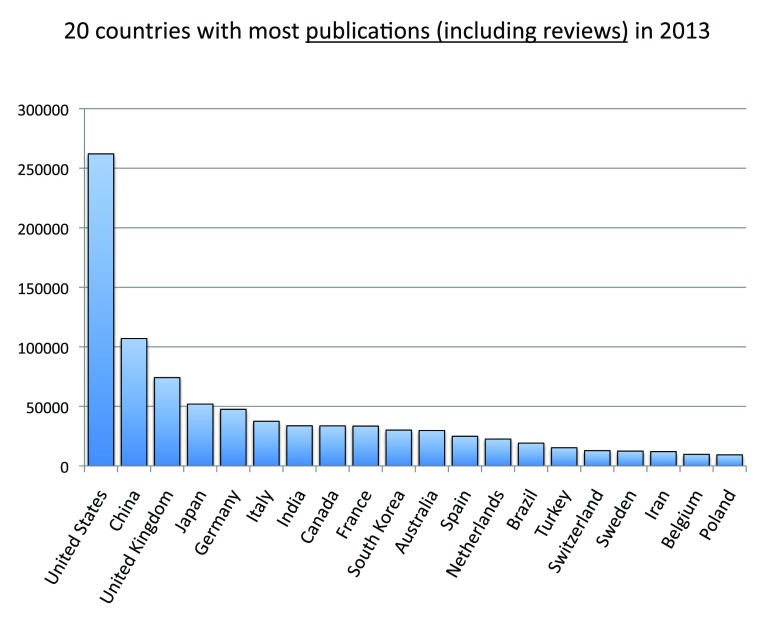
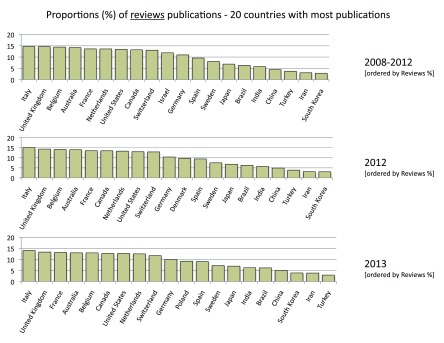
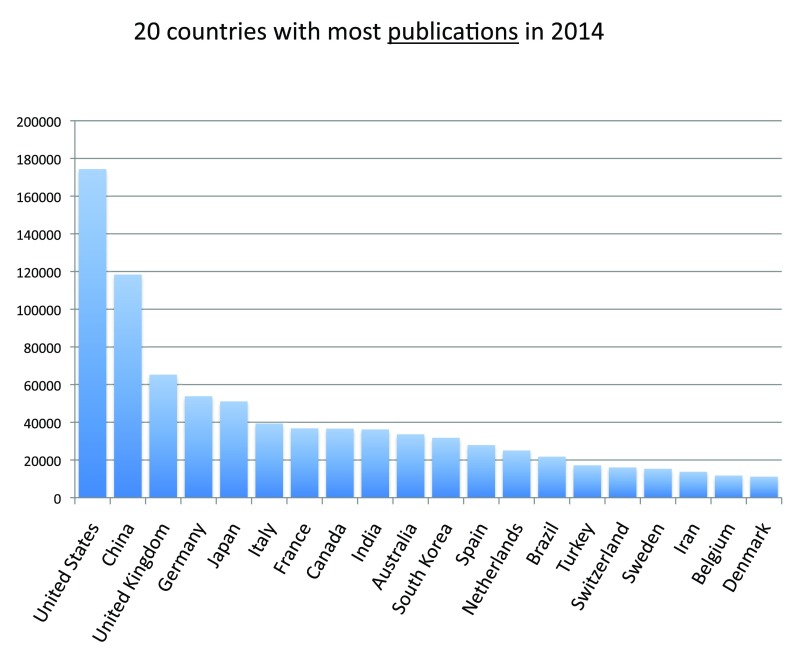
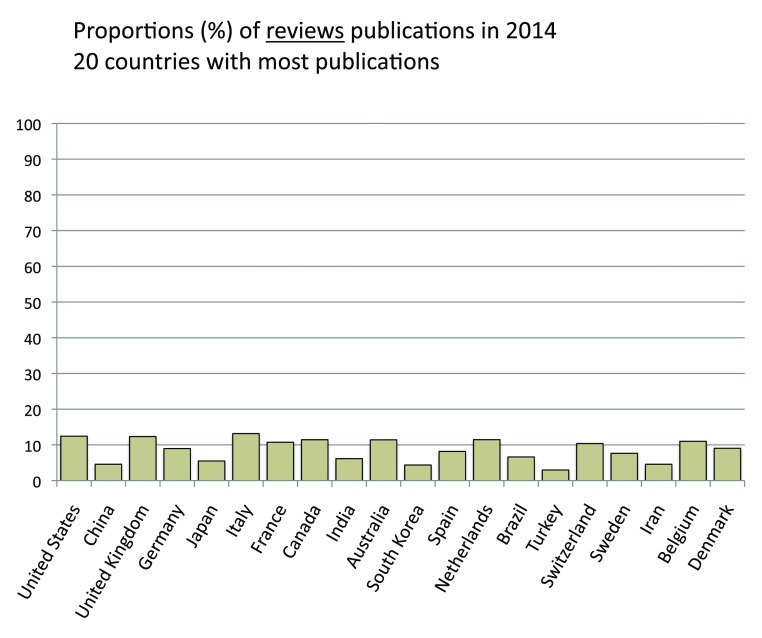
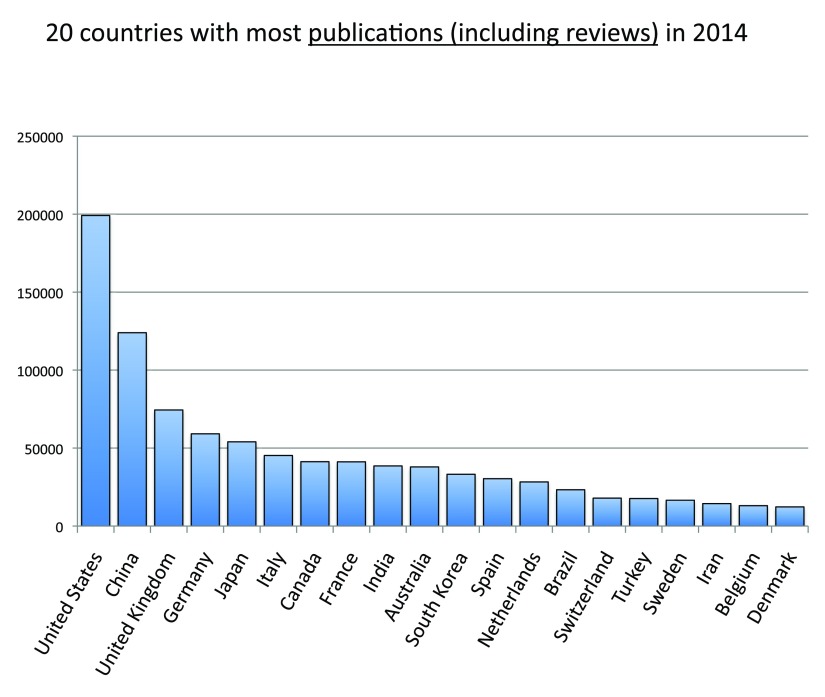
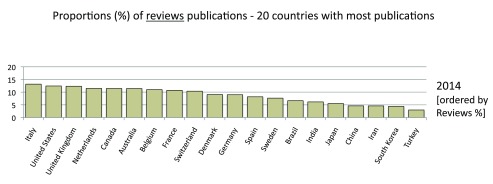
Studying publication volumes at the country level is key to understanding and improving a country's research system. PubMed is a public search engine of publications in all life sciences areas. Here, we show how this search engine can be used to assess the outputs of life science-related research by country. We have measured the numbers of publications during different time periods based on the country of affiliation of the first authors. Moreover, we have designed scores, which we have named Attraction Scores, to appraise the relative focus either toward particular types of studies, such as clinical trials or reviews, or toward specific research areas, such as public health and pharmacogenomics, or toward specific topics, for instance embryonic stem cells; we have also investigated a possible use of these Attraction Scores in connection with regulatory policies. We have weighed the statistics against general indicators such as country populations and gross domestic products (GDP). During the 5-year period 2008-2012, the United States was the country with the highest number of publications and Denmark the one with the highest number of publications per capita. Among the 40 countries with the highest GDPs, Israel had the highest publications-to-GDP ratio. Among the 20 countries with the most publications, Japan had the highest Attraction Score for induced pluripotent stem (iPS) cells and Italy the highest proportion of review publications. More than 50% of publications in English were from countries in which English is not the primary language. We show an assorted and extensive collection of rankings and charts that will inform scholars and policymakers in studying and improving the research systems both at the national and international level.

Keywords: Attraction Score; PubMed; bibliometrics; publications.


Conflict of interest statement

Competing interests: Andrea Boggio and Andrea Ballabeni are members of the board and of the council, respectively, of the Luca Coscioni Association; they do not receive any income from this organization.

Figures

Figure 1.
Figure 1.. Total world publications (reviews excluded) in the 5-year periods 1993–1997, 1998–2002, 2003–2007, and 2008–2012.
Criteria A.
Figure 2.
Figure 2.. Total world Clinical Trial publications (reviews excluded) in the 5-year periods 1993–1997, 1998–2002, 2003–2007, and 2008–2012.
The proportions of publications that are Clinical Trial publications are shown. Criteria E.
Figure 3.
Figure 3.. Numbers of publications (reviews excluded) for the 20 countries with the most publications (reviews excluded) in the 5-year period 2008–2012.
Criteria A.
Figure 4.
Figure 4.. Numbers of publications (reviews excluded) for the 25 countries with the most publications (reviews excluded) in the 5-year period 2008–2012.
The part of publications other than the top 25 countries is shown as “rest of the world” (in pale red). In this case, differently from Figure 3, the data were obtained from 2013 searches. Criteria A.
Figure 5.
Figure 5.. Publications (reviews excluded) per capita in the 20 countries with the most publications (reviews excluded) in the 5-year period 2008–2012.
The numbers represent publications per 1,000 people and were obtained by dividing the number of publications (reviews excluded) by the country populations and multiplying by 1,000. In this case, differently from Figure 3, the data were obtained from 2013 searches. Criteria A.
Figure 6.
Figure 6.. Publications (reviews excluded) per capita in the 20 countries with the highest publication (reviews excluded) per capita ratios in the 5-year period 2008–2012.
The numbers represent publications per 1,000 people and were obtained by dividing the number of publications (reviews excluded) by the country populations and multiplying by 1,000. Criteria A.
Figure 7.
Figure 7.. Numbers of publications (reviews excluded) in the 20 countries with the highest gross domestic products (GDP) in the 5-year period 2008–2012.
Criteria A.
Figure 8.
Figure 8.. Publications (reviews excluded) per capita in the 20 countries with the highest gross domestic products (GDP) in the 5-year period 2008–2012.
The numbers represent publications per 1,000 people and were obtained by dividing the number of publications (reviews excluded) by the country population and multiplying by 1,000. Criteria A.
Figure 9.
Figure 9.. Publications (reviews excluded)-to-GDP ratios in the 20 countries with the highest GDP in the 5-year period 2008–2012.
The numbers of publications (reviews excluded) were divided by the GDPs of 2011 (US$) from World Bank database and multiplied by 10 9. Criteria A.
Figure 10.
Figure 10.. Publications (reviews excluded) per R&D expenditure of the 20 countries with the highest GDP in the 5-year period 2008–2012.
The numbers of publications (reviews excluded) were divided by the R&D expenditure of 2012 expressed as GERD (Gross Expenditures on Research and Development) in billion US$ at Purchasing Power Parity (PPP). The data of R&D expenditures of countries were taken from the Battelle nonprofit private company ( http://www.battelle.org/docs/tpp/2014_global_rd_funding_forecast.pdf). Criteria A.
Figure 11.
Figure 11.. Numbers of Clinical Trial publications (reviews excluded) in the 20 countries with the most Clinical Trial publications (reviews excluded) in the 5-year period 2008–2012.
Criteria E.
Figure 12.
Figure 12.. Numbers of Clinical Trial publications (reviews excluded) in the 20 countries with the highest GDP in the 5-year period 2008–2012.
Criteria E.
Figure 13.
Figure 13.. Relative changes in numbers of publications (reviews excluded) from the 5-year period 2003–2007 to the 5-year period 2008–2012 for the 20 countries with the most publications (reviews excluded).
The relative changes are expressed as percentage change relative to the 5-year period 2003–2007. Criteria A.
Figure 14.
Figure 14.. Relative changes in numbers of Clinical Trial publications (reviews excluded) from the 5-year period 2003–2007 to the 5-year period 2008–2012 for the 20 countries with the most publications (reviews excluded).
The relative changes are expressed as percentage change relative to the 5-year period 2003–2007. Criteria E.
Figure 15.
Figure 15.. “Clinical Trial Attraction Scores” for the 20 countries with the most publications (reviews excluded) in the 5-year period 2008–2012.
The “Clinical Trial Attraction Scores” were calculated by dividing the numbers of Clinical Trials publications (reviews excluded) by the total numbers of publications (reviews excluded) in the 5-year period 2008–2012 and multiplying by 10,000. Criteria A and E.
Figure 16.
Figure 16.. “Pharmacogenomic Attraction Scores” for the 20 countries with the most publications (reviews excluded) in the 5-years period 2008–2012.
The “Topic Attraction Scores” were calculated by dividing the numbers of publications (reviews excluded) with “pharmacogenomic” OR “pharmacogenomics” in the title/abstract field by the total numbers of publications (reviews excluded) in the 5-year period 2008–2012 and multiplying by 10,000. Criteria B.
Figure 17.
Figure 17.. “Personalized Medicine Attraction Scores” for the 20 countries with the most publications (reviews excluded) in the 5-year period 2008–2012.
The “Topic Attraction Scores” were calculated by dividing the numbers of publications (reviews excluded) with “personalized medicine” in the title/abstract field by the total numbers of publications (reviews excluded) in the 5-year period 2008–2012 and multiplying by 10,000. Criteria B.
Figure 18.
Figure 18.. “Health Attraction Scores” and “Public Health Attraction Scores” for the 12 countries with the most publications (reviews excluded) in the 5-year period 2008–2012.
( A) The “Topic Attraction Scores” were calculated by dividing the numbers of publications (reviews excluded) with “health” in the title/abstract field by the total numbers of publications (reviews excluded) in the 5-year period 2008–2012 and multiplying by 10,000. ( B) The “Topic Attraction Scores” were calculated by dividing the numbers of publications (reviews excluded) with “public health” in the title/abstract field by the total numbers of publications (reviews excluded) in the 5-year period 2008–2012 and multiplying the obtained quotient by 10,000. Criteria B.
Figure 19.
Figure 19.. “iPS cells Attraction Scores” and “hiPS cells Attraction Scores” for the 12 countries with the most publications (reviews excluded) in the 5-year period 2008–2012.
( A) The “Topic Attraction Scores” were calculated by dividing the numbers of publications (reviews excluded) with “induced pluripotent stem cells” in the title/abstract field by the total numbers of publications (reviews excluded) in the 5-year period 2008–2012 and multiplying by 10,000. ( B) The “Topic Attraction Scores” were calculated by dividing the numbers of publications (reviews excluded) with “human induced pluripotent stem cells” in the title/abstract field by the total numbers of publications (reviews excluded) in the 5-years period 2008–2012 and multiplying by 10,000. Criteria B.
Figure 20.
Figure 20.. “ES cells Attraction Scores” and “hES cells Attraction Scores” for the 12 countries with the most publications (reviews excluded) in the 5-year period 2008–2012.
( A) The “Topic Attraction Scores” were calculated by dividing the numbers of publications (reviews excluded) with “embryonic stem cells” in the title/abstract field by the total numbers of publications (reviews excluded) in the 5-year period 2008–2012 and multiplying by 10,000. ( B) The “Topic Attraction Scores” were calculated by dividing the numbers of publications (reviews excluded) with “human embryonic stem cells” in the title/abstract field by the total numbers of publications (reviews excluded) in the 5-year period 2008–2012 and multiplying by 10,000. Criteria B.
Figure 21.
Figure 21.. Proportion of publications (reviews excluded) written in English in countries where English is the primary language in the 5-year periods 2003–2007 and 2008–2012.
The proportions are expressed as percentages in the 5-year periods 2003–2007 and 2008–2012. The proportions were determined by dividing the sum of the numbers of publications (reviews excluded) in all the countries where English is the primary language by the sums of the numbers of publications (reviews excluded) in all countries of the world. For countries that we considered to have English as primary language see the data file (sheet 21). Criteria B.
Figure 22.
Figure 22.. Proportions of publications (reviews excluded) per continent in the 5-year period 2008–2012.
The proportions are expressed as percentages. America was divided into North-Central America and South America. The numbers of publications (reviews excluded) for Asia and Europe were approximated by equally dividing the publications (reviews excluded) of Russia and Turkey between the two continents. Criteria B.
Figure 23.
Figure 23.. Relative changes in numbers of publications (reviews excluded) by continent from the 5-year period 2003–2007 to the 5-year period 2008–2012.
The relative changes are expressed as percentages relative to the number of publications (reviews excluded) of the 5-year period 2003–2007. Criteria B.
Figure 24.
Figure 24.. Publications (reviews excluded) per capita by continent in the 5-year period 2008–2012.
The numbers represent the numbers of publications (reviews excluded) per 1,000 people by continent in the 5-year period 2008–2012. Criteria B.
Figure S1.
Figure S1.. Percentages of publications (reviews excluded) with the country name in the affiliation field.
Criteria A and B were used to calculate the proportions in the 5-year periods 1993–1997, 1998–2002, 2003–2007, and 2008–2012. The total world publications (reviews excluded) were obtained by searches without any specification in the affiliation field. The total world publications (reviews excluded) with the country name in the affiliation field were obtained by summing the numbers of publications (reviews excluded) of all countries of the world.
Figure S2.
Figure S2.. Estimation of the percentages of publications (reviews excluded) written in English in the 5-year periods 1993–1997, 1998–2002, 2003–2007, and 2008–2012.
The percentages were calculated by determining the proportions between the numbers of publications obtained with criteria D and the numbers of publications obtained with criteria A.
Figure S3.
Figure S3.. Numbers of publications (reviews excluded) of the 40 countries with the most publications (reviews excluded) in the 5-year period 2008–2012.
In this case, differently from Figure 3, the data were obtained from 2013 searches. Criteria A.
Figure S4.
Figure S4.. Estimation of the percentages of publications (reviews excluded) written in English of the 20 countries with the most publications (reviews excluded) in the 5-year period 2008–2012.
The percentages were calculated by determining the proportions between the numbers of publications obtained with criteria D and the numbers of publications obtained with criteria A.
Figure S5.
Figure S5.. Estimation of the percentages of review publications of the 20 countries with the most publications (reviews excluded) in the 5-year period 2008–2012.
The percentages were calculated by determining the proportion between the numbers of publications obtained with Criteria A and the numbers of publications obtained with Criteria A but without the exclusion of the reviews.
Figure S6.
Figure S6.. Publications (reviews excluded) per capita of the 40 countries with the highest publication (reviews excluded) per capita in the 5-year period 2008–2012.
The numbers represent publications per 1,000 people and were obtained by dividing the number of publications (reviews excluded) by the country populations and by multiplying by 1,000. Criteria A.
Figure S7.
Figure S7.. Publications (reviews excluded) of the 40 countries with the highest GDP in the 5-year period 2008–2012.
Criteria A.
Figure S8.
Figure S8.. Publications (reviews excluded)-to-GDP ratios in the 40 countries with the highest GDP in the 5-year period 2008–2012.
The numbers of publications (reviews excluded) were divided by the GDP of 2011 (US$) from World Bank database and multiplied by 10 9. Criteria A.
Figure S9.
Figure S9.. Percentages of Clinical Trial publications (reviews excluded) with country name in the affiliation field.
Criteria E were used to calculate the proportions in the 5-year periods 2003–2007 and 2008–2012. The total world Clinical Trials publications (reviews excluded) were obtained by searches without any specification in the affiliation field. The total world Clinical Trials publications (reviews excluded) with the country name in the affiliation field were obtained by summing the numbers of Clinical Trials publications (reviews excluded) in all countries of the world.
Figure S10.
Figure S10.. Numbers of publications (reviews excluded) of the 20 countries with the most publications (reviews excluded) in the year 2012.
Criteria A.
Figure S11.
Figure S11.. Estimation of the percentages of review publications of the 20 countries with the most publications (reviews excluded) in the year 2012.
The percentages were calculated by determining the proportions between the numbers of publications obtained with Criteria A and the numbers of publications obtained with Criteria A but without the exclusion of the reviews.
Figure S12.
Figure S12.. Numbers of publications (reviews included) of the 20 countries with the most publications in the year 2012.
Criteria A (without reviews exclusion).
Figure S13.
Figure S13.. Proportions between the numbers of publications (reviews included) and the SJR citable documents of the 20 countries with the most publications in the year 2012.
The proportions were calculated by dividing the numbers of publications (reviews included) and all the citable documents of the SJR database (SCImago Journal & Country Rank) of the 20 countries with the most publications in the year 2012.
Figure S14.
Figure S14.. Publications of the European Union.
( A) Numbers of publications (reviews excluded) of the present day 28 countries of the European Union in the 5-year periods 2003–2007 and 2008–2012. ( B) Share of total world publications (reviews excluded) that came from the present day 28 countries of the European Union in the 5-year periods 2003–2007 and 2008–2012. ( C) Relative changes in numbers of publications (reviews excluded) of the present day 28 countries of the European Union and of the World from the 5-year period 2003–2007 to the 5-year period 2008–2012. The changes are expressed as percentage changes relative to the 5-year period 2003–2007. Criteria A.
Figure S15.
Figure S15.. Clinical Trial Publications of the European Union.
( A) Numbers of Clinical Trials publications (reviews excluded) of the present day 28 countries of the European Union in the 5-year periods 2003–2007 and 2008–2012. ( B) Share of total world Clinical Trials publications (reviews excluded) that came from the present day 28 countries of the European Union in the 5-year periods 2003–2007 and 2008–2012. ( C) Relative changes in numbers of Clinical Trial publications (reviews excluded) of the present day 28 countries of the European Union and of the World from the 5-year period 2003–2007 to the 5-year period 2008–2012. The changes are expressed as percentage changes relative to the 5-year period 2003–2007. Criteria A and E.
Figure S16.
Figure S16.. A comparison between automatic CSV downloads and custom range searches.
Numbers of publications (reviews excluded) of the 20 countries with the most publications (reviews excluded) in the year 2012 are shown, either obtained by automatic CSV downloads (pale green) or by custom range searches (pale green + pale blue). The pale blues portions of the bars represent the differences between the two methods. Criteria A.
Figure S17.
Figure S17.. “hES cells Attraction Scores” and “hES cells/ES cells Scores” for the 12 countries with the most publications (reviews excluded) in the 5-year period 2008–2012.
( A) The “Topic Attraction Scores” were calculated by dividing the numbers of publications (reviews excluded) with “human embryonic stem cells” in the title/abstract field by the total numbers of publications (reviews excluded) in the 5-year period 2008–2012 and multiplying by 10,000. The countries are ranked according to the scores. ( B) The “hESC/ESC Scores” were calculated by dividing the numbers of publications (reviews excluded) with “human embryonic stem cells” in the title/abstract field by the numbers of publications (reviews excluded) with “embryonic stem cells” in the title/abstract field in the 5-year period 2008–2012 and multiplying by 10,000. The countries are ranked according to the scores. Criteria B.
Figure S18.
Figure S18.. Numbers of publications (reviews excluded) of the 20 countries with the most publications (reviews excluded) in the year 2013.
Criteria A.
Figure S19.
Figure S19.. Estimation of the percentages of review publications of the 20 countries with the most publications (reviews excluded) in the year 2013.
The percentages were calculated by determining the proportions between the numbers of publications obtained with Criteria A and the numbers of publications obtained with Criteria A but without the exclusion of the reviews.
Figure S20.
Figure S20.. Numbers of publications (reviews included) of the 20 countries with the most publications in the year 2013.
Criteria A (without reviews exclusion).
Figure S21.
Figure S21.. Estimation of the percentages of review publications of the 20 countries with the most publications (reviews excluded) in the indicated years [ranked by percentage of reviews].
The percentages were calculated by determining the proportions between the numbers of publications obtained with Criteria A and the numbers of publications obtained with Criteria A but without the exclusion of the reviews.
Figure S22.
Figure S22.. Numbers of publications (reviews excluded) of the 20 countries with the most publications (reviews excluded) in the year 2014.
Criteria A. Note that starting from 2014 PubMed reports affiliation information not only of the first author (see Methods and Discussion sections for a correct interpretation of 2014 counts).
Figure S23.
Figure S23.. Estimation of the percentages of review publications of the 20 countries with the most publications (reviews excluded) in the year 2014.
The percentages were calculated by determining the proportions between the numbers of publications obtained with Criteria A and the numbers of publications obtained with Criteria A but without the exclusion of reviews.
Figure S24.
Figure S24.. Numbers of publications (reviews included) of the 20 countries with the most publications in the year 2014.
Criteria A (without reviews exclusion).
Figure S25.
Figure S25.. Estimation of the percentages of review publications of the 20 countries with the most publications (reviews excluded) in 2014 [ranked by percentage of reviews].
The percentages were calculated by determining the proportions between the numbers of publications obtained with Criteria A and the numbers obtained with Criteria A but without the exclusion of the reviews.

References

    1. López-Illescas C, de Moya Anegón F, Moed HF: Comparing bibliometric country-by-country rankings derived from the Web of Science and Scopus: the effect of poorly cited journals in oncology. J Inf Sci. 2009;35:244–256. 10.1177/0165551508098603 - DOI
    1. Nejati A, Jenab SMH: A two-dimensional approach to evaluate the scientific production of countries (case study: the basic sciences). Scientometrics. 2010;84(2):357–364. 10.1007/s11192-009-0103-1 - DOI
    1. Anonymous. SCImago Journal & Country Rank. Reference Source
    1. Anonymous. The Research & Innovation Performance of the G20. Reference Source
    1. Anonymous. Knowledge, networks and nations Global scientific collaboration in the 21st century. Reference Source

LinkOut - more resources