. 2015 Sep 23:3:10.
doi: 10.1186/s40170-015-0135-3. eCollection 2015.

The rate of glycolysis quantitatively mediates specific histone acetylation sites

Affiliations

The rate of glycolysis quantitatively mediates specific histone acetylation sites

Ahmad A Cluntun et al. Cancer Metab. .

Abstract

Background: Glucose metabolism links metabolic status to protein acetylation. However, it remains poorly understood to what extent do features of glucose metabolism contribute to protein acetylation and whether the process can be dynamically and quantitatively regulated by differing rates of glycolysis.

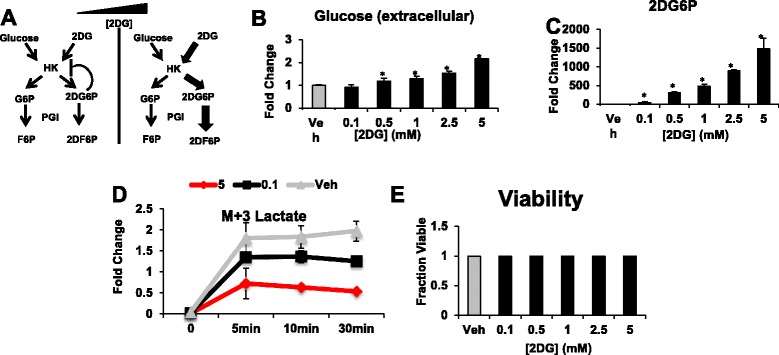
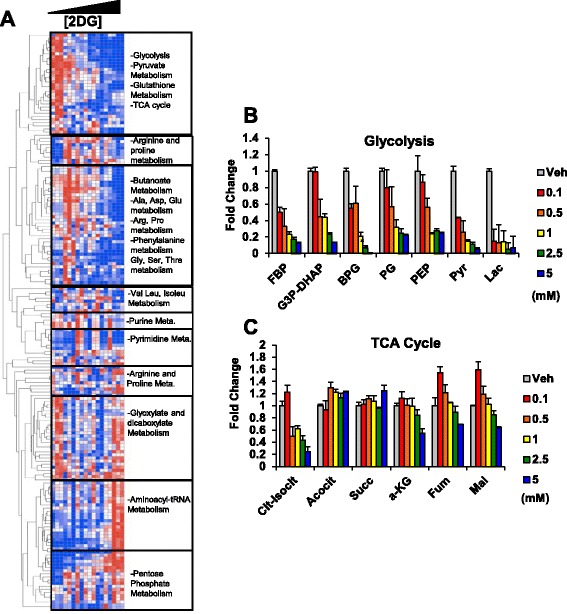
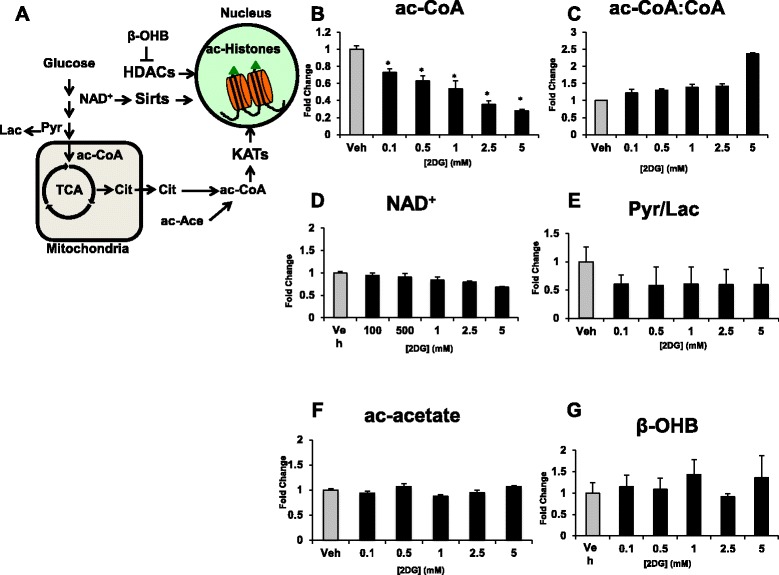
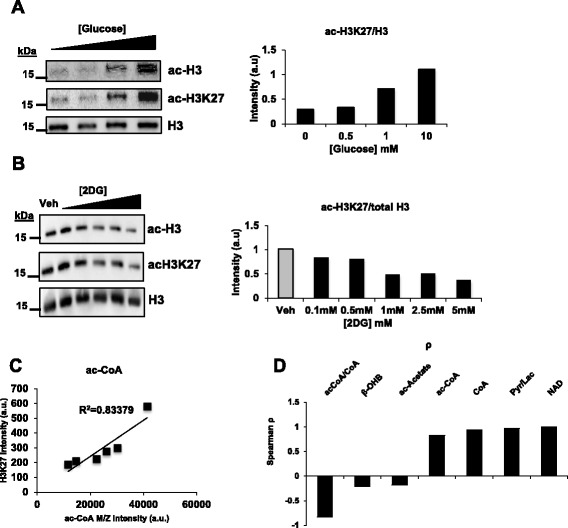
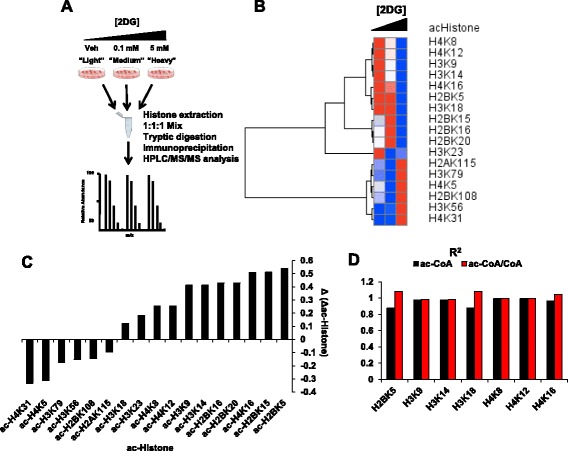
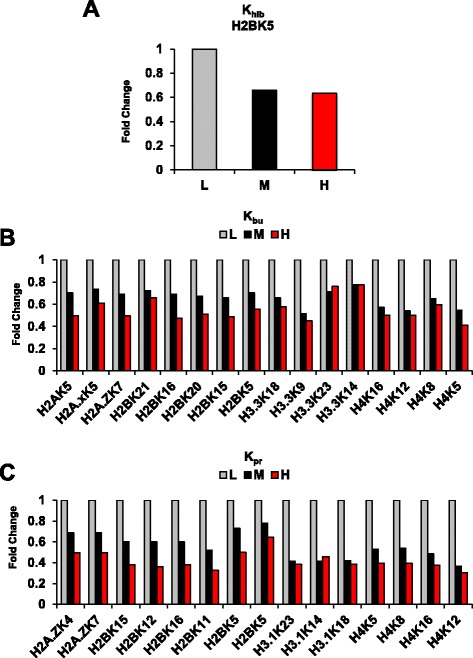
Results: Here, we show that titratable rates of glycolysis with corresponding changes in the levels of glycolytic intermediates result in a graded remodeling of a bulk of the metabolome and resulted in gradual changes in total histone acetylation levels. Dynamic histone acetylation levels were found and most strongly correlated with acetyl coenzyme A (ac-CoA) levels and inversely associated with the ratio of ac-CoA to free CoA. A multiplexed stable isotopic labeling by amino acids in cell culture (SILAC)-based proteomics approach revealed that the levels of half of identified histone acetylation sites as well as other lysine acylation modifications are tuned by the rate of glycolysis demonstrating that glycolytic rate affects specific acylation sites.

Conclusions: We demonstrate that histone acylation is directly sensed by glucose flux in a titratable, dose-dependent manner that is modulated by glycolytic flux and that a possible function of the Warburg Effect, a metabolic state observed in cancers with enhanced glucose metabolism, is to confer specific signaling effects on cells.

Keywords: Acetyl coenzyme A (acetyl-CoA); Cancer; Glycolysis; Histone acetylation; Warburg effect.


Figures

Fig. 1
Fig. 1
The rate of glucose metabolism and extent of metabolic reprogramming can be tuned with pharmacological manipulation. a Schematic of 2DG effect on glycolysis at high vs. low concentrations. b Relative extracellular glucose levels in response to each 2DG concentration compared to the vehicle (Veh). c Relative 2DG6P levels in response to 2DG treatment compared to Veh. d Production rate of 13C-labeled lactate in response to 2DG treatment. Fold change in relative amounts of lactate in media after respective treatments is depicted. e Cell viability test of HCT-116 cells after 6 h of growth under indicated treatments. Mean ± SEM of triplicates relative to the Veh. (*P < 0.05 relative to Veh)
Fig. 2
Fig. 2
2DG treatment has a global effect on cellular metabolism. a Heatmap of effect of 2DG treatment on global metabolism relative to Veh. Values are row-normalized with red denoting high and blue denoting low. b Effect of 2DG treatment on glycolytic metabolite levels relative to Veh. c Effect of 2DG treatment on TCA cycle intermediate levels relative to Veh. Mean ± SEM of triplicates
Fig. 3
Fig. 3
Glucose metabolism quantitatively alters substrates and co-factors for posttranslational modifications. a Known metabolic pathways that can affect histone acetylation. b ac-CoA levels in response to 2DG treatments relative to Veh. c ac-CoA/CoA ratio in response to 2DG treatments relative to Veh. d NAD+ levels in response to 2DG treatments relative to Veh. e Pyruvate/lactate ratio in response to 2DG treatments relative to Veh. f ac-acetate levels in response to 2DG treatments relative to Veh. g β-hydroxybutyrate levels in response to 2DG treatments relative to Veh. Mean ± SEM of triplicates
Fig. 4
Fig. 4
The rate of glycolysis determines histone acetylation. a Western Blot of Pan-acetyl-H3 and H3K27ac in response to glucose titration with quantification, total H3 used as loading control. b Western Blot of Pan-acetyl-H3 and H3K27ac in response to 2DG treatment with quantification, total H3 used as loading control. c Scatter-plot depicting correlation between ac-CoA levels and H3K27ac levels. d Bar graph of Spearman correlation coefficient of ac-CoA:CoA, β-OHB, ac-acetate, ac-CoA, CoA, Pyr/Lac and NAD+. Mean ± SEM of triplicates (*P <0.05 versus Veh)
Fig. 5
Fig. 5
Quantitative proteomics identifies specific dose-dependent changes in histone acetylation. a Schematic of SILAC experiment workflow. b Heatmap of all detected histone acetylated residues in response to 2DG treatment. Values are row-normalized with red denoting high and blue denoting low. c Correlation coefficients of acetylated histones in relation to CoA and ac-CoA levels. d Quantification of the difference in sensitivity of ac-Histone residues to 2DG treatment
Fig. 6
Fig. 6
Histone acylation marks are sensitive to the rate of glycolysis. a 2-hydroxyisobutrylation at H2BK5 in response to 2DG treatment. b Detected Propionylated histone residues responses to 2DG treatment. c Detected Butrylated histone residues responses to 2DG treatment. L:Light (Veh), M:Medium (0.1 mM 2DG), H:Heavy (5 mM 2DG)

References

    1. Pearce EL, Poffenberger MC, Chang CH, Jones RG. Fueling immunity: insights into metabolism and lymphocyte function. Science. 2013;342(6155):1242454. doi: 10.1126/science.1242454. - DOI - PMC - PubMed
    1. Ward PS, Thompson CB. Metabolic reprogramming: a cancer hallmark even warburg did not anticipate. Cancer Cell. 2012;21(3):297–308. doi: 10.1016/j.ccr.2012.02.014. - DOI - PMC - PubMed
    1. Koppenol WH, Bounds PL, Dang CV. Otto Warburg's contributions to current concepts of cancer metabolism. Nat Rev Cancer. 2011;11(5):325–37. doi: 10.1038/nrc3038. - DOI - PubMed
    1. Locasale JW, Cantley LC. Metabolic flux and the regulation of mammalian cell growth. Cell Metab. 2011;14(4):443–51. doi: 10.1016/j.cmet.2011.07.014. - DOI - PMC - PubMed
    1. Locasale JW. The consequences of enhanced cell-autonomous glucose metabolism. Trends Endocrinol Metab. 2012;23(11):545–51. doi: 10.1016/j.tem.2012.07.005. - DOI - PubMed

LinkOut - more resources