. 2015 Sep;2(9):875-93.
doi: 10.1002/acn3.218. Epub 2015 Jun 8.

Central role of Th2/Tc2 lymphocytes in pattern II multiple sclerosis lesions

Affiliations

Central role of Th2/Tc2 lymphocytes in pattern II multiple sclerosis lesions

Raquel Planas et al. Ann Clin Transl Neurol. 2015 Sep.

Abstract

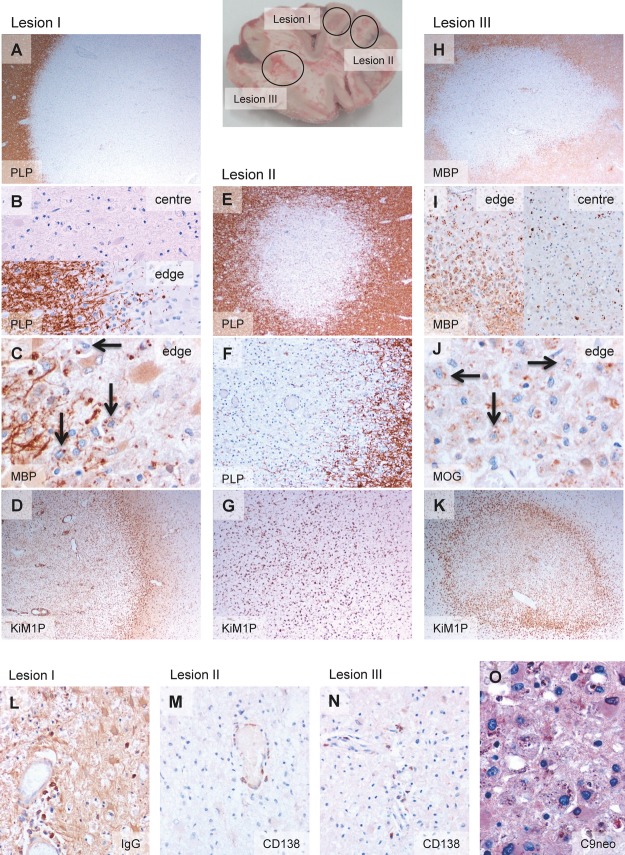
Objective: Multiple sclerosis (MS) is a disease of the central nervous system with marked heterogeneity in several aspects including pathological processes. Based on infiltrating immune cells, deposition of humoral factors and loss of oligodendrocytes and/or myelin proteins, four lesion patterns have been described. Pattern II is characterized by antibody and complement deposition in addition to T-cell infiltration. MS is considered a T-cell-mediated disease, but until now the study of pathogenic T cells has encountered major challenges, most importantly the limited access of brain-infiltrating T cells. Our objective was to identify, isolate, and characterize brain-infiltrating clonally expanded T cells in pattern II MS lesions.

Methods: We used next-generation sequencing to identify clonally expanded T cells in demyelinating pattern II brain autopsy lesions, subsequently isolated these as T-cell clones from autologous cerebrospinal fluid and functionally characterized them.

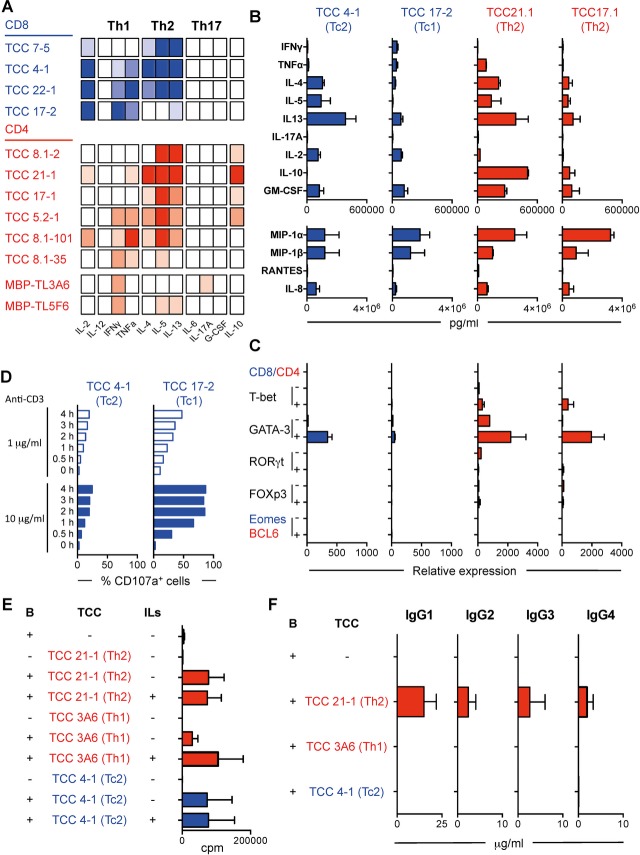
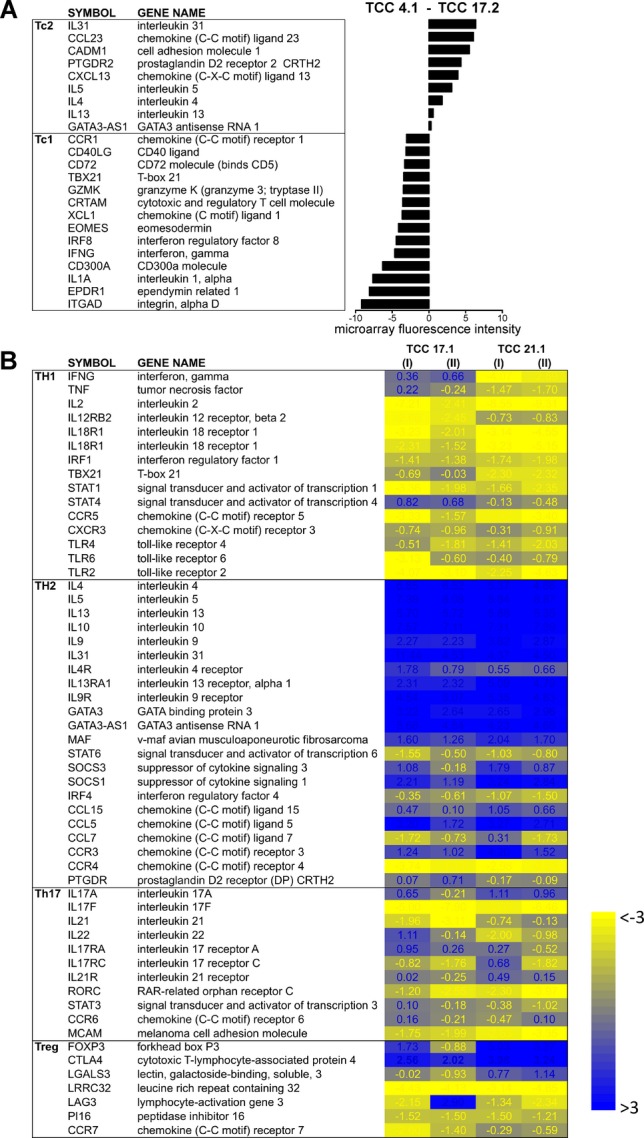
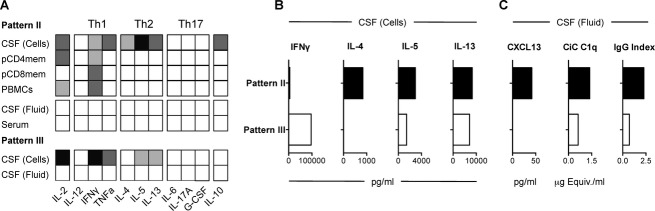
Results: We identified clonally expanded CD8(+) but also CD4(+) T cells in demyelinating pattern II lesions and for the first time were able to isolate these as live T-cell clones. The functional characterization shows that T cells releasing Th2 cytokines and able to provide B cell help dominate the T-cell infiltrate in pattern II brain lesions.

Interpretation: Our data provide the first functional evidence for a putative role of Th2/Tc2 cells in pattern II MS supporting the existence of this pathogenic phenotype and questioning the protective role that is generally ascribed to Th2 cells. Our observations are important to consider for future treatments of pattern II MS patients.


Figures

Figure 1
Figure 1
Pathological features of demyelinating lesions (pattern II patient). Brain picture showing the localization of the three demyelinating lesions. Lesion I, demyelinating lesion (A) with inactive demyelinated lesion center (absence of myelin degradation products within macrophages) and late active demyelinating lesion edge (B and C). Late active demyelinating lesion areas are characterized by the presence of major myelin proteins such as MBP and PLP within macrophages (arrows in C). The lesion shows a macrophage rim at the border (D). Lesion II, inactive demyelinated lesion (E and F) without macrophage rim at the border (G). Lesion III, demyelinating lesion (H) with late active demyelinating lesion center and early active demyelinating lesion edge (I and J). Early active demyelinating lesion areas are characterized by the presence of minor myelin proteins such as MOG within macrophages (arrows in J) in addition to major myelin proteins. A macrophage rim at the lesion border is present (K). Antibody-producing plasma cells are found in lesion I (L), lesion II (M) and lesion III (N), in which also complement deposits are present (O). Original magnifications: (A) 20×. (B) 200×. (C) 400×. (D) 20×. (E) 40×. (F) 100×. (G) 40×. (H) 20×. (I) 100×. (J) 400×. (K) 20×. (L) 200×. (M) 200×. (N) 200×. (O) 400×. MBP, myelin basic protein; PLP, proteolipid protein; MOG, myelin oligodendrocyte glycoprotein.
Figure 2
Figure 2
Functional characterization of brain-infiltrating T cells in demyelinating lesions pattern II. (A) Cytokine release by CD8+ (blue) and CD4+ (red) CSF-derived brain-infiltrating TCCs after stimulation with anti-CD3 and PMA for 24 h using a semi-quantitative multi-analyte ELISArray. Full color indicates OD > 3, medium color indicates 2 > OD > 3, light color 1 > OD > 2 and white OD < 1. (B) Quantification of cytokine and chemokine release by two selected CD8+ (blue) and two CD4+ (red) TCCs using 25-plex Luminex panel. (C) RT-PCR analysis for transcription factors t-bet, Gata-3, RORγt, FOXp3, Eomes and BCL6 in two CD8+ (blue) and two CD4+ (red) brain-infiltrating TCCs unstimulated (−) or stimulated with anti-CD3 and PMA for 24 h (+). Values are relative expression compared to purified naive CD8+ or CD4+ T cells respectively. (D) Time course expression of CD107a after stimulation with 1 or 10 μg/mL of anti-CD3 on two CD8+ brain-infiltrating TCCs. Histograms show the percentage of CD107a+ T cells. (E) Proliferative response measured as thymidine incorporation (counts per minute [cpm]) of B cells cultured alone or co-cultured with irradiated TCCs (two CD4+ [red] and one CD8+ [blue] are shown) in the absence (−) of presence (+) of IL-2 and IL-4. Irradiated TCCs cultured alone were included as additional control. Histograms show cpm. (F) Production of IgG subclasses by B cells cultured alone or co-cultured with irradiated TCCs (two CD4+ [red] and one CD8+ [blue] TCC). All histograms show the mean + SEM. All results represent three independent experiments. CSF, cerebrospinal fluid; OD, optic density.
Figure 3
Figure 3
Gene expression profile of brain-infiltrating CD4+ and CD8+ TCCs. (A) TCC 4.1 (Tc2) and TCC 17.2. (Tc1) were stimulated and their expression profile analyzed by microarrays. Histogram values show differential expression of Tc1- and Tc2-associated genes measured as microarray fluorescence intensity. (B) TCC 17-1, TCC 21-1 and circulating memory CD4+ T cells were stimulated and their expression profile analyzed by microarrays. Heat map shows Th1-, Th2-, Th17- and Treg-associated genes differentially expressed in TCC 17-1 and TCC 21-1 compared with circulating memory CD4+ T cells. I and II are two independent expansions and stimulations of the same TCC. Blue are genes upregulated and yellow downregulated compared with expression in circulating memory CD4+ T cells. Values represent log2FC TCC – circulating memory CD4+ T cells.
Figure 4
Figure 4
Functional characterization of CSF-infiltrating T cells in demyelination pattern II. (A) Cytokine measurement using a semi-quantitative multi-analyte ELISArray in concentrated serum and CSF fluid, and in supernatants of PHA-expanded CSF-infiltrating T cells, memory circulating CD4+ and CD8+ T cells and total PBMCs from a demyelinating pattern II and pattern III patient respectively after stimulation with anti-CD3 and PMA for 24 h. Black indicates OD > 3, dark gray 2 > OD > 3, light gray 1 > OD > 2 and white OD < 1. (B) Quantification of cytokine and chemokine release by PHA-expanded CSF-infiltrating T cells from demyelinating pattern II (black) and pattern III (white) patients by ELISA. (C) Quantification of CXCL13, CiC C1q and IgG antibodies in the CSF fluid from a demyelinating pattern II (black) and pattern III (white) patients. CSF, cerebrospinal fluid; PBMCs, peripheral blood mononuclear cells; OD, optic density.

References

    1. International Multiple Sclerosis Genetics C, Wellcome Trust Case Control C. Sawcer S, et al. Genetic risk and a primary role for cell-mediated immune mechanisms in multiple sclerosis. Nature. 2011;476:214–219. - PMC - PubMed
    1. International Multiple Sclerosis Genetics C. Beecham AH, Patsopoulos NA, et al. Analysis of immune-related loci identifies 48 new susceptibility variants for multiple sclerosis. Nat Genet. 2013;45:1353–1360. - PMC - PubMed
    1. Ascherio A, Munger KL, Lunemann JD. The initiation and prevention of multiple sclerosis. Nat Rev Neurol. 2012;8:602–612. - PMC - PubMed
    1. Lucchinetti C, Bruck W, Parisi J, et al. Heterogeneity of multiple sclerosis lesions: implications for the pathogenesis of demyelination. Ann Neurol. 2000;47:707–717. - PubMed
    1. Metz I, Weigand SD, Popescu BF, et al. Pathologic heterogeneity persists in early active multiple sclerosis lesions. Ann Neurol. 2014;75:728–38. - PMC - PubMed