. 2015 Sep;2(9):906-19.
doi: 10.1002/acn3.227. Epub 2015 Aug 18.

Neurocognitive decline in HIV patients is associated with ongoing T-cell activation in the cerebrospinal fluid

Affiliations

Neurocognitive decline in HIV patients is associated with ongoing T-cell activation in the cerebrospinal fluid

Oliver M Grauer et al. Ann Clin Transl Neurol. 2015 Sep.

Abstract

Objective: HIV-associated neurocognitive disorders (HAND) remain a challenge despite combination antiretroviral therapy (cART). Immune cell activation has been implicated to play a major role in the development of HAND.

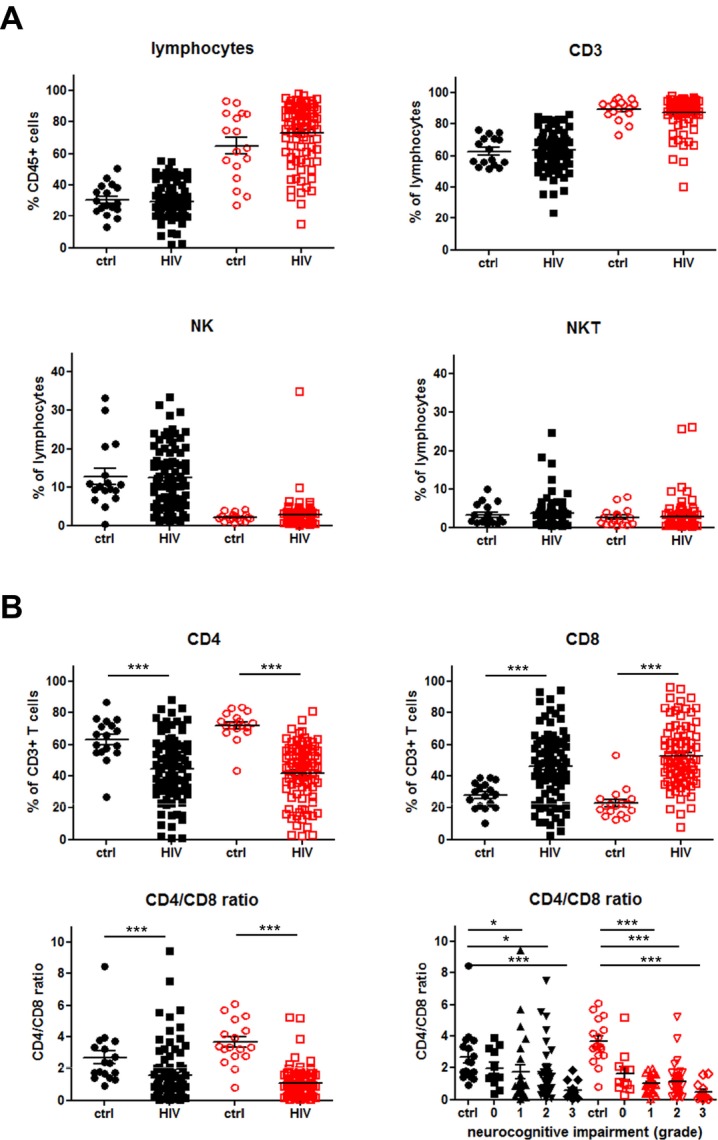
Methods: In this study, we used multicolor flow cytometry on peripheral blood (PB) and cerebrospinal fluid (CSF) samples to determine the expression of HLA-DR and programmed death-1 (PD-1) on CD4+ and CD8+ T cells in patients with chronic HIV infection. Expression levels were correlated with HI virus load in PB and CSF, classification of HAND and severity of magnetic resonance imaging (MRI) signal abnormalities.

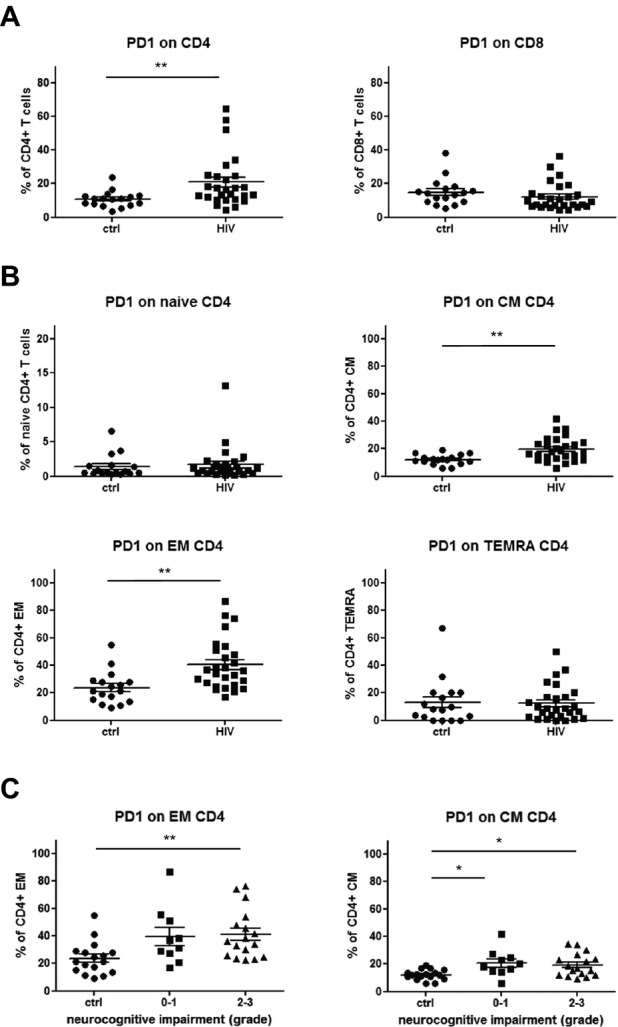
Results: In a cohort of 86 HIV patients we found that the grade of neurocognitive impairment and the severity of MRI signal abnormalities correlated with decreasing CD4/CD8-ratios and increased frequencies of HLA-DR expressing CD4+ and CD8+ T cells reaching the highest values in the CSF samples. Importantly, HLA-DR upregulation was still detectable in virologically suppressed HIV patients. Further, T-cell subpopulation analysis of 40 HIV patients showed a significant shift from naïve to effector memory (EM) T cells that was negatively correlated with the grade of neurocognitive impairment in the PB samples. Moreover, PD-1 was significantly increased on CD4+ memory T cells with highest levels on EM T cells in HIV patients with mild or severe neurocognitive alterations.

Interpretation: The CD4/CD8 ratio, the proportion of EM to naïve T cells and the immune activation profile of CD4+ and CD8+ T cells in PB and CSF might be useful parameters to monitor the efficacy of cART and to identify HIV patients at risk of further neurocognitive deterioration.


Figures

Figure 1
Figure 1
Immune profile of lymphocytes in the peripheral blood (PB) and cerebrospinal fluid (CSF). (A) Proportions of CD45+ lymphocytes, CD3+ T cells (CD3+CD56−), NK cells (CD3−CD56+) and NKT cells (CD3+CD56+) within PB (black symbols) and CSF (red symbols) of control (ctrl, n = 17; closed circles and squares) and HIV patients (HIV,n = 86; open circles and squares) were determined by multicolor flow cytometry as described in Figure S1. (B) Proportions of CD4+ T cells (CD3+CD56−CD4+) and CD8+ T cells (CD3+CD56−CD8+) as well as CD4/CD8 ratio within PB and CSF of control and HIV patients are shown. In addition, CD4/CD8 ratios within PB and CSF according to the grade of neurocognitive impairment are depicted (vertical scatter plot, mean with SEM). P values were calculated using Mann–Whitney test for comparison of two groups, and Kruskal–Wallis test with post hoc Dunn Multiple Comparison analysis for the comparison of three and more groups). Asterisks denote different P values: *< 0.05; ***< 0.0001. For detailed statistics see Table S1A and B.
Figure 2
Figure 2
HLA-DR expression on CD4+ and CD8+ T cells. (A) The expression of HLA-DR on CD4+ and CD8+ T cells within PB (black symbols) and CSF (red symbols) of control (ctrl, n = 17; closed circles and squares) and HIV-patients (HIV,n = 86; open circles and squares) were evaluated by flow cytometry. (B) Graphs showing the percentage of HLA-DR-positive CD4+ and CD8+ T cells within PB (closed black symbols) and CSF (open red symbols) of control and HIV-patients according to the virus load (none, <37 copies/mL, >37 copies/mL). P values were calculated using Mann–Whitney test. Asterisks denote different P values: *P < 0.05; **P < 0.01; ***P < 0.0001. (C) Graphs showing the percentage of HLA-DR-positive CD4+ and CD8+ T cells in PB (closed symbols) and CSF (open symbols) of control and virologically suppressed HIV-patients according to the grade of neurocognitive impairment (grade 0–3) and the severity of MRI signal abnormalities (score 0–5). P values were calculated using Mann–Whitney test for comparison of two groups, and Kruskal–Wallis test with post hoc Dunn Multiple Comparison analysis for the comparison of three and more groups. Asterisks denote different P values: *< 0.05; **< 0.01; ***< 0.0001. For detailed statistics see Table S2A–C. PB, peripheral blood; CSF, cerebrospinal fluid; MRI, magnetic resonance imaging.
Figure 3
Figure 3
Distribution of CD4+ and CD8+ T-cell subpopulations within PB (black symbols) and CSF (red symbols) (n = 40; closed circles and squares) of control and HIV patients. The four defined subpopulations were identified by multicolor parametric flow cytometry as described in Figure S2: Naïve (CCR7+/CD45RA+), CM = central memory (CCR7+/CD45RA-), EM = effector memory (CCR7−/CD45RA−) and TEMRA = terminal differentiated effector memory (CCR7−/CD45RA+) T cells (AB) Proportions of each CD4+ (A) and CD8+ (B) T-cell subsets within PB (ctrl, n = 18; closed circles and squares) and CSF (HIV,n = 40; open circles and squares) are shown. P values were calculated using Mann–Whitney test for comparison of two groups, and Kruskal–Wallis test with post hoc Dunn Multiple Comparison analysis for the comparison of three and more groups. Asterisks denote different P values: *< 0.05; **< 0.01; ***< 0.0001. For detailed statistics see Table S3A and B. PB, peripheral blood; CSF, cerebrospinal fluid.
Figure 4
Figure 4
(A) Correlations between the proportion of CD4+ and CD8+ TEM cells and naïve CD4+ and CD8+ T cells within PB of control and HIV patients. (B) Correlations between the proportion of CD4+ and CD8+ TEM cells and naïve CD4+ and CD8+ naïve T cells within peripheral blood of control and HIV patients according to the grade of neurocognitive impairment (grade 0–1 and grade 2–3). All r and P values correspond to Spearman's test.
Figure 5
Figure 5
PD-1+ expression on CD4+ and CD8+ T-cell subsets. (A) PD-1 expression was determined in T cells from control (ctrl, n = 17; closed circles) and HIV patients (HIV,n = 27; closed squares) by flow cytometry. (A) Graphs comparing the percentage of PD1+ cells within CD4+ and CD8+ T cells in control and HIV-patients. (B) Graphs showing percentages of PD1+ cells on different CD4+ T-cell subsets from control and HIV patients, respectively. (C) Scatter plots illustrating the analysis of PD-1+ cells in relation to the grade of neurocognitive impairment in HIV patients (grade 0–1 and grade 2–3). P values were calculated using Mann–Whitney test for comparison of two groups, and Kruskal–Wallis test with post hoc Dunn Multiple Comparison analysis for the comparison of three and more groups. Asterisks denote different P values: *< 0.05; **< 0.01. For detailed statistics see Table S4A–C.

References

    1. Clifford DB, Ances BM. HIV-associated neurocognitive disorder. Lancet Infect Dis. 2013;13:976–986. - PMC - PubMed
    1. Spudich S. HIV and neurocognitive dysfunction. Curr HIV/AIDS Rep. 2013;10:235–243. - PMC - PubMed
    1. Antinori A, Ammassari A, De Luca A, et al. Diagnosis of AIDS-related focal brain lesions: a decision-making analysis based on clinical and neuroradiologic characteristics combined with polymerase chain reaction assays in CSF. Neurology. 1997;48:687–694. - PubMed
    1. McArthur JC, Hoover DR, Bacellar H, et al. Dementia in AIDS patients: incidence and risk factors. Multicenter AIDS Cohort Study. Neurology. 1993;43:2245–2252. - PubMed
    1. McArthur JC, Selnes OA, Glass JD, et al. HIV dementia. Incidence and risk factors. Res Publ Assoc Res Nerv Ment Dis. 1994;72:251–272. - PubMed

LinkOut - more resources