

Applying Automated MR-Based Diagnostic Methods to the Memory Clinic: A Prospective Study
- PMID: 26401773
- PMCID: PMC4923764
- DOI: 10.3233/JAD-150334
Applying Automated MR-Based Diagnostic Methods to the Memory Clinic: A Prospective Study
Abstract
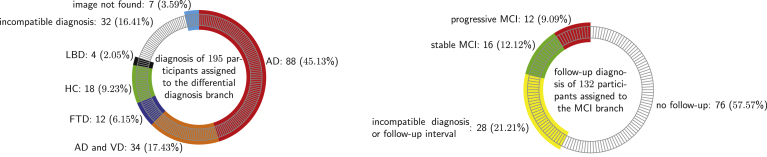
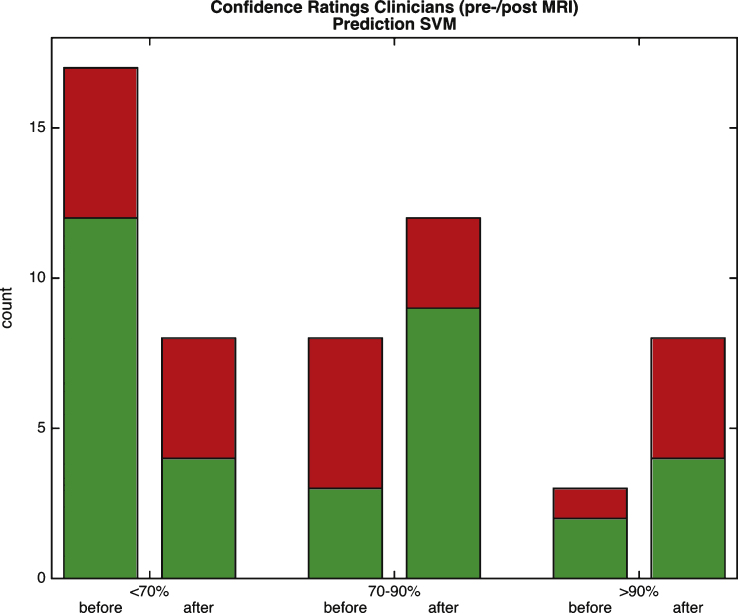
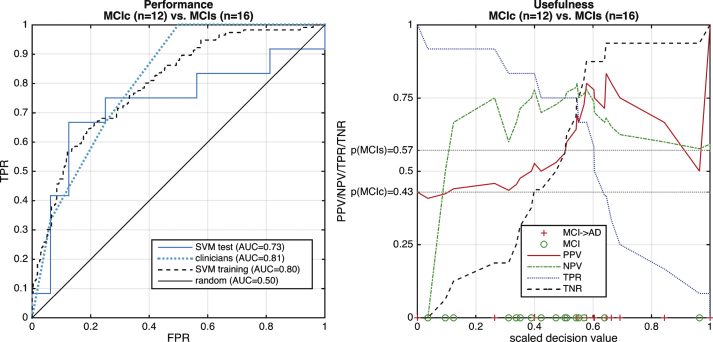
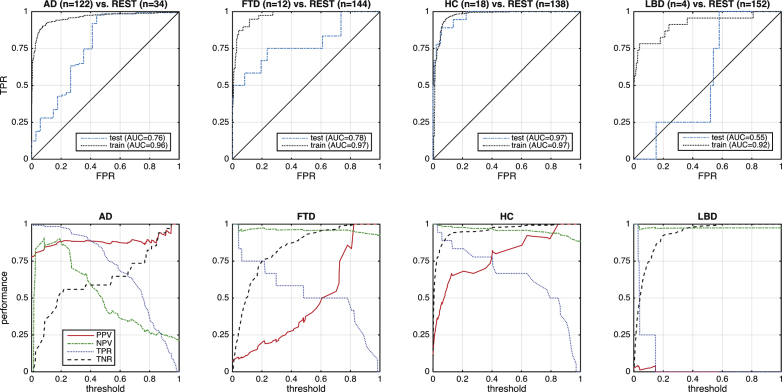
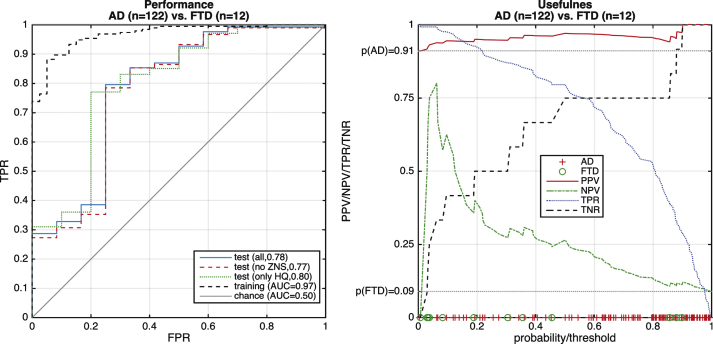
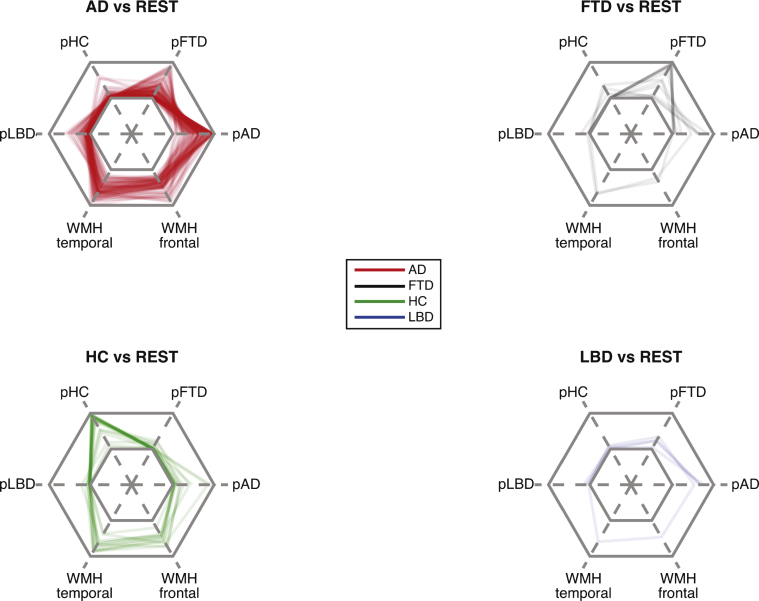
Several studies have demonstrated that fully automated pattern recognition methods applied to structural magnetic resonance imaging (MRI) aid in the diagnosis of dementia, but these conclusions are based on highly preselected samples that significantly differ from that seen in a dementia clinic. At a single dementia clinic, we evaluated the ability of a linear support vector machine trained with completely unrelated data to differentiate between Alzheimer's disease (AD), frontotemporal dementia (FTD), Lewy body dementia, and healthy aging based on 3D-T1 weighted MRI data sets. Furthermore, we predicted progression to AD in subjects with mild cognitive impairment (MCI) at baseline and automatically quantified white matter hyperintensities from FLAIR-images. Separating additionally recruited healthy elderly from those with dementia was accurate with an area under the curve (AUC) of 0.97 (according to Fig. 4). Multi-class separation of patients with either AD or FTD from other included groups was good on the training set (AUC > 0.9) but substantially less accurate (AUC = 0.76 for AD, AUC = 0.78 for FTD) on 134 cases from the local clinic. Longitudinal data from 28 cases with MCI at baseline and appropriate follow-up data were available. The computer tool discriminated progressive from stable MCI with AUC = 0.73, compared to AUC = 0.80 for the training set. A relatively low accuracy by clinicians (AUC = 0.81) illustrates the difficulties of predicting conversion in this heterogeneous cohort. This first application of a MRI-based pattern recognition method to a routine sample demonstrates feasibility, but also illustrates that automated multi-class differential diagnoses have to be the focus of future methodological developments and application studies.
Keywords: Dementia diagnostics; machine learning; magnetic resonance imaging; prognosis; support vector machine.
Figures
References
-
- McKhann G, Drachman D, Folstein M, Katzman R, Price D, Stadlan EM. Clinical diagnosis of Alzheimer’s disease: Report of theNINCDS-ADRDA Work Group under the auspices of Department of Healthand Human Services Task Force on Alzheimer’s Disease. Neurology. 1984;34:939–944. - PubMed
-
- McKhann GM, Knopman DS, Chertkow H, Hyman BT, Jack CR, Jr, Kawas CH, Klunk WE, Koroshetz WJ, Manly JJ, Mayeux R, Mohs RC, Morris JC, Rossor MN, Scheltens P, Carrillo MC, Thies B, Weintraub S, Phelps CH. The diagnosis of dementia due to Alzheimer’s disease: Recommendations from the National Institute on Aging-Alzheimer’s Association workgroups on diagnostic guidelines for Alzheimer’s disease. Alzheimers Dement. 2011;7:263–269. - PMC - PubMed
-
- Condefer KA, Haworth J, Wilcock GK. Clinical utility ofcomputed tomography in the assessment of dementia: A memory clinicstudy. Int J Geriatr Psychiatry. 2004;19:414–421. - PubMed
-
- Hentschel F, Kreis M, Damian M, Krumm B, Frölich L. The clinical utility of structural neuroimaging with MRI for diagnosis and differential diagnosis of dementia: A memory clinic study. Int J Geriatr Psychiatry. 2005;20:645–650. - PubMed
-
- Geroldi C, Canu E, Bruni AC, Dal Forno G, Ferri R, Gabelli C, Perri R, Iapaolo D, Scarpino O, Sinforiani E, Zanetti O, Frisoni GB. The added value of neuropsychologic tests and structuralimaging for the etiologic diagnosis of dementia in italian expertcenters. Alzheimer Dis Assoc Disord. 2008;22:309–320. - PubMed
