. 2015;48(3):647-65.
doi: 10.3233/JAD-150398.

Transcriptomics Profiling of Alzheimer's Disease Reveal Neurovascular Defects, Altered Amyloid-β Homeostasis, and Deregulated Expression of Long Noncoding RNAs

Free PMC article

Transcriptomics Profiling of Alzheimer's Disease Reveal Neurovascular Defects, Altered Amyloid-β Homeostasis, and Deregulated Expression of Long Noncoding RNAs

Marco Magistri et al. J Alzheimers Dis. 2015.
Free PMC article

Abstract

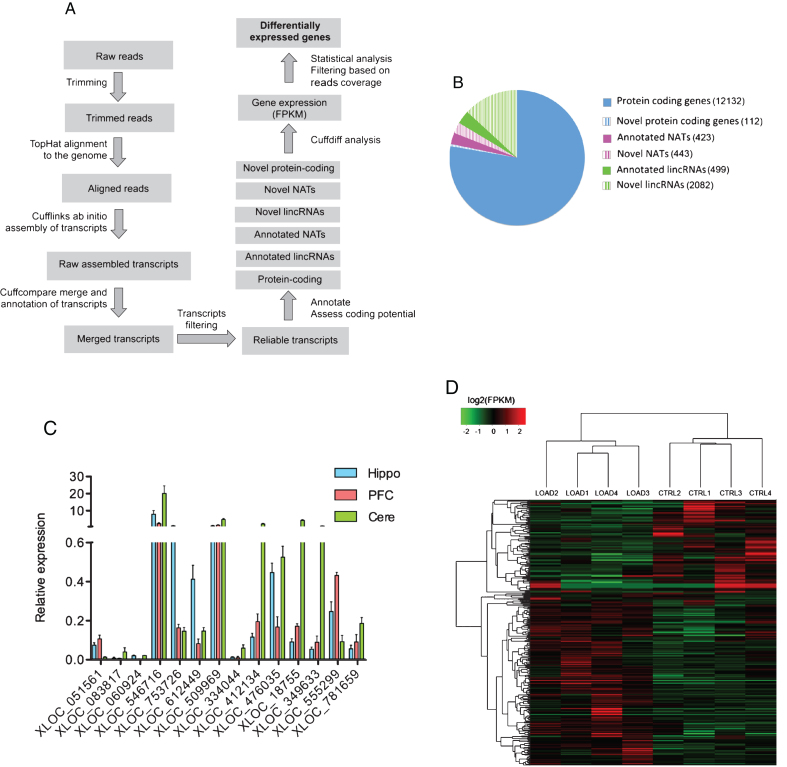
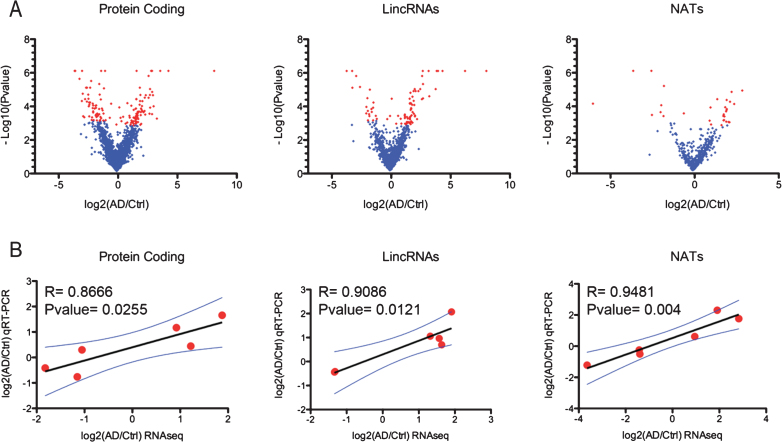
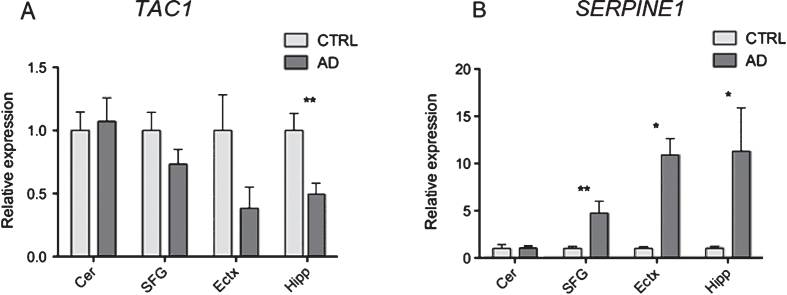
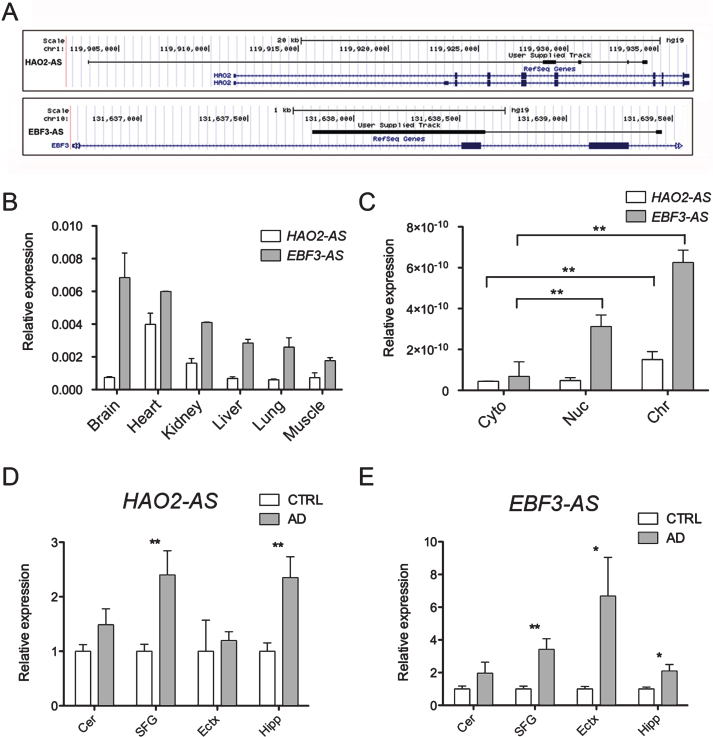
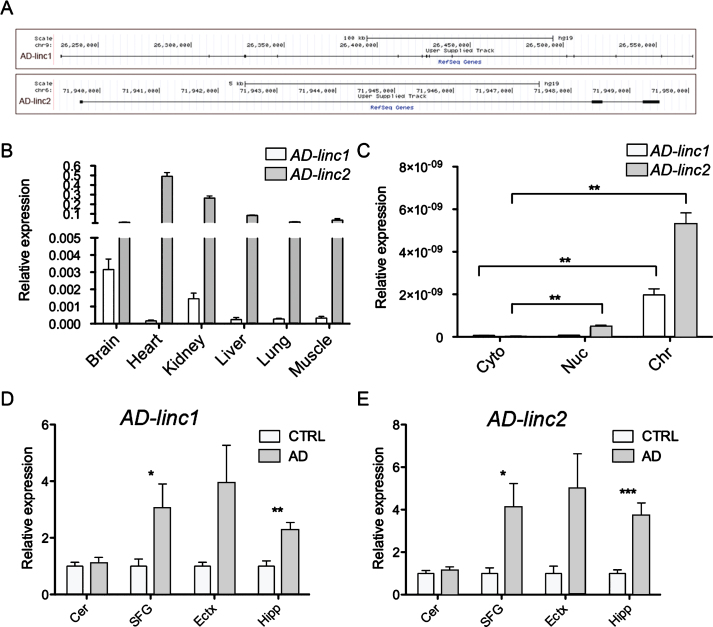
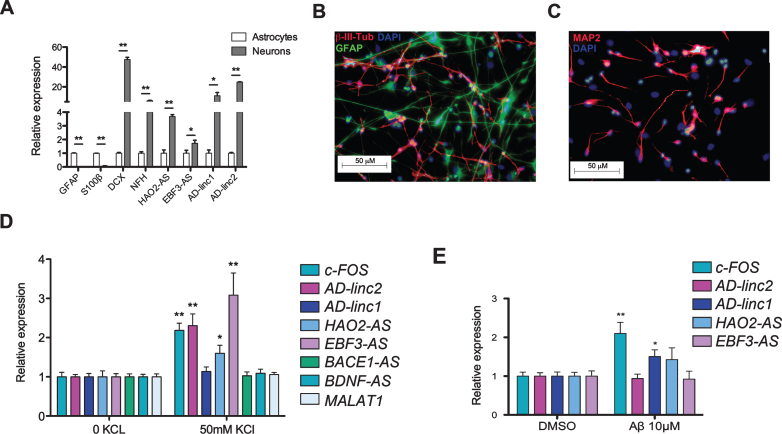
The underlying genetic variations of late-onset Alzheimer's disease (LOAD) cases remain largely unknown. A combination of genetic variations with variable penetrance and lifetime epigenetic factors may converge on transcriptomic alterations that drive LOAD pathological process. Transcriptome profiling using deep sequencing technology offers insight into common altered pathways regardless of underpinning genetic or epigenetic factors and thus represents an ideal tool to investigate molecular mechanisms related to the pathophysiology of LOAD. We performed directional RNA sequencing on high quality RNA samples extracted from hippocampi of LOAD and age-matched controls. We further validated our data using qRT-PCR on a larger set of postmortem brain tissues, confirming downregulation of the gene encoding substance P (TAC1) and upregulation of the gene encoding the plasminogen activator inhibitor-1 (SERPINE1). Pathway analysis indicates dysregulation in neural communication, cerebral vasculature, and amyloid-β clearance. Beside protein coding genes, we identified several annotated and non-annotated long noncoding RNAs that are differentially expressed in LOAD brain tissues, three of them are activity-dependent regulated and one is induced by Aβ(1-42) exposure of human neural cells. Our data provide a comprehensive list of transcriptomics alterations in LOAD hippocampi and warrant holistic approach including both coding and non-coding RNAs in functional studies aimed to understand the pathophysiology of LOAD.

Keywords: Alzheimer’s disease; RNA sequencing; amyloid homeostasis; cerebral vasculature; long noncoding RNAs; natural antisense transcripts.


Figures

Fig.1
Fig.1
RNAseq analysis. A) Schematic representation of the bioinformatics pipeline we used for RNAseq data analysis. This experimentally validated computational approach is suitable for the accurate measurement of gene expression and to discover and annotate novel RNA transcripts. B) Pie chart showing the number of annotated and non-annotated RNA transcripts expressed in at least one of the sequenced hippocampi RNA samples. C) qRT-PCR analysis of novel non-annotated lncRNAs identified by RNAseq. β-ACTIN was used as endogenous control to normalize gene expression analysis. On the Y axe is depicted the expression of the analyzed gene relative to the housekeeping gene β-ACTIN. Error bars are S.D. Hippo: Hippocampus, PFC: Prefrontal Cortex, Cere: Cerebellum. D) Heatmap showing log2(FPKM) values and hierarchical clustering analysis for differentially expressed genes in LOAD versus control hippocampi.
Fig.2
Fig.2
Differential expression analysis. A) Volcano plots revealing significant changes (Blue points; pfp <  0.1: minimum reads coverage of 20) in the expression of protein coding genes, antisense and lincRNAs in the hippocampi of AD patients (n = 4) compared to control (n = 4). B) Technical validation of RNAseq differential expression analysis using qRT-PCR showing high degree of correlation between log2 fold change differences from RNAseq and qRT-PCR data for 6 different protein coding genes, 6 lincRNAs and 6 AS RNA transcripts.
Fig.3
Fig.3
Dysregulation of protein-coding genes and pathways in LOAD. qRT-PCR expression analysis of TAC1 (A) and SERPINE1 (B) mRNA in postmortem brain tissues from four different regions of LOAD and age-matched control. Gene expression is normalized to CTRL. Cer = Cerebellum (24 patients, 20 controls), SFG = Superior frontal Gyrus (17 patients, 18 controls), Ectx = Entorhinal cortex (8 patients, 9 controls), Hipp = Hippocampus (12 patients, 10 controls). PGK1 was used as endogenous control to normalize gene expression analysis. Error bars are S.E.M.;  *p <  0.05;  **p <  0.01.
Fig.4
Fig.4
Dysregulation of natural antisense transcripts in LOAD. A) Schematic representation of the loci expressing the newly discovered antisense RNAs HAO2-AS and EBF3-AS (in black) and their overlapping protein coding genes (in blue). B) qRT-PCR analysis of HAO2-AS and EBF3-AS expression in commercially available RNA from different human tissues. On the Y axe is depicted the expression of the analyzed gene relative to the housekeeping gene β-ACTIN. C) qRT-PCR analysis of HAO2-AS and EBF3-AS expression in RNA extracted from hNSCs fractionated in different cellular compartments: cytosol (Cyto), nucleoplasm (Nuc) and chromatin (Chr). qRT-PCR expression analysis of HAO2-AS (D) andEBF3-AS (E) in postmortem brain tissues from four different regions of LOAD and age-matched control. Cer = Cerebellum (24 patients, 20 controls), SFG = Superior frontal Gyrus (17 patients, 18 controls), Ectx = Entorhinal cortex (8 patients, 9 controls), Hipp = Hippocampus (12 patients, 10 controls). On the Y axe is depicted the expression of the analyzed gene relative to the housekeeping gene ΠΓK1. Gene expression is normalized to CTRL. Error bars are S.E.M.;  *p <  0.05; **p <  0.01.
Fig.5
Fig.5
Dysregulation of long intergenic non-coding RNAs in LOAD. A) Schematic representation of the loci expressing the newly discovered lincRNAs AD-linc1 and AD-linc2 (in black). B) commercially available RNA from different human tissues. On the Y axe is depicted the expression of the analyzed gene relative to the housekeeping gene β-ACTIN. C) qRT-PCR analysis ofAD-linc1 and AD-linc2 expression in RNA extracted from hNSCs fractionated in different cellular compartments: cytosol (Cyto), nucleoplasm (Nuc) and chromatin (Chr). qRT-PCR expression analysis AD-linc1 (D) and AD-linc2 (E) in postmortem brain tissues from four different regions of LOAD and age-matched control. Cer = Cerebellum (24 patients, 20 controls), SFG = Superior frontal Gyrus (17 patients, 18 controls), Ectx = Entorhinal cortex (8 patients, 9 controls), Hipp = Hippocampus (12 patients, 10 controls). On the Y axe is depicted the expression of the analyzed gene relative to the housekeeping gene ΠΓK1. Gene expression is normalized to CTRL. Error bars are S.E.M.;  *p <  0.05; **p <  0.01.
Fig.6
Fig.6
Altered lncRNAs are activity-dependent regulated and induced by Aβ. A) qRT-PCR showing the relative expression of glial (GFAP and S100β) and neuronal markers (DCX and NFH) and LOAD-dysregulated lncRNAs in commercially available RNA extracted from human neurons and human astrocytes. On the Y axe is depicted the expression of the analyzed gene relative to the housekeeping gene β-ACTIN. Gene expression is normalized to astrocytes. B, C) Immunostaining of human NSCs after 21 days of differentiation in vitro. hNSCs can be differentiated into a mixed population of neural cells. Neurons are stained with βIII-Tubulin (B) and MAP2 (C), while astrocytes are stained with GFAP (B). In both images cell nuclei are stained with DAPI. qRT-PCR analysis showing gene expression changes 1 h post KCl stimulation (D) and 48 h post Aβτρɛατμɛντ (E) of hNSCs differentiated for 21 days in vitro. On the Y axe is depicted the expression of the analyzed gene relative to the housekeeping gene β-ACTIN. Gene expression is normalized to non-treated and DMSO-treated cells respectively. Error bars are S.E.M.;  *p <  0.05;  **p <  0.01.

References

    1. Hebert LE, Weuve J, Scherr PA, Evans DA. Alzheimer disease in the United States (2010-2050) estimated using the 2010 census. Neurology. 2013;80:1778–1783. - PMC - PubMed
    1. Barnes DE, Yaffe K. The projected effect of risk factor reduction on Alzheimer’s disease prevalence. Lancet Neurol. 2011;10:819–828. - PMC - PubMed
    1. Liu CC, Kanekiyo T, Xu H, Bu G. Apolipoprotein E and Alzheimer disease: Risk, mechanisms and therapy. Nat Rev Neurol. 2013;9:106–118. - PMC - PubMed
    1. Harold D, Abraham R, Hollingworth P, Sims R, Gerrish A, Hamshere ML, Pahwa JS, Moskvina V, Dowzell K, Williams A, Jones N, Thomas C, Stretton A, Morgan AR, Lovestone S, Powell J, Proitsi P, Lupton MK, Brayne C, Rubinsztein DC, Gill M, Lawlor B, Lynch A, Morgan K, Brown KS, Passmore PA, Craig D, McGuinness B, Todd S, Holmes C, Mann D, Smith AD, Love S, Kehoe PG, Hardy J, Mead S, Fox N, Rossor M, Collinge J, Maier W, Jessen F, Schurmann B, Heun R, van den Bussche H, Heuser I, Kornhuber J, Wiltfang J, Dichgans M, Frolich L, Hampel H, Hull M, Rujescu D, Goate AM, Kauwe JS, Cruchaga C, Nowotny P, Morris JC, Mayo K, Sleegers K, Bettens K, Engelborghs S, De Deyn PP, Van Broeckhoven C, Livingston G, Bass NJ, Gurling H, McQuillin A, Gwilliam R, Deloukas P, Al-Chalabi A, Shaw CE, Tsolaki M, Singleton AB, Guerreiro R, Muhleisen TW, Nothen MM, Moebus S, Jockel KH, Klopp N, Wichmann HE, Carrasquillo MM, Pankratz VS, Younkin SG, Holmans PA, O’Donovan M, Owen MJ, Williams J. Genome-wide association study identifies variants at CLU and PICALM associated with Alzheimer’s disease. Nat Genet. 2009;41:1088–1093. - PMC - PubMed
    1. Lambert JC, Heath S, Even G, Campion D, Sleegers K, Hiltunen M, Combarros O, Zelenika D, Bullido MJ, Tavernier B, Letenneur L, Bettens K, Berr C, Pasquier F, Fievet N, Barberger-Gateau P, Engelborghs S, De Deyn P, Mateo I, Franck A, Helisalmi S, Porcellini E, Hanon O, de Pancorbo MM, Lendon C, Dufouil C, Jaillard C, Leveillard T, Alvarez V, Bosco P, Mancuso M, Panza F, Nacmias B, Bossu P, Piccardi P, Annoni G, Seripa D, Galimberti D, Hannequin D, Licastro F, Soininen H, Ritchie K, Blanche H, Dartigues JF, Tzourio C, Gut I, Van Broeckhoven C, Alperovitch A, Lathrop M, Amouyel P. Genome-wide association study identifies variants at CLU and CR1 associated with Alzheimer’s disease. Nat Genet. 2009;41:1094–1099. - PubMed

Publication types