

Spatial Structure of Above-Ground Biomass Limits Accuracy of Carbon Mapping in Rainforest but Large Scale Forest Inventories Can Help to Overcome
- PMID: 26402522
- PMCID: PMC4581701
- DOI: 10.1371/journal.pone.0138456
Spatial Structure of Above-Ground Biomass Limits Accuracy of Carbon Mapping in Rainforest but Large Scale Forest Inventories Can Help to Overcome
Abstract
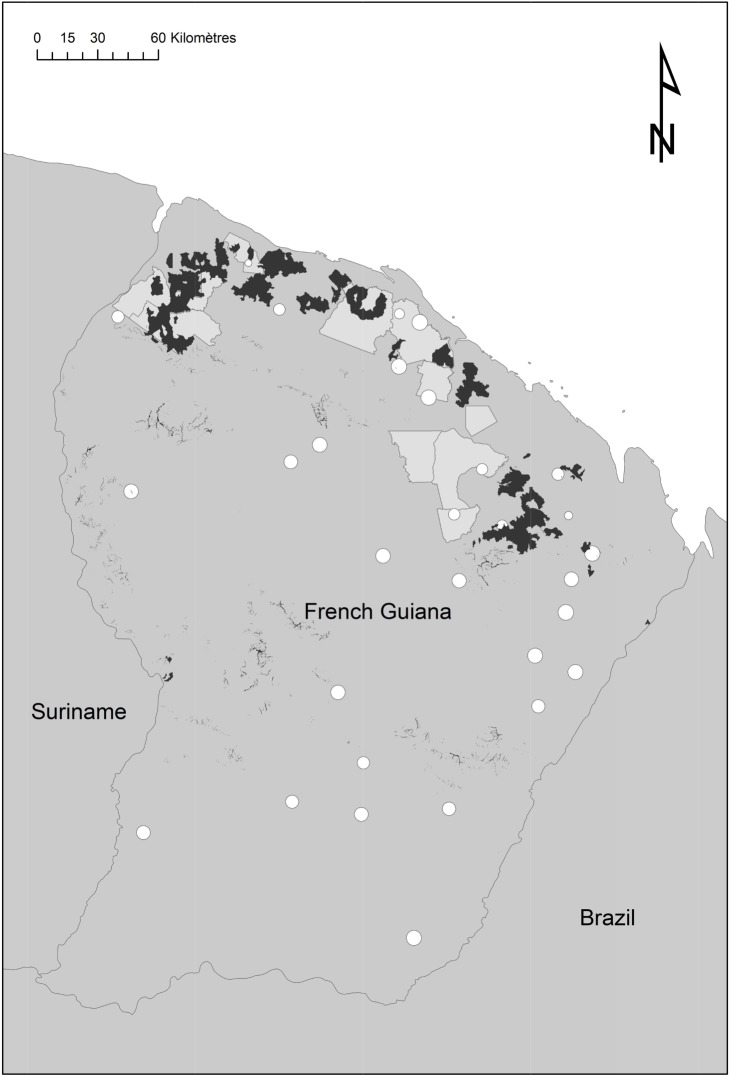
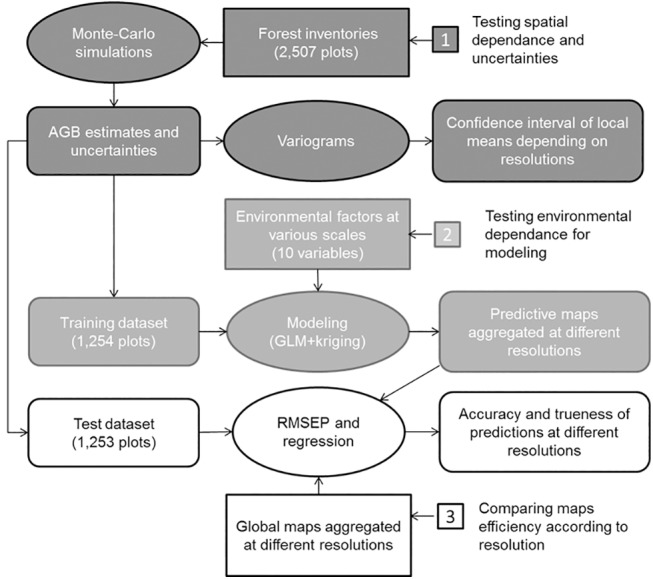
Precise mapping of above-ground biomass (AGB) is a major challenge for the success of REDD+ processes in tropical rainforest. The usual mapping methods are based on two hypotheses: a large and long-ranged spatial autocorrelation and a strong environment influence at the regional scale. However, there are no studies of the spatial structure of AGB at the landscapes scale to support these assumptions. We studied spatial variation in AGB at various scales using two large forest inventories conducted in French Guiana. The dataset comprised 2507 plots (0.4 to 0.5 ha) of undisturbed rainforest distributed over the whole region. After checking the uncertainties of estimates obtained from these data, we used half of the dataset to develop explicit predictive models including spatial and environmental effects and tested the accuracy of the resulting maps according to their resolution using the rest of the data. Forest inventories provided accurate AGB estimates at the plot scale, for a mean of 325 Mg.ha-1. They revealed high local variability combined with a weak autocorrelation up to distances of no more than10 km. Environmental variables accounted for a minor part of spatial variation. Accuracy of the best model including spatial effects was 90 Mg.ha-1 at plot scale but coarse graining up to 2-km resolution allowed mapping AGB with accuracy lower than 50 Mg.ha-1. Whatever the resolution, no agreement was found with available pan-tropical reference maps at all resolutions. We concluded that the combined weak autocorrelation and weak environmental effect limit AGB maps accuracy in rainforest, and that a trade-off has to be found between spatial resolution and effective accuracy until adequate "wall-to-wall" remote sensing signals provide reliable AGB predictions. Waiting for this, using large forest inventories with low sampling rate (<0.5%) may be an efficient way to increase the global coverage of AGB maps with acceptable accuracy at kilometric resolution.
Conflict of interest statement
Figures


References
-
- Gibbs HK, Brown S, Niles JO, Foley JA. Monitoring and estimating tropical forest carbon stocks: making REDD a reality. Environmental Research Letters. 2007;2(4):045023.
-
- Baker DJ, Richards G, Grainger A, Gonzalez P, Brown S, DeFries R, et al. Achieving forest carbon information with higher certainty: A five-part plan. Environmental Science & Policy. 2010;13(3):249–60. 10.1016/j.envsci.2010.03.004 - DOI
-
- Romijn E, Herold M, Kooistra L, Murdiyarso D, Verchot L. Assessing capacities of non-Annex I countries for national forest monitoring in the context of REDD+. Environmental Science & Policy. 2012;19–20(0):33–48. 10.1016/j.envsci.2012.01.005 - DOI
-
- Qureshi A, Badola R, Hussain SA. A review of protocols used for assessment of carbon stock in forested landscapes. Environmental Science & Policy. 2012;16:81–9.
-
- Glenday J. Carbon storage and emissions offset potential in an East African tropical rainforest. For Ecol Manag. 2006;235(1–3):72–83. .
Publication types
MeSH terms
Substances
LinkOut - more resources
Full Text Sources
Other Literature Sources
Research Materials
