Comment
. 2015 Nov;25(11):1189-204.
doi: 10.1038/cr.2015.115. Epub 2015 Sep 25.

PTEN regulates RPA1 and protects DNA replication forks

Affiliations
Comment

PTEN regulates RPA1 and protects DNA replication forks

Guangxi Wang et al. Cell Res. 2015 Nov.

Abstract

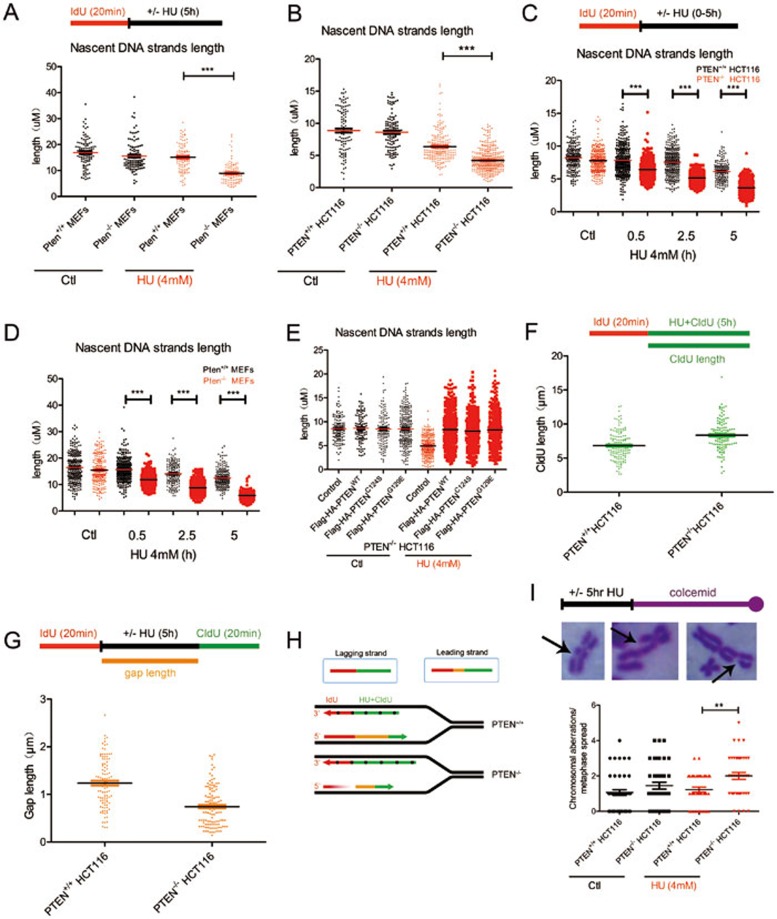
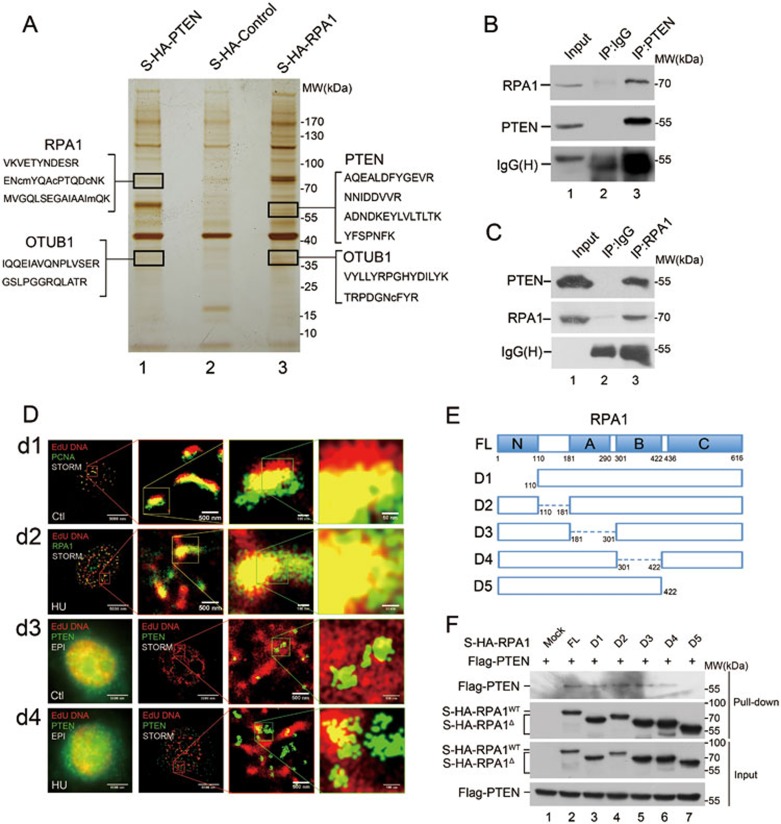
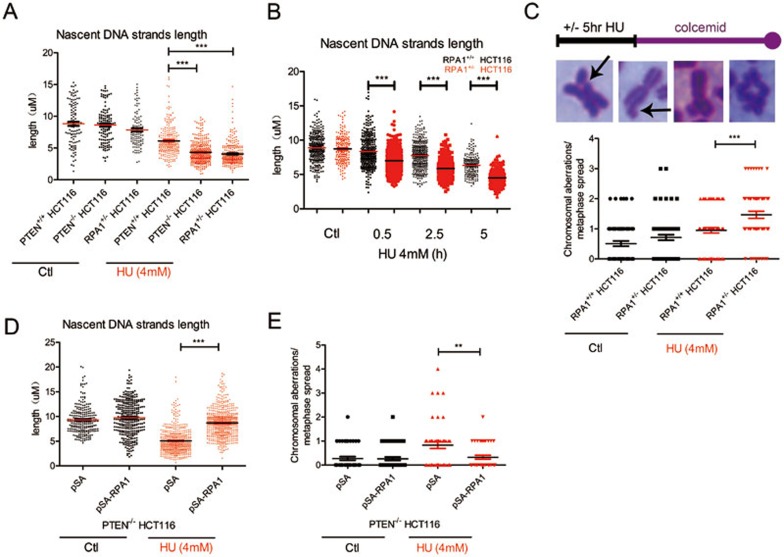
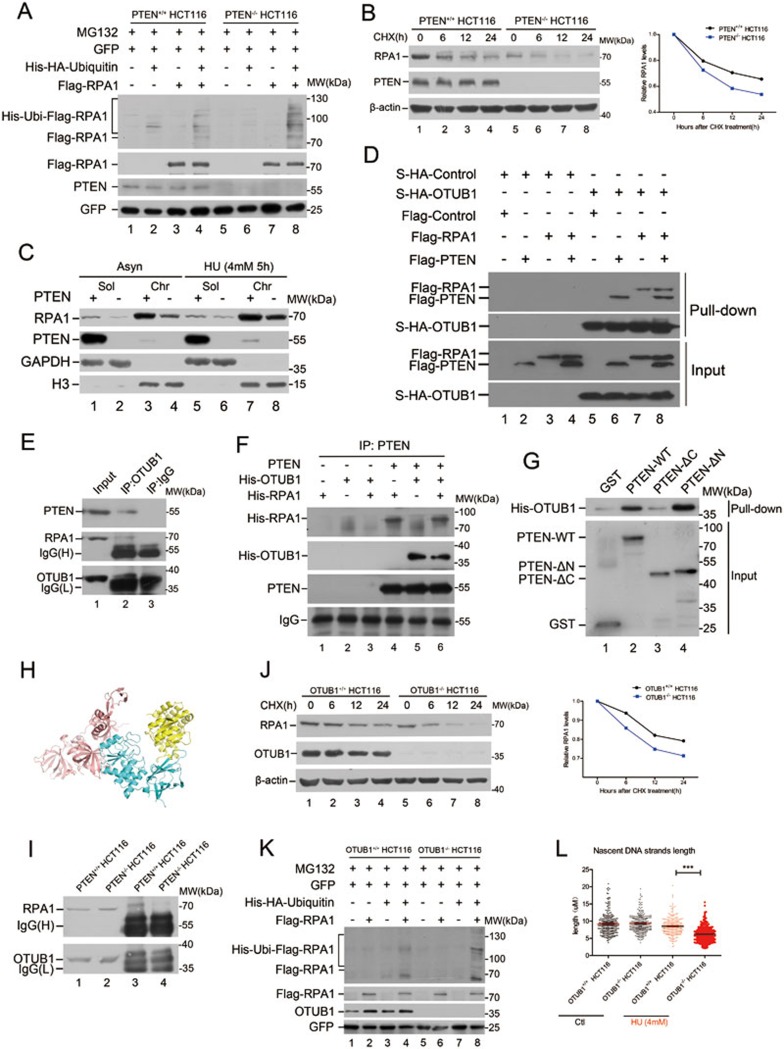
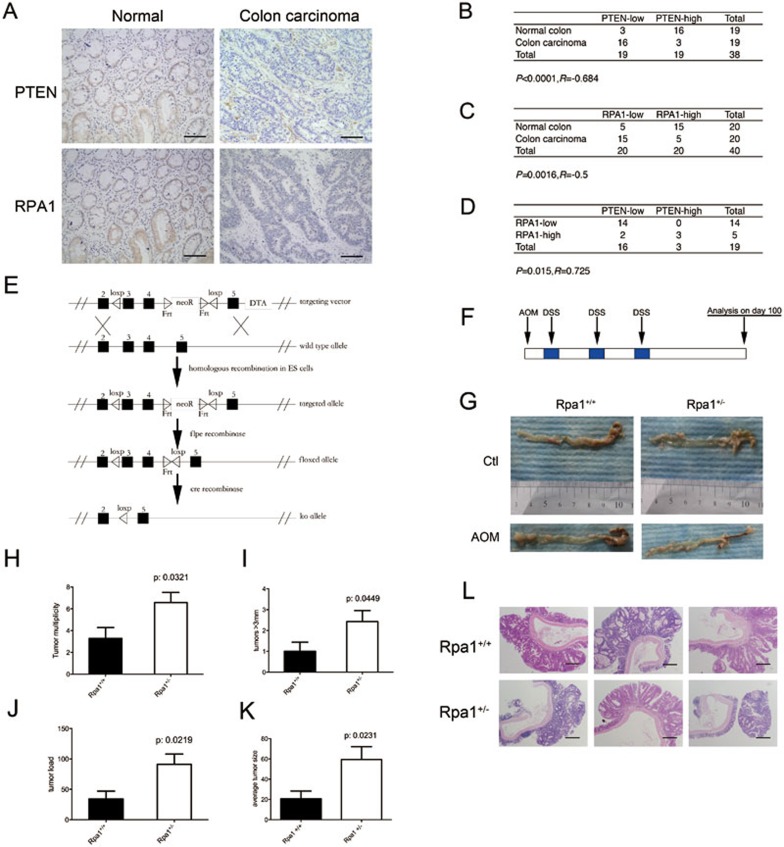
Tumor suppressor PTEN regulates cellular activities and controls genome stability through multiple mechanisms. In this study, we report that PTEN is necessary for the protection of DNA replication forks against replication stress. We show that deletion of PTEN leads to replication fork collapse and chromosomal instability upon fork stalling following nucleotide depletion induced by hydroxyurea. PTEN is physically associated with replication protein A 1 (RPA1) via the RPA1 C-terminal domain. STORM and iPOND reveal that PTEN is localized at replication sites and promotes RPA1 accumulation on replication forks. PTEN recruits the deubiquitinase OTUB1 to mediate RPA1 deubiquitination. RPA1 deletion confers a phenotype like that observed in PTEN knockout cells with stalling of replication forks. Expression of PTEN and RPA1 shows strong correlation in colorectal cancer. Heterozygous disruption of RPA1 promotes tumorigenesis in mice. These results demonstrate that PTEN is essential for DNA replication fork protection. We propose that RPA1 is a target of PTEN function in fork protection and that PTEN maintains genome stability through regulation of DNA replication.


Figures

Figure 1
Figure 1
PTEN protects stalled replication forks and suppresses genomic instability. (A) Experimental design of the DNA fiber assay. Lengths of nascent replication tracts labeled with IdU were measured by DNA spreading after 5 h of replication stalling with or without HU treatment. IdU tracts in Pten−/− MEFs show significant strand shortening with HU treatment as compared with Pten+/+ MEFs. IdU tract lengths reflect replication fork stability. (B) IdU tract lengths in PTEN+/+ and PTEN−/− HCT116 cells with or without HU treatment. (C, D) IdU tract lengths in PTEN+/+ and PTEN−/− HCT116 cells, as well as in Pten+/+ and Pten−/− MEFs with different exposure times to HU treatment. (E) Measurement of IdU tracts in PTEN−/− HCT116 cells untransfected or transfected with Flag-HA-PTENWT, PTEN mutants with or without HU treatment. PTENWT and phosphatase activity dead mutants of PTENC124S and PTENG129E were tested for the ability to rescue stalled DNA replication forks caused by PTEN deletion. (F) CldU tract lengths in PTEN+/+ and PTEN−/− HCT116 cells upon HU treatment. CldU tracts represent continuous tracts formed during HU treatment. (G) Gap lengths between IdU tracts prior to HU treatment and CldU tracts after HU treatment in PTEN+/+ and PTEN−/− HCT116 cells. Gap lengths indicate the efficiency of blocking the restart. (H) Diagram of gap lengths between IdU tracts before HU treatment and CldU tracts after HU treatment (leading strand) and CldU tract lengths with HU treatment (lagging strand) showing there is asymmetric replication fork movement in PTEN−/− HCT116 cells. (I) Chromosomal aberrations measured by metaphase chromosome spreads in PTEN+/+ HCT116 and PTEN−/− HCT116 cells with or without HU treatment. Representative images of chromosomal aberrations in metaphase chromosomes are shown. Cells with PTEN deletion show genomic instability under replication stress. All data are presented as means ± SEM and analyzed by unpaired t-test. **P< 0.01**P< 0.001.
Figure 2
Figure 2
PTEN binds to RPA1 C-terminus and is located at DNA replication sites. (A) In vivo S-tag pull-down analysis. Whole cell extracts from 293T cells transfected with S-tagged-PTEN, S-tagged-RPA1, or S-tagged-mock were immunoprecipitated with s-protein beads followed by mass spectrometric peptide sequencing. Both RPA1 and PTEN were found in reciprocal pull-down assays. OTUB1 was found in the PTEN and RPA1 pull-down lists. (B) In vivo binding of PTEN and RPA1. PTEN physically associates with RPA1. Lysates of HCT116 cells were immunoprecipitated with an anti-PTEN monoclonal antibody and subjected to western blotting with an anti-RPA1 antibody. (C) Reciprocal examination of the physical interaction between PTEN and RPA1. RPA1 immunoprecipitates were subjected to western blotting using anti-PTEN antibody. (D) Comparison of conventional (EPI) and STORM images of co-localization of DNA replication sites and PTEN with or without HU treatment (d3 and d4). More specific views are shown in Supplementary information, Figure S2B. STORM images of replication sites with PCNA (without HU treatment; d1) and RPA1 (with HU treatment; d2) are shown as positive control. (E, F) In vivo S-tag pull-down analysis for mapping the PTEN binding domain of RPA1. Different domains of RPA1 with S-tag were used for in vivo binding assays with Flag-tagged full-length PTEN. Various RPA1 domains are shown in the diagram (E). PTEN binds to the RPA1 C-terminal region.
Figure 3
Figure 3
RPA1 is a target of PTEN function in fork protection. (A) IdU tract lengths in RPA1+/+ and RPA1+/− HCT116 cells with or without HU treatment. IdU tracts in RPA1+/− HCT116 cells show significant strand shortening with HU treatment as compared with RPA1+/+ HCT116 cells. (B) IdU tracts in RPA1+/+ and RPA1+/− HCT116 cells with differing exposure times to HU. (C) Chromosomal aberrations measured by metaphase chromosome spreads from RPA1+/+ HCT116 and RPA1+/− HCT116 cells with HU treatment (± SD, n = 40). Representative images of chromosomal aberrations of metaphase chromosomes are shown. RPA1 TALEN heterozygous knockout cells show genomic instability under replication stress. (D) Measurement of IdU tract lengths in PTEN−/− HCT116 cells transfected with S-tagged-RPA1 or S-tagged-mock with or without HU. RPA1 overexpression partially rescues insufficiently protected DNA replication forks caused by PTEN deletion. (E) Chromosomal aberrations measured by metaphase chromosome spreads from PTEN−/− HCT116 cells transfected with S-tagged-RPA1 or S-tagged-mock with HU treatment. RPA1 overexpression rescues genomic instability caused by PTEN deletion under replication stress. All data are presented as means ± SEM and analyzed by unpaired t-test. **P< 0.01**P< 0.001.
Figure 4
Figure 4
PTEN promotes RPA1 protein stability by binding and recruiting OTUB1. (A) In vivo ubiquitination assay of RPA1. PTEN+/+ and PTEN−/− HCT116 cells were co-transfected with Flag-RPA1, His-HA-ubiquitin and GFP, pulled down with Ni-beads and immunoblotted with an antibody against Flag and other antibodies as indicated. Cells were treated with MG132 (10 μM) for 12 h before collection. (B) Half-life analysis of RPA1. PTEN+/+ and PTEN−/− HCT116 cells were treated with 100 μg/ml CHX, collected at different time points and immunoblotted with antibodies against RPA1, PTEN or β-actin. Graph shows quantification of RPA1 protein levels. RPA1 protein half-life was shortened in PTEN deficient cells. (C) Chromatin fraction analysis in PTEN+/+ and PTEN−/− HCT116 cells with or without HU treatment. Asynchronized (Asyn) or HU-treated PTEN+/+ and PTEN−/− HCT116 cells were subjected to fractionation. Soluble (sol) and chromatin (chr) fractions were separated and immunoblotted with indicated antibodies. (D) Exogenous binding of PTEN, RPA1 and OTUB1. S-tagged-OUTB1 co-transfected with Flag-RPA1, Flag-PTEN, or both, or Flag-mock was pulled-down with s-protein beads. A Flag specific antibody was used to detect exogenous RPA1 and PTEN. (E) Examination of physical interaction of PTEN, RPA1, and OTUB1. OTUB1 immunoprecipitates were subjected to western blotting using anti-PTEN and anti-RPA1 antibodies. (F) In vitro binding assay examining PTEN's interaction with His-tagged-RPA1 and His-tagged-OTUB1 and both. (G) In vitro binding assay with GST-tagged full-length PTEN, various GST-tagged PTEN domains and His-tagged-OTUB1. PTEN binds to OTUB1 with its C2 domain. (H) Illustration of in silico docking analysis of the PTEN/OTUB1/RPA complex to within a distance of 3.0 Å. PTEN is represented by cyan, RPA by salmon and OTUB1 by yellow. (I) In vivo binding of OTUB1 and RPA1 in PTEN+/+ and PTEN−/− HCT116 cells. OTUB1 immunoprecipitates in PTEN+/+ and PTEN−/− HCT116 cells were subjected to western blotting using an anti-RPA1 antibody. (J) Half-life analysis of RPA1 protein. OTUB1+/+ and OTUB1−/− HCT116 cells were treated with 100 μg/ml CHX, collected at different time points and immunoblotted with antibodies against RPA1, OTUB1, and β-actin. Graph shows quantification of RPA1 protein levels. RPA1 protein expression is decreased and its half-life shortened in OTUB1 null cells. (K) In vivo ubiquitination assay of RPA1. OTUB1+/+ and OTUB1−/− HCT116 cells were co-transfected with Flag-RPA1, His-HA-ubiquitin and GFP, pulled-down with Ni-beads and immunoblotted with antibody against Flag and other antibodies as indicated. Cells were treated with MG132 for 12 h before collection. (L) IdU tract lengths in OTUB1+/+ and OTUB1−/− HCT116 cells with or without HU treatment. IdU tracts measured in OTUB1−/− HCT116 cells show significant strand shortening with HU treatment as compared with those in OTUB1+/+ HCT116 cells. Data are presented as means ± SEM and analyzed by unpaired t-test. ***P< 0.001.
Figure 5
Figure 5
RPA1 is important for suppression of colorectal carcinoma. (A) Immunohistochemical staining of PTEN and RPA1 in representative colon carcinoma specimens and matched normal colon specimens. Staining (brown) represents positive immunoreactivity. Scale bars, 50 μm. (B, C) PTEN (B) and RPA1 (C) protein expression status in normal colon and colon carcinoma specimens. (D) Correlation of PTEN and RPA1 protein levels in human colon cancers. Statistical significance in B-D was determined with the χ2-test. R is the correlation coefficient. (E) Schematic diagram of strategy for conditional knockout of murine Rpa1. (F) Sketch outlining the AOM/DSS-induced CRC model. Rpa1+/+ and Rpa1+/ mice were treated with or without AOM, which was given once, followed by periodic administration of DSS in water. n = 7 per group. (G-L) Following euthanasia, macroscopic (G) and microscopic (L) analyses of tumor were conducted. Scale bars, 100 μm. Statistical analyses of numbers of tumors (multiplicity, H), numbers of tumors > 3 mm (I), tumor volume (load, J) and average size (K) in two groups.

Comment on

Similar articles

Cited by

References

    1. 1Aguilera A, Gomez-Gonzalez B. Genome instability: a mechanistic view of its causes and consequences. Nat Rev Genet 2008; 9:204–217. - PubMed
    1. 2Branzei D, Foiani M. Maintaining genome stability at the replication fork. Nat Rev Mol Cell Biol 2010; 11:208–219. - PubMed
    1. 3Cimprich MKZaKA. Causes and consequences of replication stress. Nat Cell Biol 2014; 16:2–9. - PMC - PubMed
    1. 4Negrini S, Gorgoulis VG, Halazonetis TD. Genomic instability--an evolving hallmark of cancer. Nat Rev Mol Cell Biol 2010; 11:220–228. - PubMed
    1. 5Biankin AV, Waddell N, Kassahn KS, et al. Pancreatic cancer genomes reveal aberrations in axon guidance pathway genes. Nature 2012; 491:399–405. - PMC - PubMed

Publication types

Substances