. 2015 Sep 25:5:14546.
doi: 10.1038/srep14546.

Many Atolls May be Uninhabitable Within Decades Due to Climate Change

Affiliations

Many Atolls May be Uninhabitable Within Decades Due to Climate Change

Curt D Storlazzi et al. Sci Rep. .

Abstract

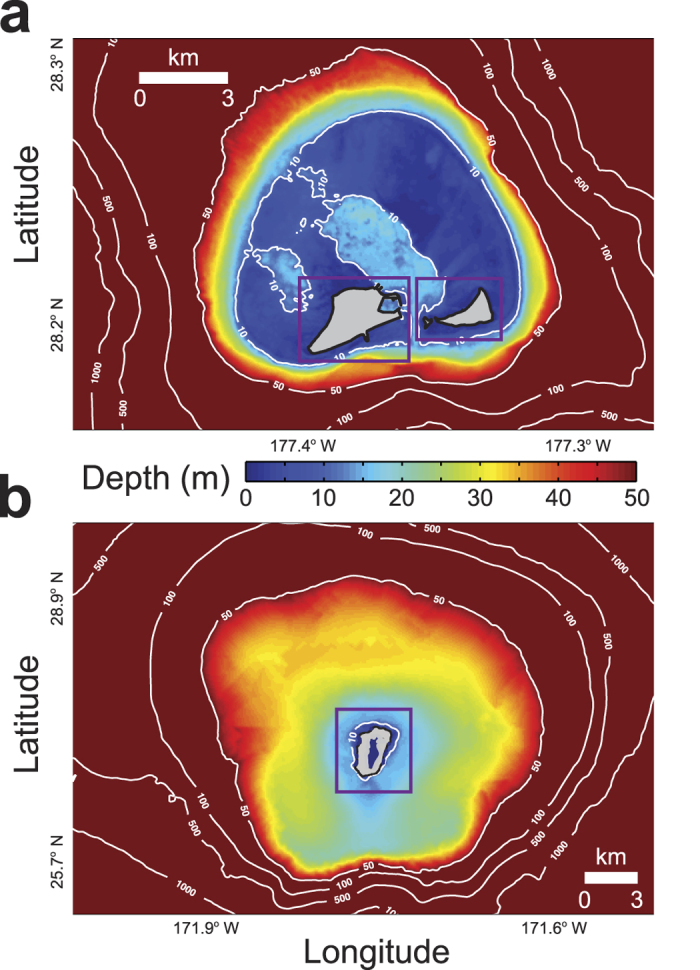
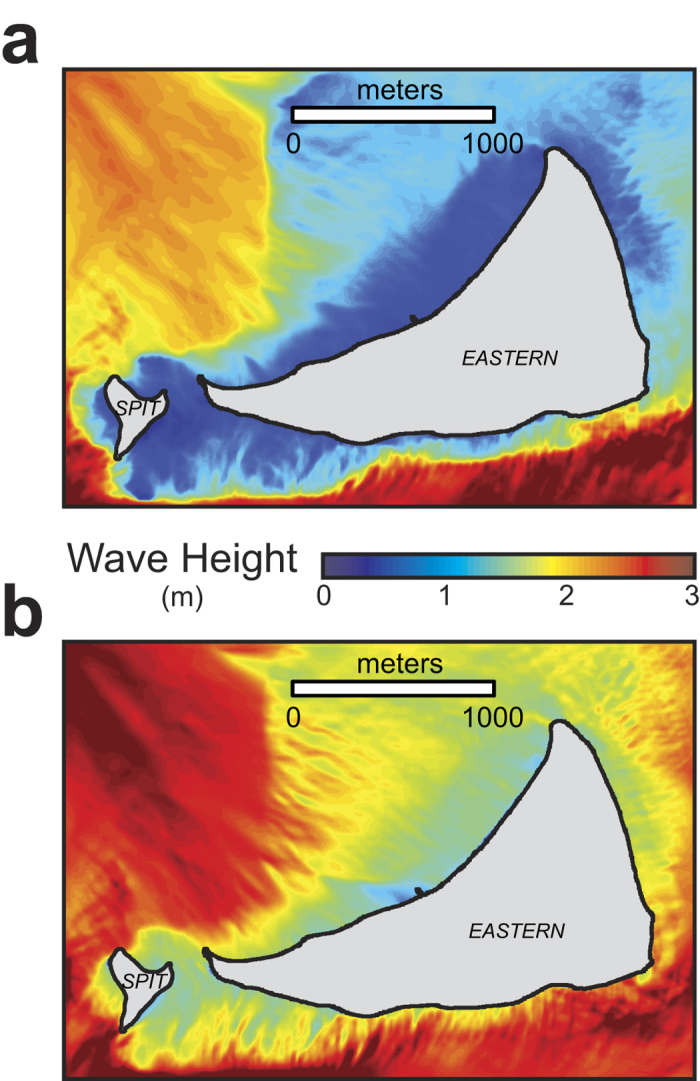
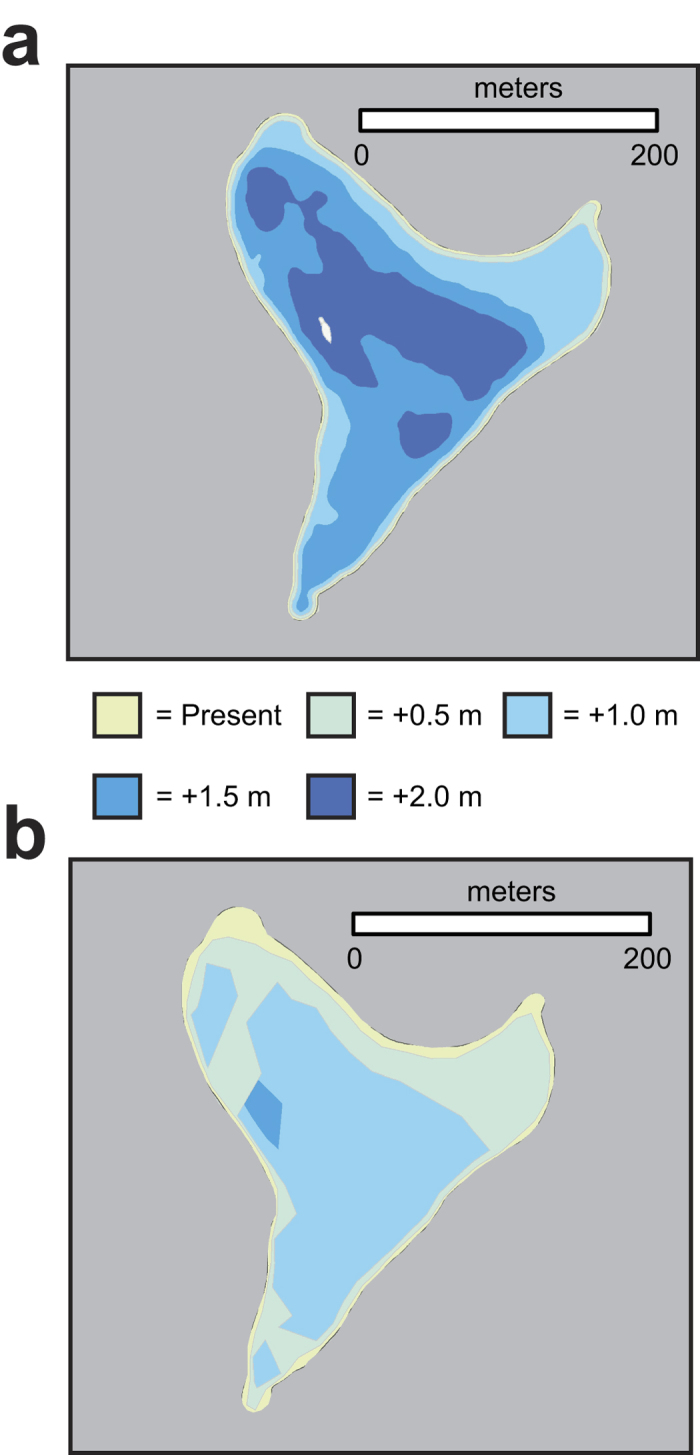
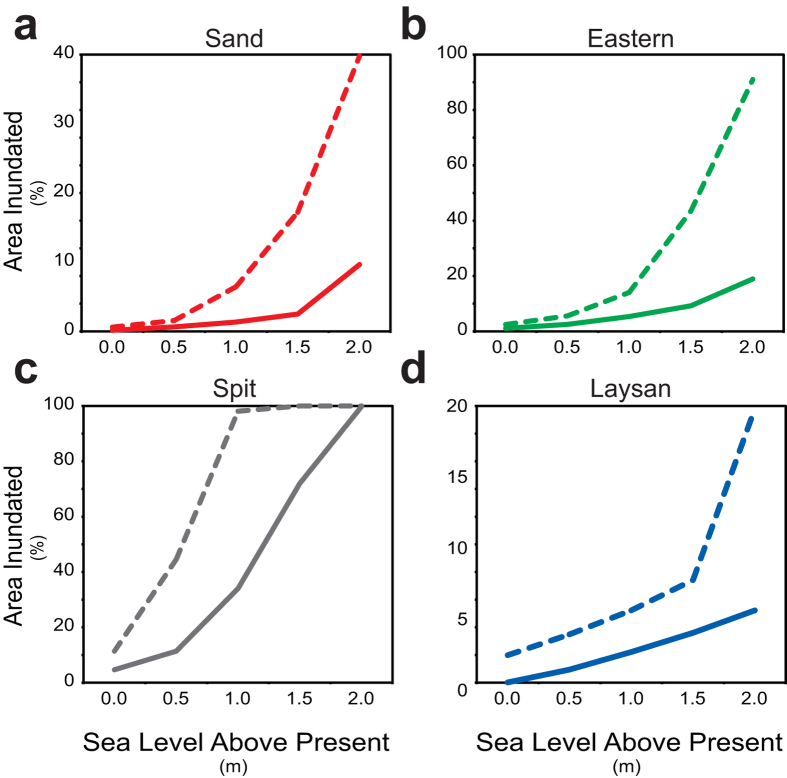
Observations show global sea level is rising due to climate change, with the highest rates in the tropical Pacific Ocean where many of the world's low-lying atolls are located. Sea-level rise is particularly critical for low-lying carbonate reef-lined atoll islands; these islands have limited land and water available for human habitation, water and food sources, and ecosystems that are vulnerable to inundation from sea-level rise. Here we demonstrate that sea-level rise will result in larger waves and higher wave-driven water levels along atoll islands' shorelines than at present. Numerical model results reveal waves will synergistically interact with sea-level rise, causing twice as much land forecast to be flooded for a given value of sea-level rise than currently predicted by current models that do not take wave-driven water levels into account. Atolls with islands close to the shallow reef crest are more likely to be subjected to greater wave-induced run-up and flooding due to sea-level rise than those with deeper reef crests farther from the islands' shorelines. It appears that many atoll islands will be flooded annually, salinizing the limited freshwater resources and thus likely forcing inhabitants to abandon their islands in decades, not centuries, as previously thought.


Figures

Figure 1
Figure 1. Maps showing the morphology of Midway and Laysan, Northwestern Hawaiian Islands, in the atoll-wide model grids and the smaller, finer-resolution island grids (purple boxes).
(a) Midway. (b) Laysan. The 10 m, 50 m, 100 m, 500 m, and 1,000 m isobaths are labeled. Midway is characterized by islands on a shallow atoll rim and a central lagoon; Laysan, however, has a deep rim with an island in the center.
Figure 2
Figure 2. Map of modeled wave height around Eastern Island during North Pacific winter conditions.
(a) Present sea level. (b) Sea level +2.0 m above present. Most reef crests and reef flats are depth-limited for waves, in that wave heights are limited to a fraction of the water depth. Thus, as water depth increases with sea-level rise over the islands’ reef flats, it allows for more deep-water wave energy to propagate onto the reef flats and more in situ wind-wave development on the reef flats.
Figure 3
Figure 3. Mean changes (±1 SD) in wave parameters and the resulting wave-driven water levels around the four islands for the four sea-level-rise scenarios relative to present sea level during end-member forcing conditions.
(a) Wave height during North Pacific winter conditions. (b) Wave height during North Pacific summer conditions. (c) Wavelength during North Pacific winter conditions. (d) Wavelength during North Pacific summer conditions. (e) Run-up during North Pacific winter conditions. (f) Run-up during North Pacific summer conditions. N = 3321, 416, 1086, and 257 for Sand, Spit, Eastern, and Laysan, respectively. Wave height and length increase with sea-level rise due to reduced wave breaking and hydrodynamic roughness relative to water depth. The increases in wave height and wavelength result in much greater run-up at higher sea levels.
Figure 4
Figure 4. Maps of inundation or flooding limits at Spit Island for the four sea-level-rise scenarios relative to present sea level showing the differing results from the two types of models.
(a) Passive inundation modeling. (b) Dynamic wave-driven flood modeling. The passive models predict less than 1% of Spit Island remain dry at with 2.0 m of sea-level rise. The dynamic models, however, predict a similar extent of impact with 1.0 m of sea-level rise and for the entire island to be flooded multiple times annually with 1.5 m of sea-level rise.
Figure 5
Figure 5. Differences in the percentage of land area on the four islands projected by passive modeling to be inundated (solid lines) versus that flooded by dynamic modeling (dashed lines) for the four sea-level rise scenarios relative to present sea level.
(a) Sand Island. (b) Eastern Island. (c) Spit Island. (d) Laysan Island. The dynamic models that include wave-driven water levels forecast much greater impact for a given water level, or sooner in the future, than passive models.

References

    1. Vermeer M. & Rahmstorf S. Global sea level linked to global temperature. Proc Natl Acad Sci 106, 21527–21532 (2009). - PMC - PubMed
    1. Merrifield M. A., Merrifield S. T. & Mitchum G. T. An anomalous recent acceleration of global sea-level rise. J Clim 22, 5772–5781 (2009).
    1. Jevrejeva S., Grinsted A. & Moore J. C. Anthropogenic forcing dominates sea-level rise since 1850. Geophys Res Lett 36, L20706 (2009).
    1. Milne G. A., Gehrels W. R., Hughes C. W. & Tamisiea M. E. Identifying the causes of sea-level change. Nat Geosci 2, 471–478 (2009).
    1. Grinsted A., Moore J. C. & Jevrejeva S. Reconstructing sea level from paleo and projected temperatures 200 to 2100 AD. Clim Dynam 34, 461–472 (2009).

Publication types