

doi: 10.1186/s13059-015-0764-4.
Metassembler: merging and optimizing de novo genome assemblies
Affiliations
- PMID: 26403281
- PMCID: PMC4581417
- DOI: 10.1186/s13059-015-0764-4
Item in Clipboard
Metassembler: merging and optimizing de novo genome assemblies
Genome Biol.
.
Abstract
Genome assembly projects typically run multiple algorithms in an attempt to find the single best assembly, although those assemblies often have complementary, if untapped, strengths and weaknesses. We present our metassembler algorithm that merges multiple assemblies of a genome into a single superior sequence. We apply it to the four genomes from the Assemblathon competitions and show it consistently and substantially improves the contiguity and quality of each assembly. We also develop guidelines for meta-assembly by systematically evaluating 120 permutations of merging the top 5 assemblies of the first Assemblathon competition. The software is open-source at http://metassembler.sourceforge.net .
Figures

Assemblathon 1 metassembly accuracy. Assembly contiguity and accuracy metrics are plotted at each merging step for all possible permutations of the five input assemblies: scaffold N50 (a), corrected contig N50 (b), duplicated reference bases (c), deleted reference bases (d), translocations (e), and relocations (f). For all plots, the x-axis represents the number of input assemblies being metassembled, with 1 being the starting assembly. The two horizontal red lines mark the final maximum and minimum value of the metric across all permutations. Most of the permutations are plotted in gray, while permutations of particular note are plotted with different colors: the pink line represents the permutation that has the maximum value in the final metassembly while the dark blue line represents the permutation with the minimum value. Also, the green line represents the permutation resulting from ordering the input assemblies by the overall rank reported in the Assemblathon 1 paper (Broad-BGI-WTSI-DOEJGI-CSHL), the light blue line represents the permutation obtained by ordering the input assemblies by scaffold N50 size (DOEJGI-Broad-WTSI-CSHL-BGI) while the brown line represents the order by contig N50 size (BGI-Broad-CSHL-WTSI-DOEJGI). Comp Ref Bases compressed reference bases, Dup Ref Bases duplicated reference bases
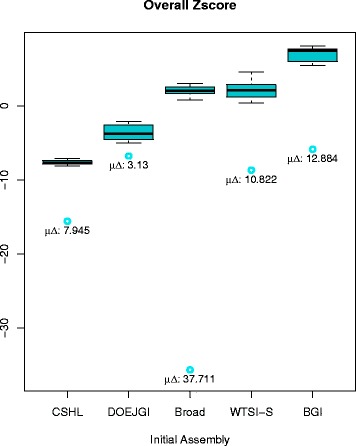
Boxplots of overall Z scores for Assemblathon 1 metassemblies grouped by initial assembly. Blue circles indicate the Z score of the corresponding initial assembly. Below each circle, the corresponding mean difference in Z scores between the final metassembly and the initial assembly (μ∆) is shown. The global mean difference is also shown at the top

Assemblathon 2 metassembly contiguity and accuracy metrics. Assembly contiguity and accuracy metrics are shown at each merging step of all metassemblies for the three species. The x-axis represents the number of assemblies merged with one being the initial input assembly. Ctg contig, Scf scaffold

Metassembly of fish BCM scaffold FISH00033861. A representation of the changes made to a single scaffold throughout the metassembler pipeline is shown. Scaffold FISH00033861 of the BCM fish assembly (bottom) is taken as the starting point in the metassembly corresponding to the Assemblathon 2 Z score ordering. Vertical blue and green lines represent indel corrections and gap closures made at each merging step

Schematic representation of the pairwise merging process. Dark color represents alignment blocks between the primary and secondary assemblies. Light color represents unaligned sequences. 1) For blocks of aligned sequence, the algorithm inserts the primary sequence to the new metassembly. 2) Insertion in the primary with respect to the secondary assembly: because the CE statistic is a large positive value (>3) for the primary sequence, the algorithm skips the primary insertion and chooses the secondary sequence instead. 3) Both assemblies have an unaligned insertion: because the primary insertion is shorter than the secondary insertion, and because the primary has a large negative CE statistic (< −3), the algorithm will choose the secondary insertion over the primary, thus correcting the CE statistic

Schematic diagram of the progressive metassembly of three assemblies. All three input assemblies have gap sequences and a variety of errors such that no pair of assemblies will create a perfect assembly. However, the final metassembly of all three assemblies together will reconstruct the entire correct genome. Gap Seq gap sequence, Scf scaffold
Similar articles
-
A comparative evaluation of genome assembly reconciliation tools.Genome Biol. 2017 May 18;18(1):93. doi: 10.1186/s13059-017-1213-3. Genome Biol. 2017. PMID: 28521789 Free PMC article.
-
The complex task of choosing a de novo assembly: lessons from fungal genomes.Comput Biol Chem. 2014 Dec;53 Pt A:97-107. doi: 10.1016/j.compbiolchem.2014.08.014. Epub 2014 Aug 29. Comput Biol Chem. 2014. PMID: 25262360
-
Contiguous and accurate de novo assembly of metazoan genomes with modest long read coverage.Nucleic Acids Res. 2016 Nov 2;44(19):e147. doi: 10.1093/nar/gkw654. Epub 2016 Jul 25. Nucleic Acids Res. 2016. PMID: 27458204 Free PMC article.
-
Advances in plant genome sequencing.Plant J. 2012 Apr;70(1):177-90. doi: 10.1111/j.1365-313X.2012.04894.x. Plant J. 2012. PMID: 22449051 Review.
-
[Transcript assembly and quality assessment].Sheng Wu Gong Cheng Xue Bao. 2015 Sep;31(9):1271-8. Sheng Wu Gong Cheng Xue Bao. 2015. PMID: 26955705 Review. Chinese.
Cited by
-
Droplet barcoding for massively parallel single-molecule deep sequencing.Nat Commun. 2016 Jun 29;7:11784. doi: 10.1038/ncomms11784. Nat Commun. 2016. PMID: 27353563 Free PMC article.
-
Evolutionary superscaffolding and chromosome anchoring to improve Anopheles genome assemblies.BMC Biol. 2020 Jan 2;18(1):1. doi: 10.1186/s12915-019-0728-3. BMC Biol. 2020. PMID: 31898513 Free PMC article.
-
Optimizing depth and type of high-throughput sequencing data for microsatellite discovery.Appl Plant Sci. 2019 Nov 3;7(11):e11298. doi: 10.1002/aps3.11298. eCollection 2019 Nov. Appl Plant Sci. 2019. PMID: 31832281 Free PMC article.
-
A comparative evaluation of genome assembly reconciliation tools.Genome Biol. 2017 May 18;18(1):93. doi: 10.1186/s13059-017-1213-3. Genome Biol. 2017. PMID: 28521789 Free PMC article.
-
Refinement of Draft Genome Assemblies of Pigeonpea (Cajanus cajan).Front Genet. 2020 Dec 15;11:607432. doi: 10.3389/fgene.2020.607432. eCollection 2020. Front Genet. 2020. PMID: 33384719 Free PMC article.
References
Publication types
MeSH terms
Grants and funding
LinkOut - more resources
Full Text Sources
Other Literature Sources
