

Latitudinal variation of leaf stomatal traits from species to community level in forests: linkage with ecosystem productivity
- PMID: 26403303
- PMCID: PMC4585881
- DOI: 10.1038/srep14454
Latitudinal variation of leaf stomatal traits from species to community level in forests: linkage with ecosystem productivity
Abstract
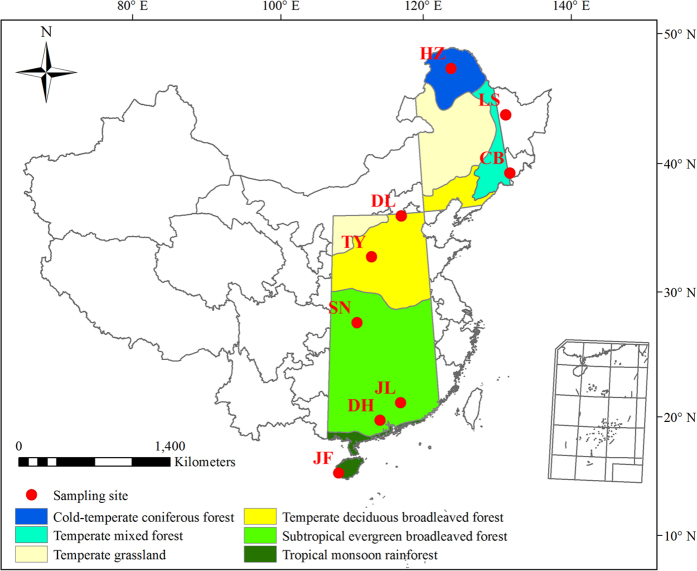
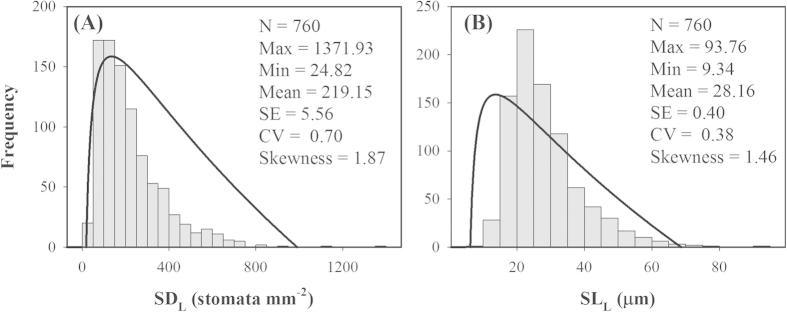
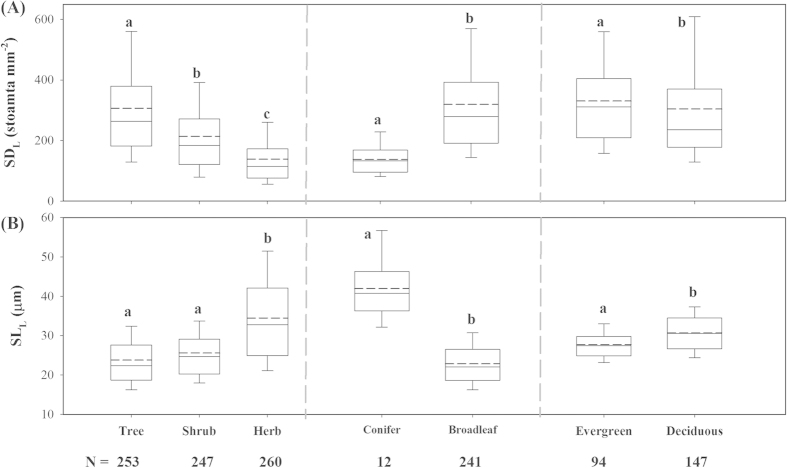
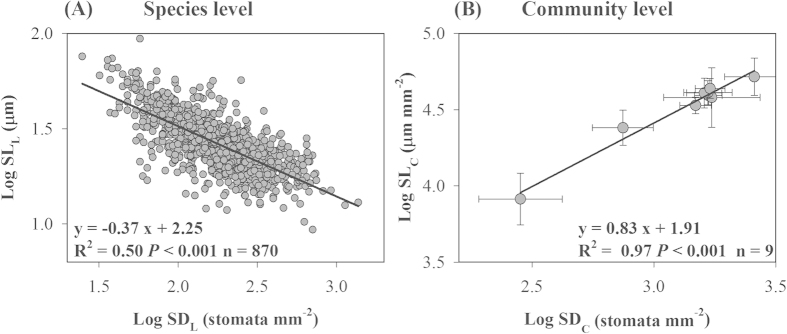
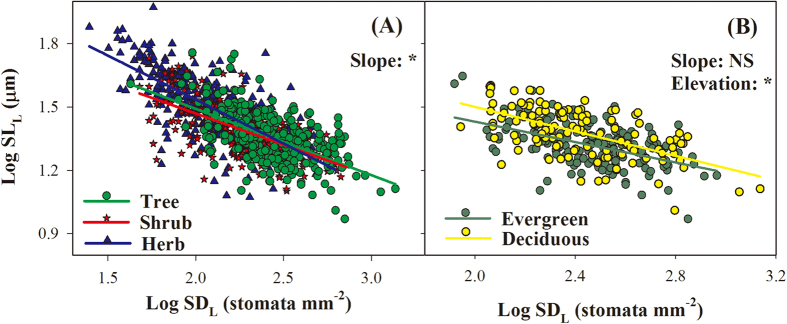
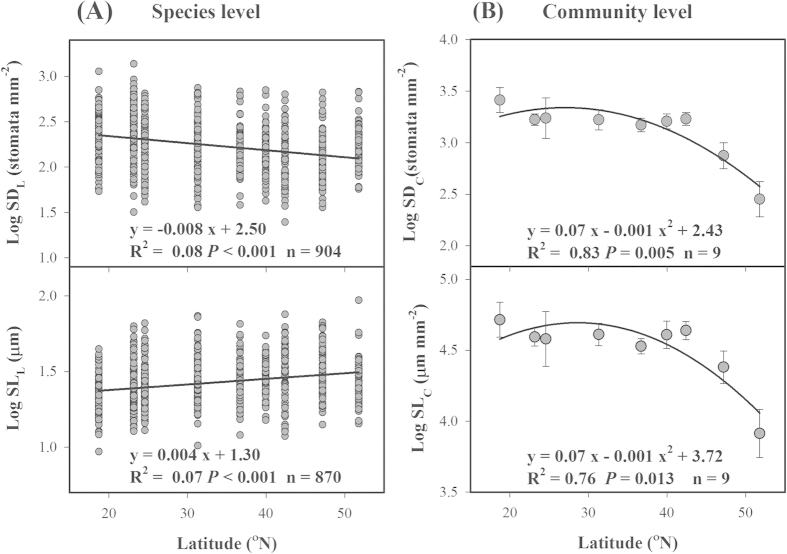
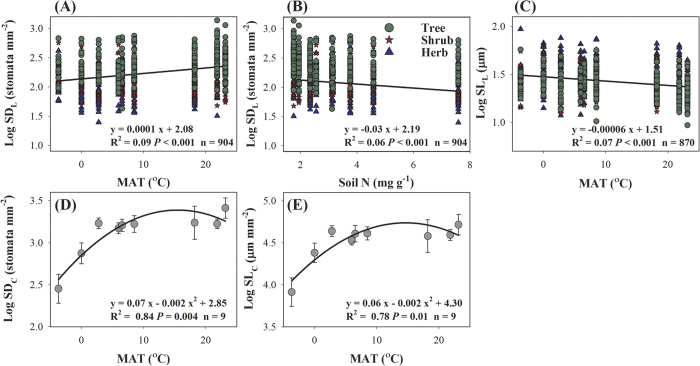
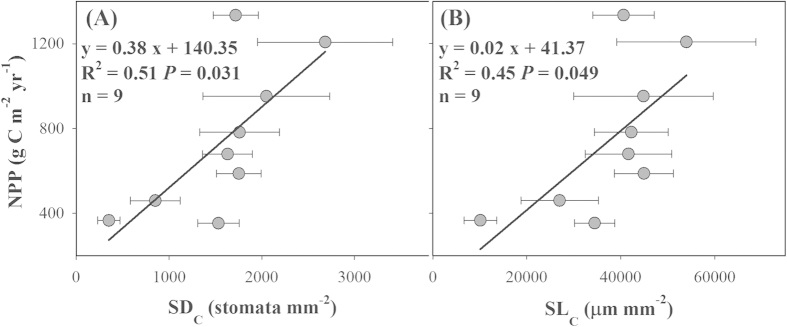
To explore the latitudinal variation of stomatal traits from species to community level and their linkage with net primary productivity (NPP), we investigated leaf stomatal density (SDL) and stomatal length (SLL) across 760 species from nine forest ecosystems in eastern China, and calculated the community-level SD (SDC) and SL (SLC) through species-specific leaf area index (LAI). Our results showed that latitudinal variation in species-level SDL and SLL was minimal, but community-level SDC and SLC decreased clearly with increasing latitude. The relationship between SD and SL was negative across species and different plant functional types (PFTs), but positive at the community level. Furthermore, community-level SDC correlated positively with forest NPP, and explained 51% of the variation in NPP. These findings indicate that the trade-off by regulating SDL and SLL may be an important strategy for plant individuals to adapt to environmental changes, and temperature acts as the main factor influencing community-level stomatal traits through alteration of species composition. Importantly, our findings provide new insight into the relationship between plant traits and ecosystem function.
Figures
Similar articles
-
Elevation-related variation in leaf stomatal traits as a function of plant functional type: evidence from Changbai Mountain, China.PLoS One. 2014 Dec 17;9(12):e115395. doi: 10.1371/journal.pone.0115395. eCollection 2014. PLoS One. 2014. PMID: 25517967 Free PMC article.
-
Leaf morphological and anatomical traits from tropical to temperate coniferous forests: Mechanisms and influencing factors.Sci Rep. 2016 Jan 22;6:19703. doi: 10.1038/srep19703. Sci Rep. 2016. PMID: 26796339 Free PMC article.
-
Leaf Caloric Value from Tropical to Cold-Temperate Forests: Latitudinal Patterns and Linkage to Productivity.PLoS One. 2016 Jun 24;11(6):e0157935. doi: 10.1371/journal.pone.0157935. eCollection 2016. PLoS One. 2016. PMID: 27341474 Free PMC article.
-
Association genetics, geography and ecophysiology link stomatal patterning in Populus trichocarpa with carbon gain and disease resistance trade-offs.Mol Ecol. 2014 Dec;23(23):5771-90. doi: 10.1111/mec.12969. Epub 2014 Nov 8. Mol Ecol. 2014. PMID: 25319679
-
Predicting ecosystem productivity based on plant community traits.Trends Plant Sci. 2023 Jan;28(1):43-53. doi: 10.1016/j.tplants.2022.08.015. Epub 2022 Sep 14. Trends Plant Sci. 2023. PMID: 36115777 Review.
Cited by
-
Optimal Community Assembly Related to Leaf Economic- Hydraulic-Anatomical Traits.Front Plant Sci. 2020 Mar 25;11:341. doi: 10.3389/fpls.2020.00341. eCollection 2020. Front Plant Sci. 2020. PMID: 32269584 Free PMC article.
-
Trait-based plant ecology a flawed tool in climate studies? The leaf traits of wild olive that pattern with climate are not those routinely measured.PLoS One. 2019 Jul 17;14(7):e0219908. doi: 10.1371/journal.pone.0219908. eCollection 2019. PLoS One. 2019. PMID: 31314789 Free PMC article.
-
From leaf to label: A robust automated workflow for stomata detection.Ecol Evol. 2020 Aug 19;10(17):9178-9191. doi: 10.1002/ece3.6571. eCollection 2020 Sep. Ecol Evol. 2020. PMID: 32953053 Free PMC article.
-
Plant identity and shallow soil moisture are primary drivers of stomatal conductance in the savannas of Kruger National Park.PLoS One. 2018 Jan 26;13(1):e0191396. doi: 10.1371/journal.pone.0191396. eCollection 2018. PLoS One. 2018. PMID: 29373605 Free PMC article.
-
Environmental pressures on stomatal size may drive plant genome size evolution: evidence from a natural experiment with Cape geophytes.Ann Bot. 2020 Jul 24;126(2):323-330. doi: 10.1093/aob/mcaa095. Ann Bot. 2020. PMID: 32474609 Free PMC article.
References
-
- Suding K. N. et al. Scaling environmental change through the community-level: a trait-based response-and-effect framework for plants. Global Change Biol. 14, 1125–1140 (2008).
-
- Chapin F. S. III, Matson P. A. & Mooney H. A. Principles of terrestrial ecosystem ecology (Springer, New York, 2002).
-
- Garnier E. & Navas M. L. A trait-based approach to comparative functional plant ecology: concepts, methods and applications for agroecology. A review. Agron. Sustain. Dev. 32, 365–399 (2012).
Publication types
MeSH terms
LinkOut - more resources
Full Text Sources
Other Literature Sources
