

Comparison of CT number calibration techniques for CBCT-based dose calculation
- PMID: 26403913
- PMCID: PMC4656712
- DOI: 10.1007/s00066-015-0890-7
Comparison of CT number calibration techniques for CBCT-based dose calculation
Abstract
Purpose: The aim of this work was to compare and validate various computed tomography (CT) number calibration techniques with respect to cone beam CT (CBCT) dose calculation accuracy.
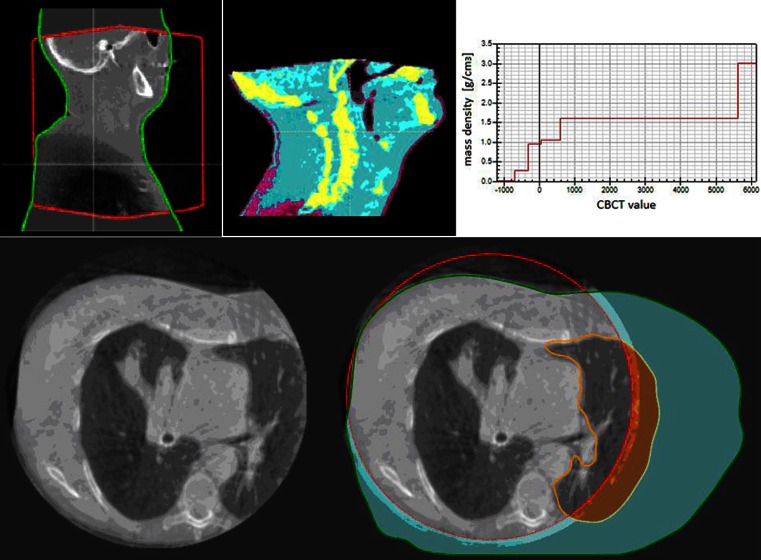
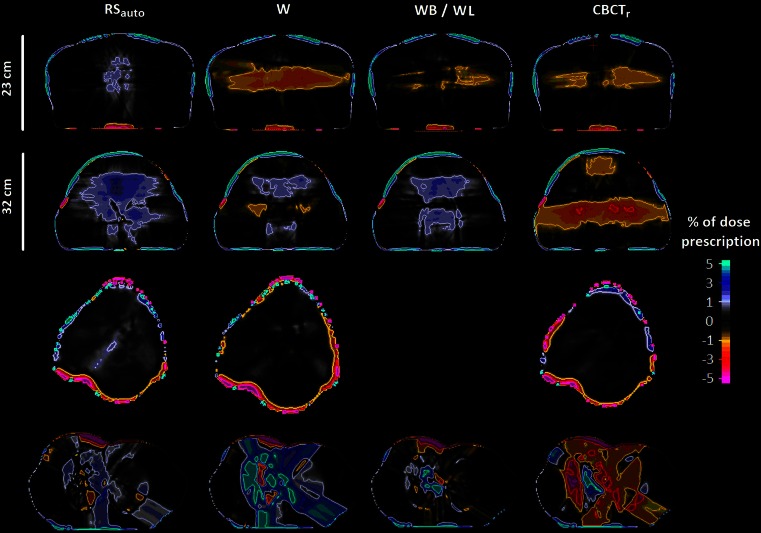
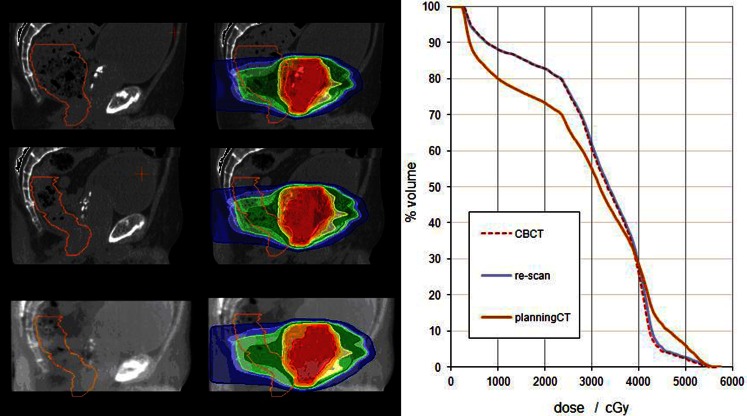
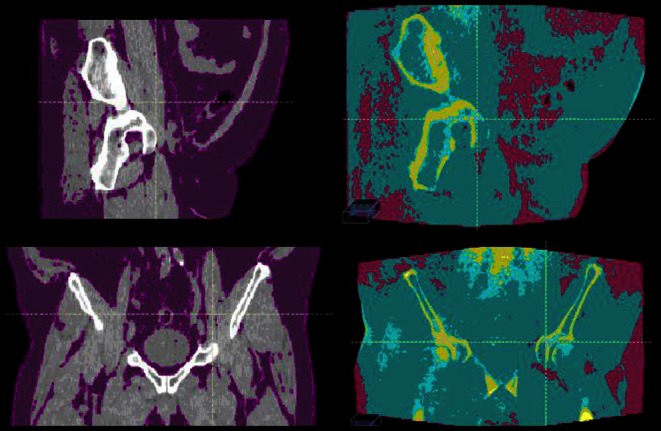
Methods: CBCT dose calculation accuracy was assessed for pelvic, lung, and head and neck (H&N) treatment sites for two approaches: (1) physics-based scatter correction methods (CBCTr); (2) density override approaches including assigning water density to the entire CBCT (W), assignment of either water or bone density (WB), and assignment of either water or lung density (WL). Methods for CBCT density assignment within a commercially available treatment planning system (RSauto), where CBCT voxels are binned into six density levels, were assessed and validated. Dose-difference maps and dose-volume statistics were used to compare the CBCT dose distributions with the ground truth of a planning CT acquired the same day as the CBCT.
Results: For pelvic cases, all CTN calibration methods resulted in average dose-volume deviations below 1.5 %. RSauto provided larger than average errors for pelvic treatments for patients with large amounts of adipose tissue. For H&N cases, all CTN calibration methods resulted in average dose-volume differences below 1.0 % with CBCTr (0.5 %) and RSauto (0.6 %) performing best. For lung cases, WL and RSauto methods generated dose distributions most similar to the ground truth.
Conclusion: The RSauto density override approach is an attractive option for CTN adjustments for a variety of anatomical sites. RSauto methods were validated, resulting in dose calculations that were consistent with those calculated on diagnostic-quality CT images, for CBCT images acquired of the lung, for patients receiving pelvic RT in cases without excess adipose tissue, and for H&N cases.
Ziel: Ziel dieser Arbeit ist der Vergleich und die Validierung mehrerer CT-Kalibrierungsmethoden zur Dosisberechnung auf der Grundlage von Kegelstrahlcomputertomographie(CBCT)-Aufnahmen.
Methoden: Bei 4 Becken-, 3 Lungen- und 4 Kopf-Hals-Patienten wurde die Genauigkeit der Dosisberechnung auf der Basis von CBCT-Aufnahmen für die folgenden Ansätze untersucht: einerseits Rekonstruktion der CBCT-Aufnahmen mithilfe eines Streukorrekturalgorithmus (CBCTr) und andererseits 3 verschiedene Methoden zur expliziten Zuweisung der Elektronendichten auf Basis des CBCT-Datensatzes (W: Zuordnung von Wasserdichte auf dem gesamten CBCT, WB: Zuordnung von entweder Wasser- oder Knochendichte, WL: Zuordnung von entweder Wasser- oder Lungendichte) sowie der in einem kommerziellen Planungssystem implementierten Methode der automatischen Zuordnung von 6 Dichtestufen auf Basis der CBCT-Hounsfield-Werte (RSauto). Als Grundlage zur Evaluierung der Methoden diente die Dosisverteilung, welche anhand einer am gleichen Tag wie die CBCT aufgenommenen Planungs-CT berechnet wurde. Die Genauigkeit der einzelnen Ansätze wurde anhand von Dosis-Volumen-Statistiken und lokalen Dosisunterschieden beurteilt.
Ergebnisse: Bei den Datensätzen mit Tumoren im Beckenbereich ist die mittlere Dosisabweichung für alle Kalibrierungsmethoden unter 1,5 %, wobei RSauto in einer überdurchschnittlichen Abweichung für Patienten mit einem höheren Anteil von Fettgewebe resultiert. Die mittlere Abweichung für Kopf-Hals-Patienten beträgt unter 1,0 %, wobei CBCTr (0,5 %) und RSauto (0,6 %) am besten abschneiden. WL und RSauto resultieren für die Patienten mit Lungentumoren in Dosisverteilungen, welche der Referenzdosisverteilung entsprechen.
Schlussfolgerung: RSauto zur Kalibrierung von CBCT-Aufnahmen zur Dosisberechnung ist eine aussichtsreiche Methode für die untersuchten Indikationen. Es wurde gezeigt, dass mithilfe von RSauto die Dosisberechnung auf der Basis von CBCT-Aufnahmen von Lungen- und Kopf-Hals-Erkrankungen sowie für Tumoren im Beckenbereich bei Patienten ohne ein Übermaß an Fettgewebe in einer akkuraten Dosisverteilung resultiert.
Keywords: Adaptive radiation therapy, ART; Cone beam computed tomography; Density; Dose calculation; Hounsfield units.
Conflict of interest statement
A. Dunlop reports grants from NIHR Biomedical Research Centre and grants from Cancer Research UK C7224/A13407. D. McQuaid reports grants from NIHR Biomedical Research Centre and grants from Cancer Research UK C7224/A13407. J. Murray states that there are no conflicts of interest. K. Newbold has received honoraria for advisory roles for Genzyme, Astra Zeneca, and Eisai. S. Nill reports grants from NIHR Biomedical Research Centre, grants from Cancer Research UK Programme Grant C33589/A19727, during the conduct of the study. V.N. Hansen states that there are no conflicts of interest. C. Nutting reports grants from Cancer Research UK C7224/A13407. G. Poludniowski states that there are no conflicts of interest. K. Harrington reports grants from NIHR Biomedical Research Centre, grants from Cancer Research UK C7224/A13407, during the study, and outside the submitted work, grants from Merck, from Cellgene, from Oncolytics Biotech, and from Genelux Corporation. S. Bhide states that there are no conflicts of interest. U. Oelfke reports grants from NIHR Biomedical Research Centre, grants from Cancer Research UK Programme Grant C33589/A19727, and grants from EPSRC Platform Grant EP/H046526/1, during the study.
Figures
Similar articles
-
Accuracy of radiotherapy dose calculations based on cone-beam CT: comparison of deformable registration and image correction based methods.Phys Med Biol. 2018 Mar 12;63(6):065003. doi: 10.1088/1361-6560/aab0f0. Phys Med Biol. 2018. PMID: 29461255
-
An evaluation of techniques for dose calculation on cone beam computed tomography.Br J Radiol. 2019 Apr;92(1096):20180383. doi: 10.1259/bjr.20180383. Epub 2019 Feb 26. Br J Radiol. 2019. PMID: 30433821 Free PMC article.
-
Investigating deformable image registration and scatter correction for CBCT-based dose calculation in adaptive IMPT.Med Phys. 2016 Oct;43(10):5635. doi: 10.1118/1.4962933. Med Phys. 2016. PMID: 27782706
-
Validation of a deformable image registration technique for cone beam CT-based dose verification.Med Phys. 2015 Jan;42(1):196-205. doi: 10.1118/1.4903292. Med Phys. 2015. PMID: 25563260 Free PMC article.
-
A review of dose calculation approaches with cone beam CT in photon and proton therapy.Phys Med. 2020 Aug;76:243-276. doi: 10.1016/j.ejmp.2020.06.017. Epub 2020 Jul 28. Phys Med. 2020. PMID: 32736286 Review.
Cited by
-
Study of Variation in Dose Calculation Accuracy Between kV Cone-Beam Computed Tomography and kV fan-Beam Computed Tomography.J Med Phys. 2017 Jul-Sep;42(3):171-180. doi: 10.4103/jmp.JMP_24_17. J Med Phys. 2017. PMID: 28974864 Free PMC article.
-
Daily dose evaluation based on corrected CBCTs for breast cancer patients: accuracy of dose and complication risk assessment.Radiat Oncol. 2022 Dec 12;17(1):205. doi: 10.1186/s13014-022-02174-4. Radiat Oncol. 2022. PMID: 36510254 Free PMC article.
-
Evaluation of a multi-atlas CT synthesis approach for MRI-only radiotherapy treatment planning.Phys Med. 2017 Mar;35:7-17. doi: 10.1016/j.ejmp.2017.02.017. Epub 2017 Feb 24. Phys Med. 2017. PMID: 28242137 Free PMC article.
-
Generating synthetic CT from low-dose cone-beam CT by using generative adversarial networks for adaptive radiotherapy.Radiat Oncol. 2021 Oct 14;16(1):202. doi: 10.1186/s13014-021-01928-w. Radiat Oncol. 2021. PMID: 34649572 Free PMC article.
-
Impact of Acquisition Protocols on Accuracy of Dose Calculation Based on XVI Cone Beam Computed Tomography.J Med Phys. 2021 Apr-Jun;46(2):94-104. doi: 10.4103/jmp.JMP_128_20. Epub 2021 Aug 7. J Med Phys. 2021. PMID: 34566289 Free PMC article.
References
-
- Moseley DJ, White EA, Wiltshire KL, et al. Comparison of localization performance with implanted fiducial markers and cone-beam computed tomography for on-line image-guided radiotherapy of the prostate. Int J Radiat Oncol Biol Phys. 2007;67:942–953. doi: 10.1016/j.ijrobp.2006.10.039. - DOI - PMC - PubMed
Publication types
MeSH terms
Grants and funding
LinkOut - more resources
Full Text Sources
Other Literature Sources
Medical
