. 2015 Sep 25:5:14088.
doi: 10.1038/srep14088.

Three-dimensional non-destructive soft-tissue visualization with X-ray staining micro-tomography

Affiliations

Three-dimensional non-destructive soft-tissue visualization with X-ray staining micro-tomography

Juliana Martins de S e Silva et al. Sci Rep. .

Abstract

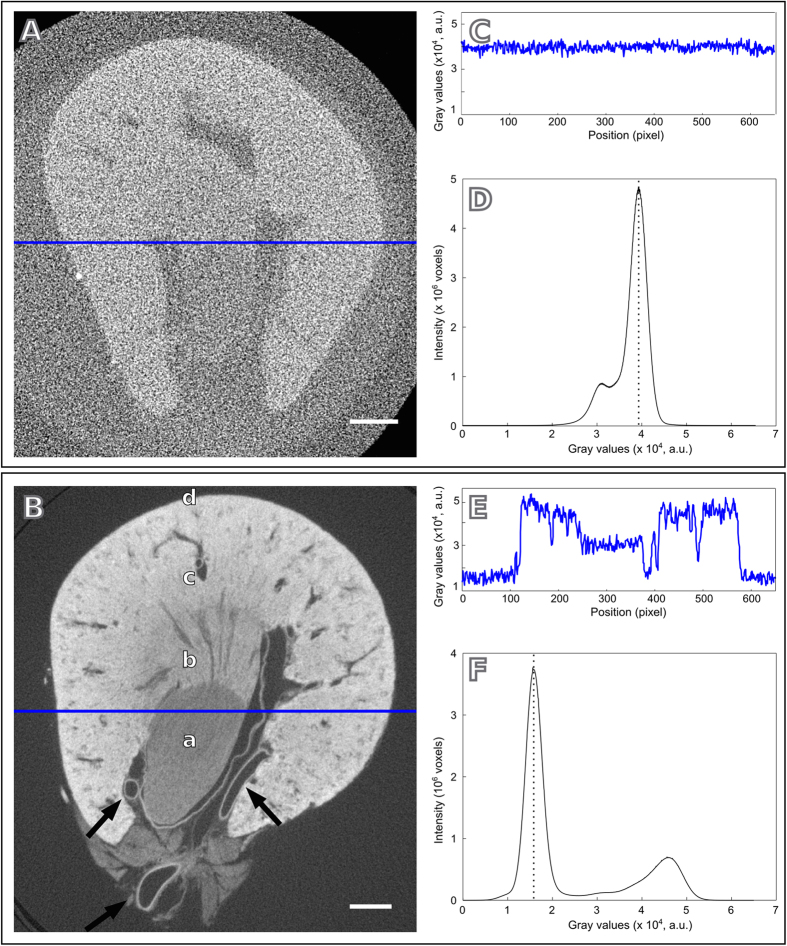
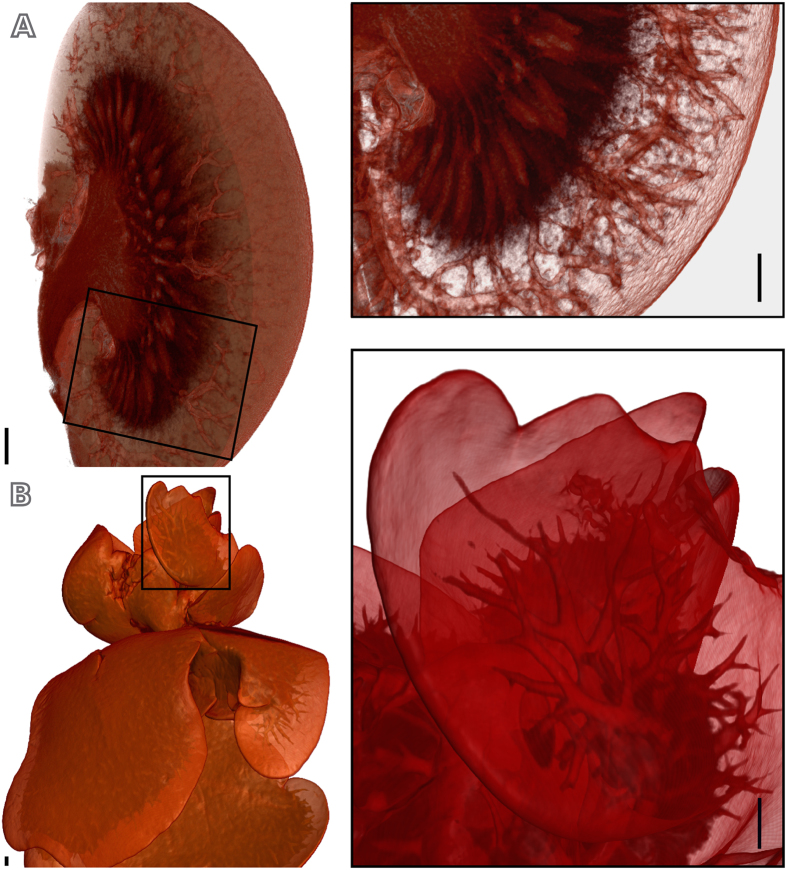
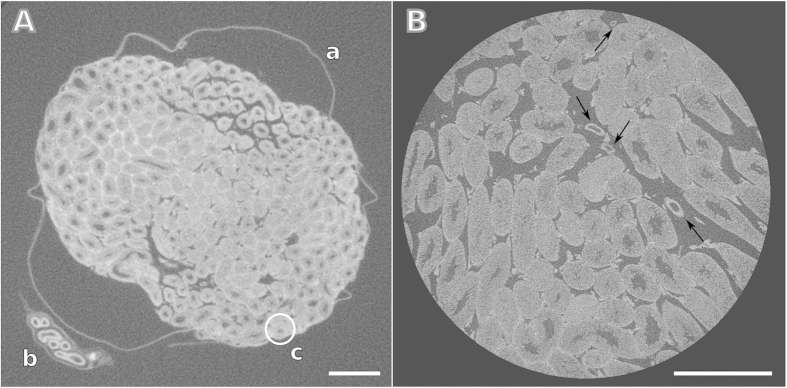
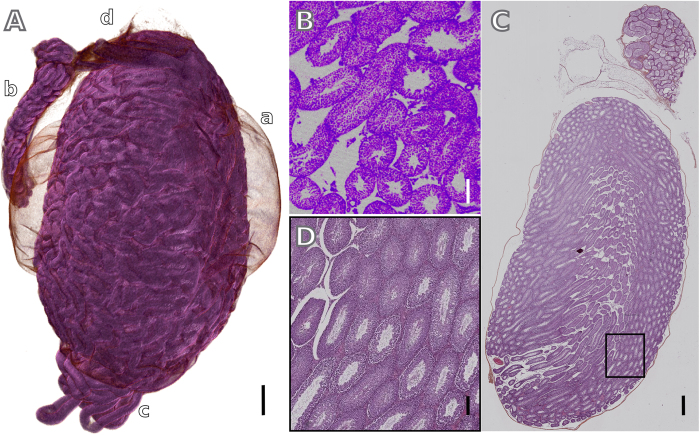
Low inherent contrast in soft tissues has been limiting the use of X-ray absorption micro-computed tomography (micro-CT) to access high-resolution structural information of animal organs. The staining agents used in micro-CT to improve the contrast fail in providing high-quality images of whole organs of animals due to diffusion problems of the staining agent into the sample. We demonstrate a staining protocol that incorporates a biochemical conditioning step prior to exposure to the staining agent that succeeds in overcoming the diffusion problems, thus quickly providing high-quality micro-CT images of whole organs of mammals. Besides of yielding non-distorted three-dimensional information at the same spatial resolution accessible in histological sections, micro-CT images of whole organs stained by our method enable easy screening of slices along any direction of the volume thus demonstrating new possibilities of structural analysis in biomedical science.


Figures

Figure 1
Figure 1. Comparison between non-stained and iodine-stained X-ray micro-CT images of a mouse kidney using the graded ethanol concentration fixation (GECF) protocol.
The staining procedure increases the absorption contrast, as confirmed by comparing the tomographic slices of (A), a non-stained kidney, and (B), an GEFC iodine-stained kidney. Kidney structures are well delineated in (B) and a) the inner medulla, b) the inner stripe and c) the outer stripe of the outer medulla, d) the renal cortex and some veins and arteries (arrows) are clearly identified. Profiles along the blue path in (A,B) are shown in (C,E), respectively. Distribution of voxel intensity values are shown in (D) for the non-stained kidney and in (F) for the GEFC-stained kidney. Scale bars: 500 μm. The images show one out of 1000 slices obtained from these scans.
Figure 2
Figure 2. Three-dimensional renderings of GEFC-stained micro-CT scans of different mouse organs.
GECF-stained mouse organs, where black rectangles delineate the regions enlarged to show details. (A) Virtual cut through the volume of a kidney, showing inner and outer medullas, as well as the renal vascular structure; (B) liver lobes, where the profile of the veins of approximately 150 μm diameter or less is seen. Scale bars: 500 μm.
Figure 3
Figure 3. Tomographic slices obtained from imaging a GEFC-stained mouse testicle with two different micro-CT scanner setup geometries.
The features visible in the image with moderate resolution (pixel size: 7.6 μm) in (A) include a) tunica albuginea; b) epididymis and c) seminiferous tubules (the circle highlight one tubule). In the higher resolution image shown in (B) (pixel size: 1.9 μm), the organization of the seminiferous tubules is revealed with higher level of detail, as well as some vessels indicated by the arrows. Scale bars: 500 μm.
Figure 4
Figure 4. Comparison between the stained micro-CT and histological images.
(A) Three-dimensional rendering of the whole mouse testicle, showing a) tunica albuginea; b) epididymis, c) seminiferous tubules and d) adipose tissue. A virtual axial cut of a high-resolution volume is shown in (B) and the features observed in this virtual histology section correlate well with those seen in the hematoxylin and eosin stained section in (C,D). Scale bars: 500 μm for (A,C); 100 μm for (B,D).

References

    1. Müller B., Germann M., Jeanmonod D. & Morel A. Three-dimensional assessment of brain tissue morphology. Proc. of SPIE 63180, 631803–1–631803–8 (2006).
    1. Ruffins S. W. et al. Digital three-dimensional atlas of quail development using high-resolution MRI. ScientificWorldJournal 7, 592–604 (2007). - PMC - PubMed
    1. Rudel D., Riebesell M. & Sommer R. J. Gonadogenesis in pristionchus pacificus and organ evolution: development, adult morphology and cell-cell interactions in the hermaphrodite gonad. Dev. Biol. 277, 200–221 (2005). - PubMed
    1. Smith H. F. et al. Comparative anatomy and phylogenetic distribution of the mammalian cecal appendix. J. Evol. Biol. 22, 1984–1999 (2009). - PubMed
    1. Koea J. B., Leung D., Lewis J. J. & Brennan M. F. Histopathologic type: an independent prognostic factor in primary soft tissue sarcoma of the extremity? Ann. Surg. Oncol. 10, 23–440 (2003). - PubMed

Publication types