Randomized Controlled Trial
. 2015 Sep 3;15(9):22378-400.
doi: 10.3390/s150922378.

Towards Low Energy Atrial Defibrillation

Affiliations
Randomized Controlled Trial

Towards Low Energy Atrial Defibrillation

Philip Walsh et al. Sensors (Basel). .

Abstract

A wireless powered implantable atrial defibrillator consisting of a battery driven hand-held radio frequency (RF) power transmitter (ex vivo) and a passive (battery free) implantable power receiver (in vivo) that enables measurement of the intracardiac impedance (ICI) during internal atrial defibrillation is reported. The architecture is designed to operate in two modes: Cardiac sense mode (power-up, measure the impedance of the cardiac substrate and communicate data to the ex vivo power transmitter) and cardiac shock mode (delivery of a synchronised very low tilt rectilinear electrical shock waveform). An initial prototype was implemented and tested. In low-power (sense) mode, >5 W was delivered across a 2.5 cm air-skin gap to facilitate measurement of the impedance of the cardiac substrate. In high-power (shock) mode, >180 W (delivered as a 12 ms monophasic very-low-tilt-rectilinear (M-VLTR) or as a 12 ms biphasic very-low-tilt-rectilinear (B-VLTR) chronosymmetric (6ms/6ms) amplitude asymmetric (negative phase at 50% magnitude) shock was reliably and repeatedly delivered across the same interface; with >47% DC-to-DC (direct current to direct current) power transfer efficiency at a switching frequency of 185 kHz achieved. In an initial trial of the RF architecture developed, 30 patients with AF were randomised to therapy with an RF generated M-VLTR or B-VLTR shock using a step-up voltage protocol (50-300 V). Mean energy for successful cardioversion was 8.51 J ± 3.16 J. Subsequent analysis revealed that all patients who cardioverted exhibited a significant decrease in ICI between the first and third shocks (5.00 Ω (SD(σ) = 1.62 Ω), p < 0.01) while spectral analysis across frequency also revealed a significant variation in the impedance-amplitude-spectrum-area (IAMSA) within the same patient group (|∆(IAMSAS1-IAMSAS3)[1 Hz - 20 kHz] = 20.82 Ω-Hz (SD(σ) = 10.77 Ω-Hz), p < 0.01); both trends being absent in all patients that failed to cardiovert. Efficient transcutaneous power transfer and sensing of ICI during cardioversion are evidenced as key to the advancement of low-energy atrial defibrillation.

Keywords: RF; battery-free; defibrillator; impedance; implantable; wireless.


Figures

Figure 1
Figure 1
Top-level implantable transcutaneous RF power link architecture.
Figure 2
Figure 2
Prototype hand-held (ex vivo) radio frequency (RF) power-transmitter and prototype battery-free implantable (in vivo) power-receiver (encapsulated for bench characterisation).
Figure 3
Figure 3
(a) Implantable receiver architecture and (b) simplified circuit used for analysis.
Figure 4
Figure 4
Position of defibrillation leads in the right atrium (RA) and coronary sinus (CS) for internal cardioversion of AF (right anterior oblique view).
Figure 5
Figure 5
RF defibrillator generated very-low tilt waveforms: (a) biphasic (B-VLTR) 12 ms chronosymmetric (6/6 ms) voltage waveform; (b) monophasic (M-VLTR) 12 ms waveform.
Figure 6
Figure 6
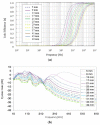
(a) Link efficiency versus resonant frequency as a function of inter-coil separation; (b) gain-frequency characteristics versus resonant frequency and (c) measured link efficiency versus wire diameter at operating resonant frequency of 185 kHz with both an IGBT and a MOSFET for switching.
Figure 6
Figure 6
(a) Link efficiency versus resonant frequency as a function of inter-coil separation; (b) gain-frequency characteristics versus resonant frequency and (c) measured link efficiency versus wire diameter at operating resonant frequency of 185 kHz with both an IGBT and a MOSFET for switching.
Figure 7
Figure 7
System characterisation data—TX microcontroller (VµC) control signal versus IGBT transistor switching voltage (VIGBT) and current (IIGBT).
Figure 8
Figure 8
Implant side rectified and regulated output voltage and current for inter-coil separation of 25 mm with RLOAD = 50 Ω at f~185 kHz: (a) in sense mode 15.9 V (5 V/div) at 0.32 A (5.1 W); with <8% ripple, Tx-Sense Mode = 15 V, Y-Axis: Output voltage (yellow) = 15.9 V / 0.32 A, (5 V/div); X-Axis: Timebase = 250 ms (25 ms/div); (b) Tx-Shock Mode Voltage Setting = 20 V, Y-Axis Ch-1 (green): Output voltage = 19.6 V (10 V/div), Y-Axis Ch-2 (red): Output current = 0.36 A (0.5 A/div); (c) Tx-Shock Mode Voltage Setting = 40 V, Y-Axis Ch-1 (green): Output voltage = 39.6 V (10 V/div), Y-Axis Ch-2 (red): Output current = 0.74 A (0.5 A/div); (d) Tx-Shock Mode Voltage Setting = 60 V, Y-Axis Ch-1 (green): Output voltage = 59.6 V (20 V/div), Y-Axis Ch-2 (red): Output current = 1.12 A (0.5 A/div); (e) Tx-Shock Mode Voltage Setting = 80 V, Y-Axis Ch-1 (green): Output voltage = 76.8 V (20 V/div), Y-Axis Ch-2 (red): Output current = 1.48 A (1 A/div); (f) Tx-Shock Mode Voltage Setting = 100 V, Y-Axis Ch-1 (green): Output voltage = 98.4 V (20 V/div), Y-Axis Ch-2 (red): Output current = 1.9 A (1 A/div); with an average waveform tilt of <3.5% measured.
Figure 8
Figure 8
Implant side rectified and regulated output voltage and current for inter-coil separation of 25 mm with RLOAD = 50 Ω at f~185 kHz: (a) in sense mode 15.9 V (5 V/div) at 0.32 A (5.1 W); with <8% ripple, Tx-Sense Mode = 15 V, Y-Axis: Output voltage (yellow) = 15.9 V / 0.32 A, (5 V/div); X-Axis: Timebase = 250 ms (25 ms/div); (b) Tx-Shock Mode Voltage Setting = 20 V, Y-Axis Ch-1 (green): Output voltage = 19.6 V (10 V/div), Y-Axis Ch-2 (red): Output current = 0.36 A (0.5 A/div); (c) Tx-Shock Mode Voltage Setting = 40 V, Y-Axis Ch-1 (green): Output voltage = 39.6 V (10 V/div), Y-Axis Ch-2 (red): Output current = 0.74 A (0.5 A/div); (d) Tx-Shock Mode Voltage Setting = 60 V, Y-Axis Ch-1 (green): Output voltage = 59.6 V (20 V/div), Y-Axis Ch-2 (red): Output current = 1.12 A (0.5 A/div); (e) Tx-Shock Mode Voltage Setting = 80 V, Y-Axis Ch-1 (green): Output voltage = 76.8 V (20 V/div), Y-Axis Ch-2 (red): Output current = 1.48 A (1 A/div); (f) Tx-Shock Mode Voltage Setting = 100 V, Y-Axis Ch-1 (green): Output voltage = 98.4 V (20 V/div), Y-Axis Ch-2 (red): Output current = 1.9 A (1 A/div); with an average waveform tilt of <3.5% measured.
Figure 9
Figure 9
FFT computed impedance magnitude (Ω) spectra for B-VLTR and M-VLTR shocks in the 0–20 kHz frequency range for the first three shocks (S1 -> S3) delivered to patients in Groups-I to IV; (a) patient PAF12, B-VLTR Impedance Amplitude Spectrum Area, (Ω-Hz): Group-I B-VLTR Success (0–20 kHz); (b) patient PAF18, B-VLTR Impedance Amplitude Spectrum Area, (Ω-Hz): Group-II B-VLTR Fail (0–20 kHz); (c) patient PAF14, M-VLTR Impedance Amplitude Spectrum Area, (Ω-Hz): Group-IIIM-VLTR Success (0–20 kHz); (d) patient PAF20, M-VLTR Impedance Amplitude Spectrum Area, (Ω-Hz): Group-IV M-VLTR Fail (0–20 kHz).
Figure 9
Figure 9
FFT computed impedance magnitude (Ω) spectra for B-VLTR and M-VLTR shocks in the 0–20 kHz frequency range for the first three shocks (S1 -> S3) delivered to patients in Groups-I to IV; (a) patient PAF12, B-VLTR Impedance Amplitude Spectrum Area, (Ω-Hz): Group-I B-VLTR Success (0–20 kHz); (b) patient PAF18, B-VLTR Impedance Amplitude Spectrum Area, (Ω-Hz): Group-II B-VLTR Fail (0–20 kHz); (c) patient PAF14, M-VLTR Impedance Amplitude Spectrum Area, (Ω-Hz): Group-IIIM-VLTR Success (0–20 kHz); (d) patient PAF20, M-VLTR Impedance Amplitude Spectrum Area, (Ω-Hz): Group-IV M-VLTR Fail (0–20 kHz).

References

    1. Schamroth L. An Introduction to Electrocardiography. 7th ed. Blackwell Scientific Publications; London, UK: 1990.
    1. Heeringa J., van verKuip D.A., Hofman A., Kors J.A., van Herpen G., Stricker B.H., Stijnen T., Lip G.Y., Witterman J.C. Prevalence, Incidence and Lifetime risk of Atrial Fibrillation: The Rotterdam study. Eur. Heart J. 2006;27:949–953. doi: 10.1093/eurheartj/ehi825. - DOI - PubMed
    1. Fuster V., Rydén L.E., Cannom D.S., Crijns H.J., Curtis A.B., Ellenbogen K.A., Halperin J.L., Le Huezey J.Y., Kay G.N., Lowe J.E., et al. ACC/AHA/ESC 2006 guidelines for the management of patients with atrial fibrillation: A report of the American College of Cardiology/American Heart Association Task Force on Practice Guidelines and the European Society of Cardiology Committee for Practice Guidelines (Writing Committee to Revise the 2001 Guidelines for the Management of Patients With Atrial Fibrillation) developed in collaboration with the European Heart Rhythm Association and the Heart Rhythm Society. Europace. 2006;8:651–745. - PubMed
    1. Wann L.S., Curtis A.B., January C.T., Ellenbogen K.A., Lowe J.E., Estes N.A., Page R.L., Ezekowitz M.D., Slotwiner D.J., Jackman W.M., et al. ACCF/AHA/HRS 2011 focused update on the management of patients with atrial fibrillation (Updating the 2006 Guideline) J. Am. Coll Cardiol. 2011;57:223–242. doi: 10.1016/j.jacc.2010.10.001. - DOI - PubMed
    1. Kim M.H., Johnston S.S., Chu B.C., Dalal M.R., Schulman M.A. Estimation of Total Incremental Health Care Costs in Patients With Atrial Fibrillation in the United States. Circ. Cardiovasc. Qual. Outcomes. 2011;4:313–320. doi: 10.1161/CIRCOUTCOMES.110.958165. - DOI - PubMed

Publication types

LinkOut - more resources