. 2015 Dec 1;119(11):1320-9.
doi: 10.1152/japplphysiol.00399.2015. Epub 2015 Sep 24.

Reduced voluntary drive during sustained but not during brief maximal voluntary contractions in the first dorsal interosseous weakened by spinal cord injury

Affiliations

Reduced voluntary drive during sustained but not during brief maximal voluntary contractions in the first dorsal interosseous weakened by spinal cord injury

Roeland F Prak et al. J Appl Physiol (1985). .

Abstract

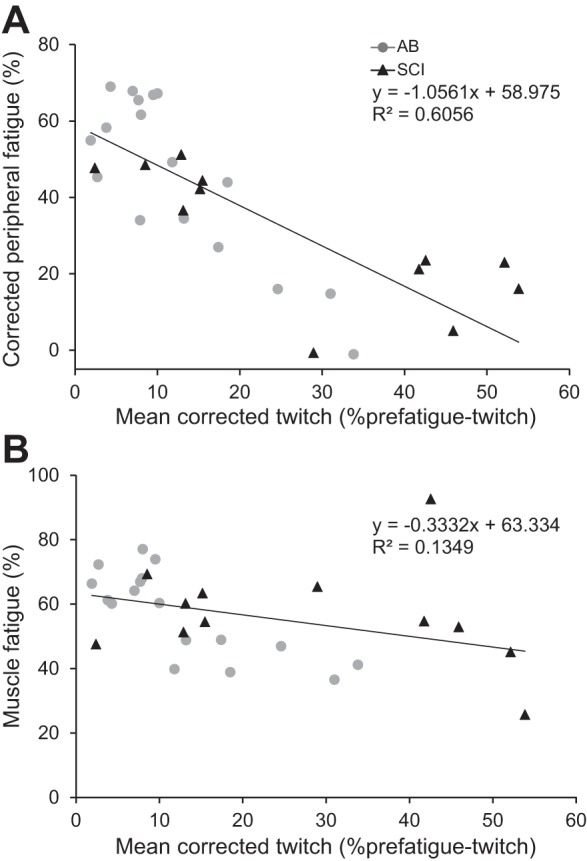
In able-bodied (AB) individuals, voluntary muscle activation progressively declines during sustained contractions. However, few data are available on voluntary muscle activation during sustained contractions in muscles weakened by spinal cord injury (SCI), where greater force declines may limit task performance. SCI-related impairment of muscle activation complicates interpretation of the interpolated twitch technique commonly used to assess muscle activation. We attempted to estimate and correct for the SCI-related-superimposed twitch. Seventeen participants, both AB and with SCI (American Spinal Injury Association Impairment Scale C/D) produced brief and sustained (2-min) maximal voluntary contractions (MVCs) with the first dorsal interosseous. Force and electromyography were recorded together with superimposed (doublet) twitches. MVCs of participants with SCI were weaker than those of AB participants (20.3 N, SD 7.1 vs. 37.9 N, SD 9.5; P < 0.001); MVC-superimposed twitches were larger in participants with SCI (SCI median 10.1%, range 2.0-63.2%; AB median 4.7%, range 0.0-18.4% rest twitch; P = 0.007). No difference was found after correction for the SCI-related-superimposed twitch (median 6.7%, 0.0-17.5% rest twitch, P = 0.402). Thus during brief contractions, the maximal corticofugal output that participants with SCI could exert was similar to that of AB participants. During the sustained contraction, force decline (SCI, 58.0%, SD 15.1; AB, 57.2% SD 13.3) was similar (P = 0.887) because participants with SCI developed less peripheral (P = 0.048) but more central fatigue than AB participants. The largest change occurred at the start of the sustained contraction when the (corrected) superimposed twitches increased more in participants with SCI (SCI, 16.3% rest twitch, SD 20.8; AB, 2.7%, SD 4.7; P = 0.01). The greater reduction in muscle activation after SCI may relate to a reduced capacity to overcome fast fatigue-related excitability changes at the spinal level.

Keywords: doublet force; fatigue; muscle activation; muscle atrophy; twitch interpolation.


Figures

Fig. 1.
Fig. 1.
Left: illustration of the terminology and the changes after spinal cord injury (SCI). The drive arising from supraspinal areas is defined as voluntary drive; the voluntary drive that passes the SCI and reaches the first dorsal interosseous (FDI) motoneuron pool is referred to as SCI net effective drive, and the drive reaching the muscle fibers is referred to as muscle activation. The difference between the voluntary drive and the SCI net effective drive equals the SCI-impaired drive. Right: above the SCI, neurons (gray matter) receive normal descending and spinal input (but less ascending input, not shown), and muscle function remains intact. At the epicenter, there is neuronal death, axon disruption, and demyelination (white matter) resulting in paralysis of some (but not all) muscle fibers. The net muscle force will depend on the number of motor units that are still under voluntary control. Motoneuron pools below the SCI receive reduced supraspinal input (SCI-effective drive) resulting in reduced muscle activation (reduced motor unit recruitment and less rate modulation).
Fig. 2.
Fig. 2.
A: Force and electromyographic (EMG) data recorded from a participant with SCI during the sustained contraction showing the target force (R), associated nontarget force (L), EMG of target FDI (R), and nontarget FDI (L). Black triangles (base down) indicate one pair of stimuli (10-ms interval), triangles (base up) indicate three double pulses at rest. B: illustration of a hand holding the force transducer. During the experiment the thumb and fingers are taped to each other to prevent changes in hand position.
Fig. 3.
Fig. 3.
A: submaximal contractions (10, 30, 50, and 70%) and maximal voluntary contraction (MVC) showing interpolated twitches and twitches at rest for the same participant with SCI as in B. Black triangles (base down) indicate one pair of stimuli (10-ms interval). B: linear extrapolation of the voluntary force-twitch relationship in a participant with SCI used to determine the SCI-related-superimposed twitch and the linearly estimated FDI force (LEF; x-intercept). The SCI-related-superimposed twitch (2 N) is estimated on the basis of linear regression because no stimuli were delivered when the force was strongest during the MVC (21.6 N). C: force-twitch relationship in an AB participant to show that a quadratic function provides a better fit for the twitches evoked during strong voluntary forces (open symbols). LEF was determined by linear regression using only the superimposed twitches during the submaximal contractions and the twitches at rest (filled symbols). D: measured MVC and LEF for individual participants (dotted lines) and group means (gray and black lines). AB, able-bodied; SCI, spinal cord injury.
Fig. 4.
Fig. 4.
Mean (SE) force (A) and root-mean-square (RMS) of the electromyographic signal (B) (each 2-s epochs) during the sustained MVC for the target (filled symbols) and nontarget (open symbols) FDI of the SCI (black triangles) and AB group (gray circles). C: mean (SE) superimposed twitches during the brief MVC (0 s) and the sustained MVC (n = 7) for AB (gray) and SCI participants (black). Filled symbols represent twitches corrected for both the SCI-related-superimposed twitch and peripheral fatigue (see Equation 3). The increase in the (corrected) twitch between from 0 to 8 s is significantly larger in participants with SCI than in AB participants.
Fig. 5.
Fig. 5.
Association between peripheral fatigue (%) (A) and muscle fatigue (%) (B) and the mean corrected twitch during the sustained MVC. For participants with SCI, the mean twitch and peripheral fatigue have been corrected for the SCI-related-superimposed twitch.

References

    1. Allen DG, Lamb GD, Westerblad H. Skeletal muscle fatigue: cellular mechanisms. Physiol Rev 88: 1: 287–332, 2008. - PubMed
    1. Allen GM, Gandevia SC, McKenzie DK. Reliability of measurements of muscle strength and voluntary activation using twitch interpolation. Muscle Nerve 18: 6: 593–600, 1995. - PubMed
    1. An KN, Ueba Y, Chao EY, Cooney WP, Linscheid RL. Tendon excursion and moment arm of index finger muscles. J Biomech 16: 6: 419–425, 1983. - PubMed
    1. Behm DG, St-Pierre DM, Perez D. Muscle inactivation: assessment of interpolated twitch technique. J Appl Physiol 81: 2267–2273, 1996. - PubMed
    1. Biering-Sorensen B, Kristensen IB, Kjaer M, Biering-Sorensen F. Muscle after spinal cord injury. Muscle Nerve 40: 499–519, 2009. - PubMed

Publication types

LinkOut - more resources