. 2015 Sep 25:6:8306.
doi: 10.1038/ncomms9306.

Functional classification of memory CD8(+) T cells by CX3CR1 expression

Affiliations

Functional classification of memory CD8(+) T cells by CX3CR1 expression

Jan P Böttcher et al. Nat Commun. .

Abstract

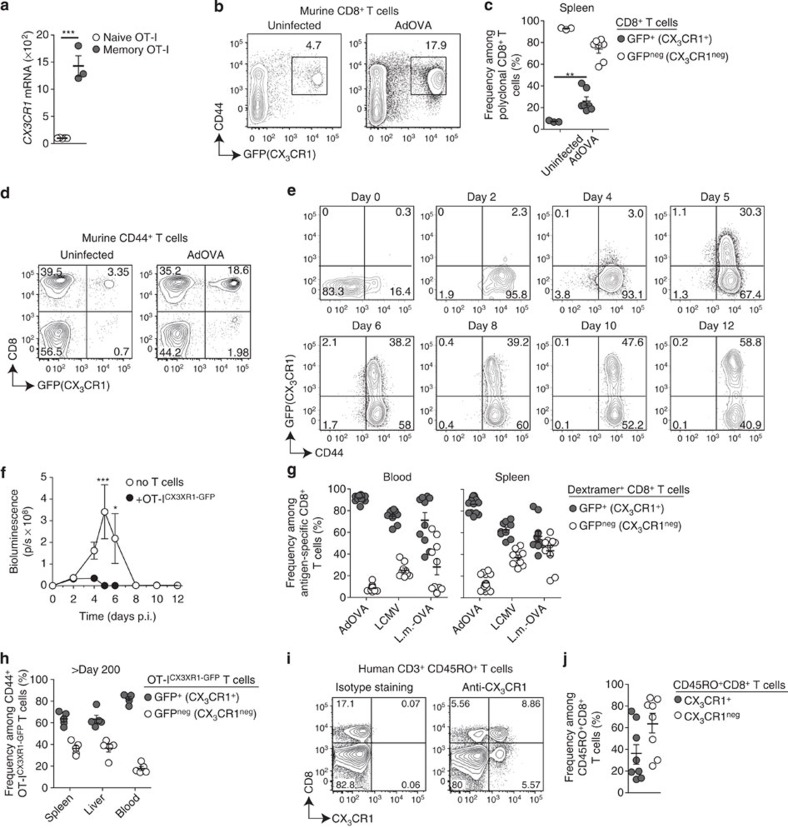
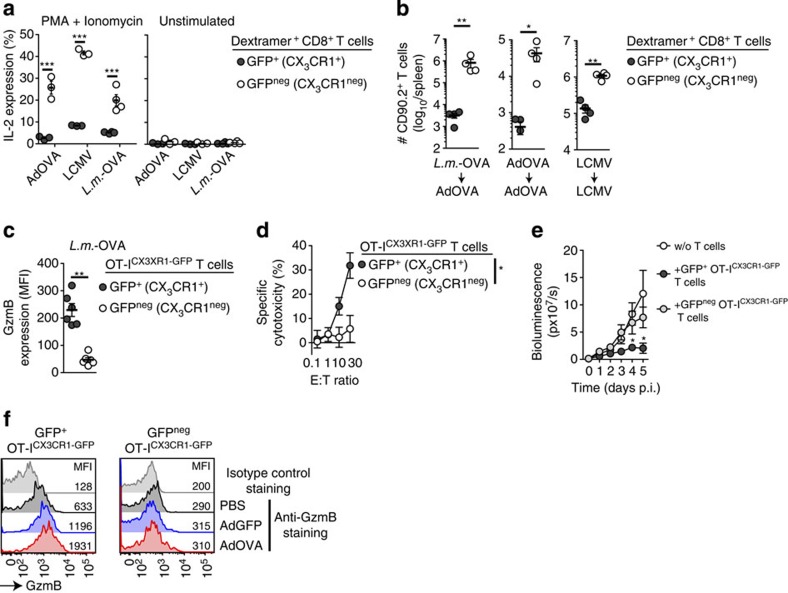
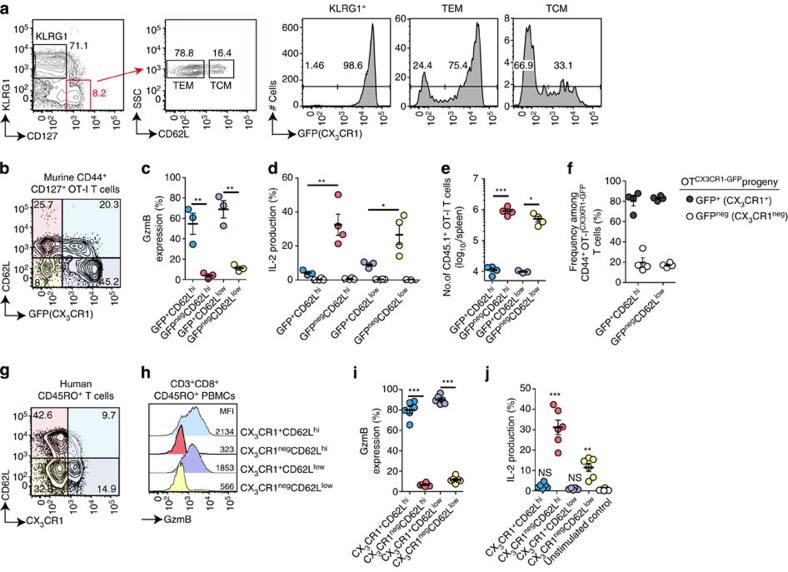
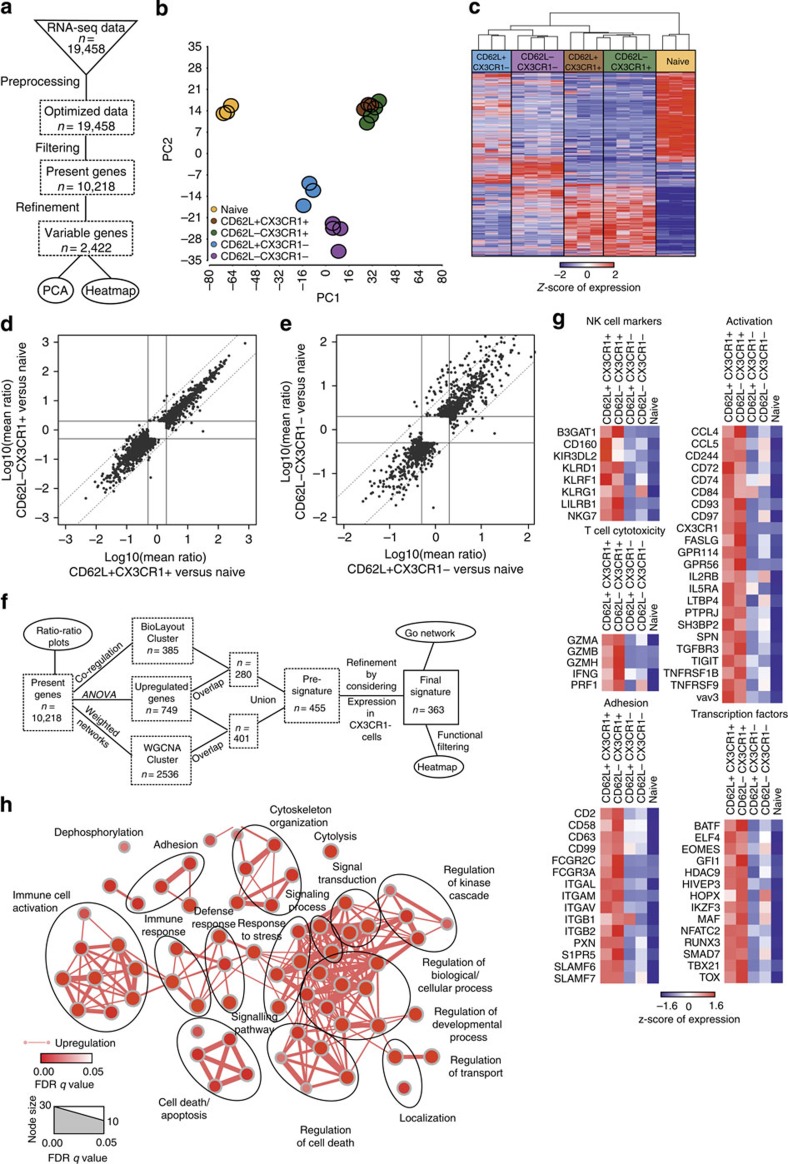
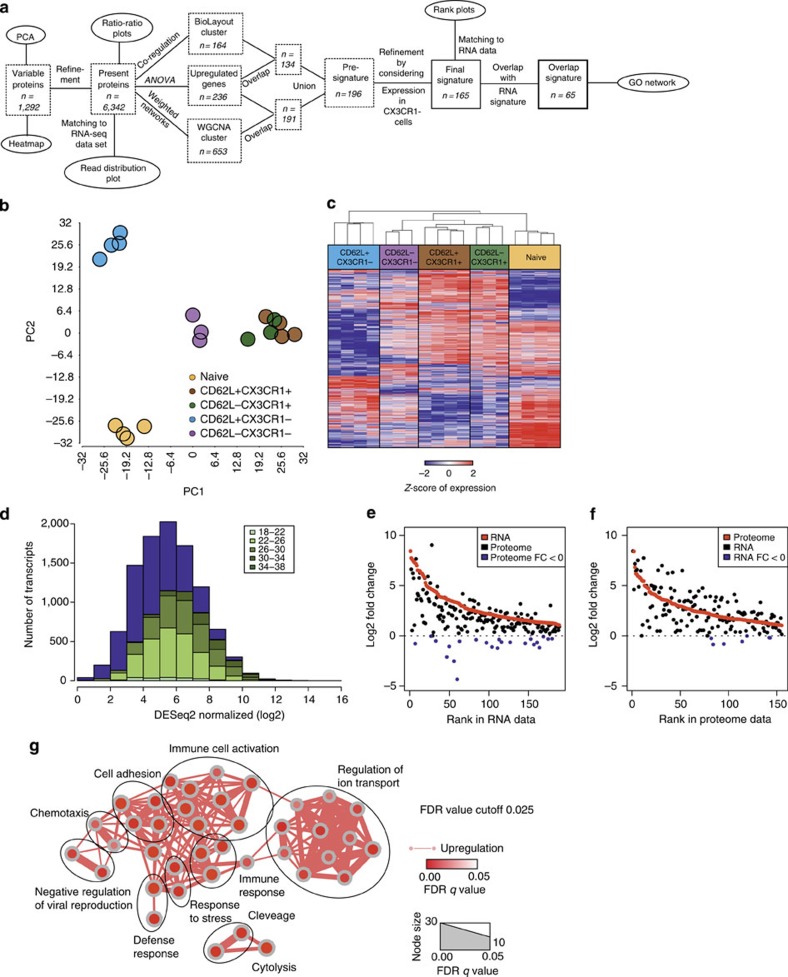
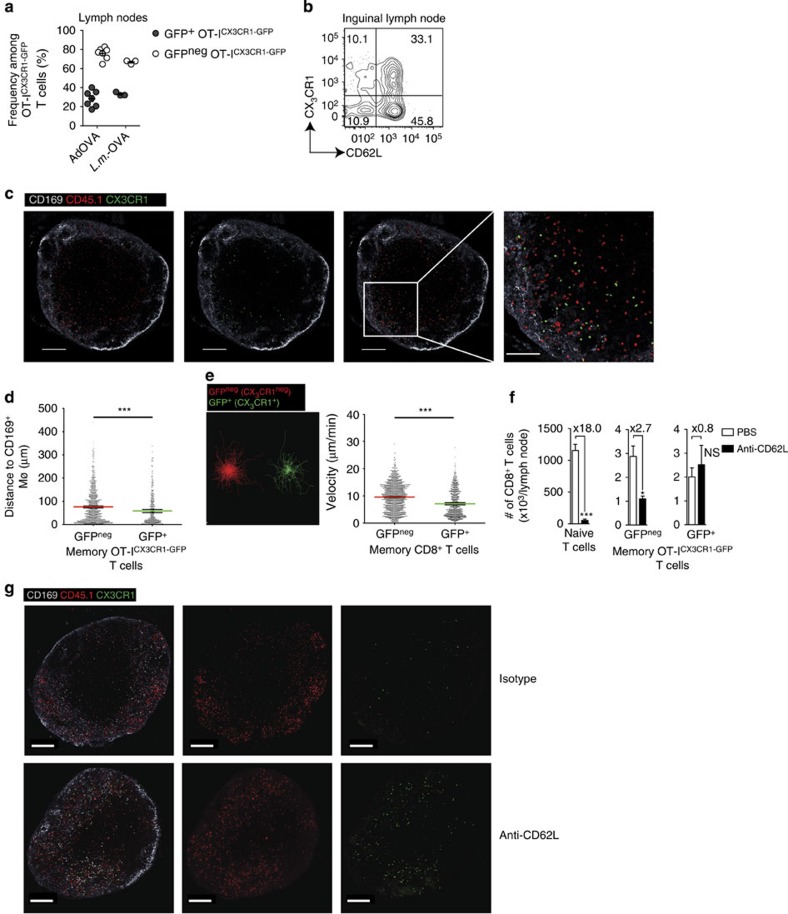
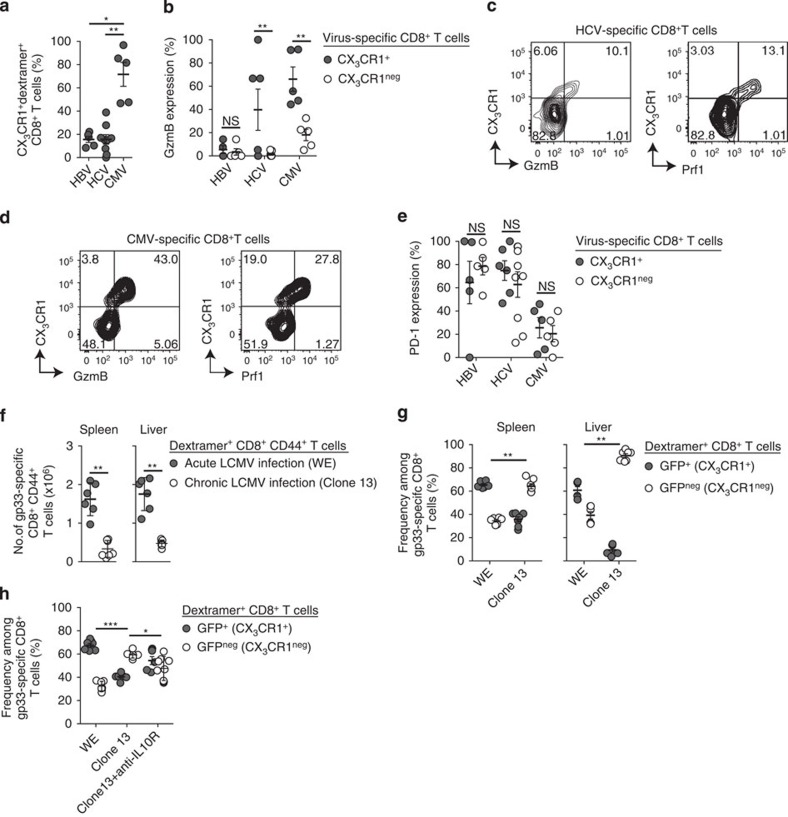
Localization of memory CD8(+) T cells to lymphoid or peripheral tissues is believed to correlate with proliferative capacity or effector function. Here we demonstrate that the fractalkine-receptor/CX3CR1 distinguishes memory CD8(+) T cells with cytotoxic effector function from those with proliferative capacity, independent of tissue-homing properties. CX3CR1-based transcriptome and proteome-profiling defines a core signature of memory CD8(+) T cells with effector function. We find CD62L(hi)CX3CR1(+) memory T cells that reside within lymph nodes. This population shows distinct migration patterns and positioning in proximity to pathogen entry sites. Virus-specific CX3CR1(+) memory CD8(+) T cells are scarce during chronic infection in humans and mice but increase when infection is controlled spontaneously or by therapeutic intervention. This CX3CR1-based functional classification will help to resolve the principles of protective CD8(+) T-cell memory.


Figures

Figure 1
Figure 1. CX3CR1 expression on antigen-experienced memory T cells in mice and man.
(a) Quantification of Cx3cr1 mRNA levels on CD44low naive OT-I T cells (n=5) and CD44+ memory OT-I T cells (n=3) at >d45 post L.m.-OVA infection. ***P<0.001, unpaired t-test. (bd) Frequencies of GFP+ T cells in untreated or AdOVA i.v infected CX3CR1+/GFP reporter mice (n=7) at 60 d.p.i. isolated from the spleen (b,c) and the blood (d). **P<0.01, unpaired t-test. (e) C57BL/6 mice that had received 3 × 10⁵ naïve CD44low CD45.1+ OT-ICX3CR1-GFP T cells 1 day before were infected with AdOVALUC at day 0 and analysed for GFP(CX3CR1)/CD44 expression in OVA-specific CD45.1+OT-ICX3CR1-GFP T cells at indicated time points. (f) In vivo bioluminescence activity of mice (n=7) from (e) demonstrating efficient OVA-specific T-cell immunity against virus-infected hepatocytes. C57BL/6 mice without adoptive T-cell transfer served as control. *P<0.05 and ***P<0.001, two-way ANOVA. (g) CX3CR1+/GFP mice were infected with AdOVA (n=10), L.m.-OVA (n=9) or LCMV WE (n=10). Frequencies of GFP+ (CX3CR1+) and GFPneg (CX3CR1neg) cells at 45–60 d.p.i. among splenic OVA-specific CD44+CD8+ T cells (AdOVA and L.m.-OVA infection) or gp33-specific CD44+ CD8+ T cells (LCMV infection) identified by Dextramer staining. (h) Frequencies of GFP+ and GFPneg CD45.1+ cells at >200 days post AdOVA infection of C57BL/6 wild-type mice (n=5) that had received 103 naive CD45.1+ OT-ICX3CR1-GFP cells before infection. (i) CX3CR1 expression in human CD45RO+ CD3+ T cells isolated from the blood and (j) frequency of CX3CR1+ and CX3CR1neg cells among human CD45RO+ CD8+ T cells (n=8). In scatter plots, each circle represents one mouse or patient, fluorescence-activated cell sorting (FACS) plots show representative analysis for one mouse or patient per group. Data are representative for two or three independent experiments (b,df, mean and s.d.) or have been pooled from two independent experiments (c,fh,j, mean and s.e.m.). In scatter plots, each circle represents one mouse or a different human donor, FACS plots show representative analysis for one mouse or human donor per group.
Figure 2
Figure 2. CX3CR1 expression separates memory CD8+ T cells with distinct functions.
(a,b) CX3CR1+/GFP mice were infected with AdOVA (n=3), L.m.-OVA (n=4) or LCMV WE (n=3). At 45–60 d.p.i., spleen-derived GFP+ (CX3CR1+) and GFPneg (CX3CR1neg) memory T cells specific for OVA (after AdOVA and L.m.-OVA infection) or for LCMV gp33 were obtained by FACSorting. (a) Ex vivo IL-2 production after stimulation with PMA/ionomycin. ***P<0.001, unpaired t-test. (b) Adoptive transfer of sorted OVA-specific or LCMV-specific CD8+ T cells (2 × 10³) into CD90.1+ mice (n=4) subsequently infected with AdOVA or LCMV. Determination of CD90.2+ T-cell numbers at 8 d.p.i. in the spleen. *P<0.05 and **P<0.01, unpaired t-test. (ce) Adoptive transfer of FACSsorted naive CD45.1+CD44low OT-ICX3CR1-GFP T cells (5 × 10²) into CD45.2+ mice followed by L.m.-OVA infection. (c) At 45–60 d.p.i, CD45.1+ Memory OT-ICX3CR1-GFP T cells from the spleen were analysed for intracellular GzmB expression (n=6). **P<0.01, unpaired t-test. (d) OVA-specific cytotoxicity of sorted GFP+ and GFPneg memory OT-ICX3CR1-GFP T cells directly ex vivo. *P<0.05, ANOVA. (e) Adoptive transfer of 3 × 10⁵ sorted GFP+ or GFPneg memory OT-ICX3CR1-GFP T cells into mice (n=6) that were infected with AdOVALUC 4 h before. In vivo bioluminescence activity was determined to measure T-cell effector function against virus-infected luciferase-expressing hepatocytes over time. AdOVALUC-infected mice that did not receive T cells served as controls (n=6). Data are representative for —two or three independent experiments. *P<0.05, two-way ANOVA. (f) Challenge of mice harbouring CD45.1+ Memory OT-ICX3CR1-GFP T cells with AdGFP or AdOVA and 6 h later determination of GzmB expression in splenic GFP+ and GFPneg memory OT-ICX3CR1-GFP T cells. Data are representative for two independent experiments (a,b,d,e, mean and s.d.) or have been pooled from two independent experiments (c,f, mean and s.e.m.). In scatter plots of ac, each dot represents data from one mouse. Fluorescence-activated cell sorting plots shown in d are representative for one mouse of a group of three or four mice per experiment.
Figure 3
Figure 3. CX3CR1 and CD62L expression identifies four distinct memory CD8+ T-cell populations.
(af) Naive CD45.1+ OT-I CX3CR1-GFP T cells (5 × 10²) were adoptively transferred into CD45.2 mice subsequently infected with AdOVA. (a) At 60 d.p.i., CX3CR1 expression was determined in CD45.1+ OT-I-derived KLRG1+ T cells, CD62LlowCD127+CD44+ memory T cells (TEM) and CD62LhiCD127+CD44+ memory T cells (TCM) isolated from the spleen. (b) Representative analysis of CD62L and GFP (CX3CR1) expression in CD127+ CD44+ memory OT-ICX3CR1-GFP T cells from a. (c,d) Four populations of CD127+ CD44+ memory OT-ICX3CR1-GFP T cells after AdOVA infection separated by CD62L and GFP (CX3CR1) expression levels were (c) analysed for GzmB expression or (d) sorted and analysed for IL-2 expression after PMA/ionomycine stimulation for 5 h. Unstimulated T cells from each population (empty circles) served as control. n=3 or 4 for each group; *P<0.05, **P<0.01, ANOVA. (e,f) Adoptive transfer of identical numbers (2 × 10³ cells) of FACSorted CD45.1+ cells from the four populations of memory T cells into CD45.2+ mice (n=4) that were subsequently infected with AdOVA. (e) At 8 d.p.i., total numbers of CD45.1+ T cells and (f) frequencies of CX3CR1+ cells among CD45.1+ T-cell progeny was determined in the spleen. *P<0.05, ***P<0.001, ANOVA. (g) Representative analysis showing CD62L and CX3CR1 expression in human CD45RO+CD3+CD8+ PBMCs. (h,i) Flow cytometric determination of expression of GzmB in the four cell populations stratified by CD62L and CX3CR1 expression. ***P<0.001, ANOVA. (j) IL-2 expression in FACSorted cells from these four T-cell populations subjected to PMA/ionomycine stimulation for 5 h. **P<0.01 and ***P<0.001, ANOVA. Fluorescence-activated cell sorting (FACS) plots are representative for three (ac) or five (g,h) independent experiments. Data from one of three independent experiments are show in cf each dot represents T cells from one mouse. (i,j) Pooled data for T cells from n=6 individual donors.
Figure 4
Figure 4. Transcriptome analysis reveals a core signature of human CX3CR1-expressing memory CD8+ T cells with effector function.
(a) Scheme describing the workflow for RNA-seq data preprocessing and filtering. (b) Principal component analysis (PCA) based on present and variable genes. (c) Heat map showing the z-transformed expression values of present and variable genes, coloured from blue to red. (d) Ratio–ratio plot of log10-transformed mean ratios of genes that are differentially expressed (fold change (FC) <−2 or >2; FDR-corrected P-value <0.05) comparing CD62L+ CX3CR1+ T cells versus naïve T cells (x axis) or CD62L CX3CR1+ T cells versus naïve T cells (y axis). (e) Ratio–ratio plot of log10-transformed mean ratios of genes being differentially expressed FC <−2 or >2; FDR-corrected P-value <0.05) comparing CD62L+ CX3CR1 T cells versus naïve T cells (x axis) or CD62L CX3CR1 T cells versus naïve T cells (y axis). (f) Schema describing the workflow for generating the transcriptome core signature for CX3CR1+ T cells. (g) Heat map of selected genes out of the 363-gene core signature sorted by defined activity groups. Gene expression values were z-transformed for visualization and are coloured from blue to red. (h) Network visualization of Gene Ontology Enrichment Analysis based on the 363 core signature genes using BiNGO and EnrichmentMap. Enriched GO terms are depicted by red nodes, where colour and size represent the corresponding FDR-adjusted enrichment P-value (q-value). Overlap of genes between nodes is indicated by edge thickness.
Figure 5
Figure 5. Proteome signature of human CX3CR1+ memory CD8+ T cells with effector function.
(a) Scheme describing the workflow for analysis of proteome data. (b) Principal component analysis (PCA) based on present and variable proteins. (c) Heat map showing the z-transformed expression values of present and variable proteins, coloured from blue to red. (d) Histogram of normalized RNA-seq expression values of present genes subdivided according to the corresponding log2-transformed protein expression. Violet bars illustrate expression values and amounts of all present transcripts, whereas green-shaded bars represent expression values and amounts of transcripts matched to proteins. (e) Fold change rank plot of RNA-seq signature genes (red) with overlay of ranks of the corresponding proteins (black). Proteins having a log2-fold change lower than 0 are marked in blue. (f) Fold change rank plot of protein signature genes (red) with overlay of ranks of the corresponding RNA-seq genes (black). Genes having a log2-fold change lower than 0 are marked in blue. (g) Network visualization of Gene Ontology Enrichment Analysis using BiNGO and EnrichmentMap based on the 65 genes overlapping between the transcriptome and proteome signatures. Enriched GO terms are depicted by red nodes, where colour and size represent the corresponding FDR-adjusted enrichment P-value (q-value)<0.025.
Figure 6
Figure 6. CX3CR1 identifies a distinct population of CD8+ memory T cells in lymph nodes.
(a) Quantification of GFP+ and GFPneg memory OT-ICX3CR1-GFP T cells within lymph nodes >45 d.p.i. with AdOVA (n=7) or L.m.-OVA (n=3). (b) Representative flow cytometric analysis of GFP and CD62L expression in memory OT-ICX3CR1-GFP T cells isolated from lymph nodes. (c) Confocal immunofluorescence images of popliteal lymph nodes from a mouse harbouring CX3CR1neg and CX3CR1+ memory OT-ICX3CR1-GFP T cells. Scale bar, 200 μm; zoom 100 μm). (d) Relative distance of CX3CR1neg and CX3CR1+ memory CD8+ T cells from CD169+ MΦ within popliteal lymph nodes. ***P<0.001, t-test. (e) Track length and average speed comparing CX3CR1neg and CX3CR1+ memory CD8+ T cells in the steady state in the interfollicular area over 1 h. ***P<0.001, t-test. (f,g) At 60 days after adoptive transfer of naïve CD45.1+ OT-ICX3CR1-GFP T cells (1 × 10³) and AdOVA infection, mice were injected daily with anti-CD62L neutralizing antibody (100 μg per mouse i.p.) or PBS over a period of 6 days (n=3 per group). (f) Quantification of total numbers of endogenous naive CD44lowCD8+ T cells, GFPnegCD44+ memory OT-ICX3CR1-GFP T cells and GFP+CD44+ memory OT-ICX3CR1-GFP T cells in inguinal lymph nodes. *P<0.05, ***P<0.001 t-test. (g) Confocal immunofluorescence images of popliteal lymph nodes at 6 day after anti-CD62L antibody treatment. Scale bar, 200 μm. Data from one of at least two independent experiments are shown.
Figure 7
Figure 7. Presence of CX3CR1+ CD8+ T cells during acute resolved and chronic viral infection in man and mouse.
(ae) CD8+ T cells isolated from the blood of human patients chronically infected with HBV or chronically infected with HCV were analysed for virus-specific CD8+ T cells identified by tetramer staining. CMV-specific CD8+ T cells from the same patients served as control. (a) Frequency of virus-specific CX3CR1+ CD8+ T cells. *P<0.05, **P<0.01, t-test. (b) Flow cytometric analysis of intracellular GzmB expression in CX3CR1+ and CX3CR1neg virus-specific CD8+ T cells. **P<0.01, t-test. (c,d) Representative fluorescence-activated cell sorting (FACS) plots showing intracellular GzmB and perforin (Prf1) expression in (c) HCV-specific CD8+ T cells and (d) CMV-specific CD8+ T cells. (e) Flow cytometric analysis of PD-1 expression in CX3CR1+ and CX3CR1neg virus-specific CD8+ T cells. (fh) Analysis of LCMV gp33-specific CD8+ T cells from CX3CR1+/GFP mice 40 days after acute LCMV infection (WE strain; n=6) or chronic LCMV infection (Clone 13 strain, n=7). (f) Quantification of total gp33-specific CD8+ T cells in the liver and spleen. **P<0.01, t-test. (g) Frequency of GFP+ (CX3CR1+) and GFPneg (CX3CR1neg) cells among gp33-specific CD8+ T cells. *P<0.05, **P<0.01, t-test. (h) Frequency of splenic GFP+ (CX3CR1+) and GFPneg (CX3CR1neg) gp33-specific CD8+ T cells in response to anti-IL10R antibody treatment. *P<0.05, ***P<0.001, ANOVA. a,b,e show data for at least five individual patients in each group, c,d show representative FACS plots for individual patients. Data in fh is pooled from two to three independent experiments, error bars depict s.e.m.

References

    1. Harty J. T., Tvinnereim A. R. & White D. W. CD8+ T cell effector mechanisms in resistance to infection. Annu. Rev. Immunol. 18, 275–308 (2000) . - PubMed
    1. Welsh R. M., Selin L. K. & Szomolanyi-Tsuda E. Immunological memory to viral infections. Annu. Rev. Immunol. 22, 711–743 (2004) . - PubMed
    1. Kaech S. M. & Cui W. Transcriptional control of effector and memory CD8+ T cell differentiation. Nat. Rev. Immunol. 12, 749–761 (2012) . - PMC - PubMed
    1. Utzschneider D. T. et al. T cells maintain an exhausted phenotype after antigen withdrawal and population reexpansion. Nat. Immunol. 14, 603–610 (2013) . - PubMed
    1. Sallusto F., Lenig D., Forster R., Lipp M. & Lanzavecchia A. Two subsets of memory T lymphocytes with distinct homing potentials and effector functions. Nature 401, 708–712 (1999) . - PubMed

Publication types

MeSH terms

Associated data