Review
. 2015 Oct;18(10):1353-63.
doi: 10.1038/nn.4086. Epub 2015 Sep 25.

Mechanisms of stress in the brain

Affiliations
Review

Mechanisms of stress in the brain

Bruce S McEwen et al. Nat Neurosci. 2015 Oct.

Abstract

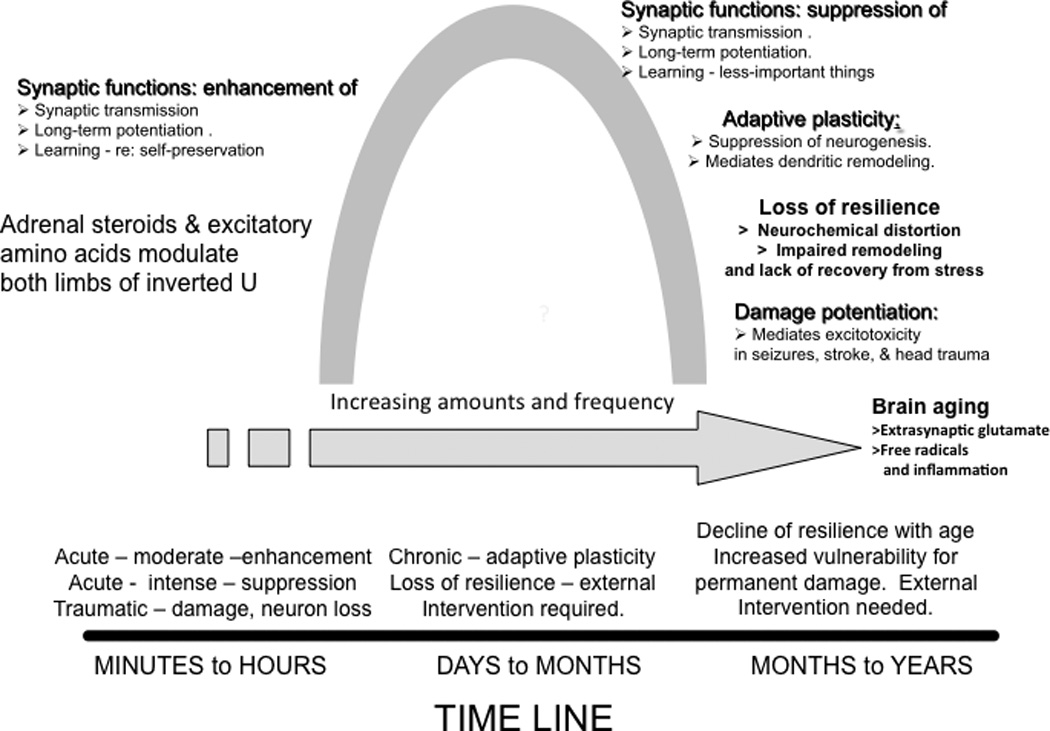
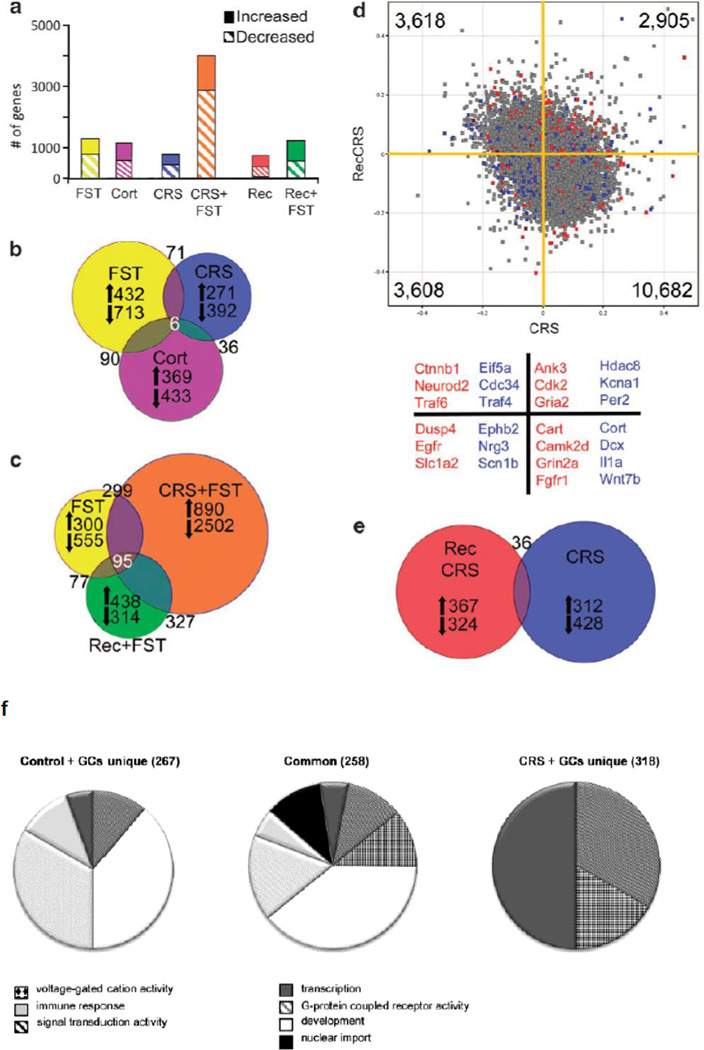
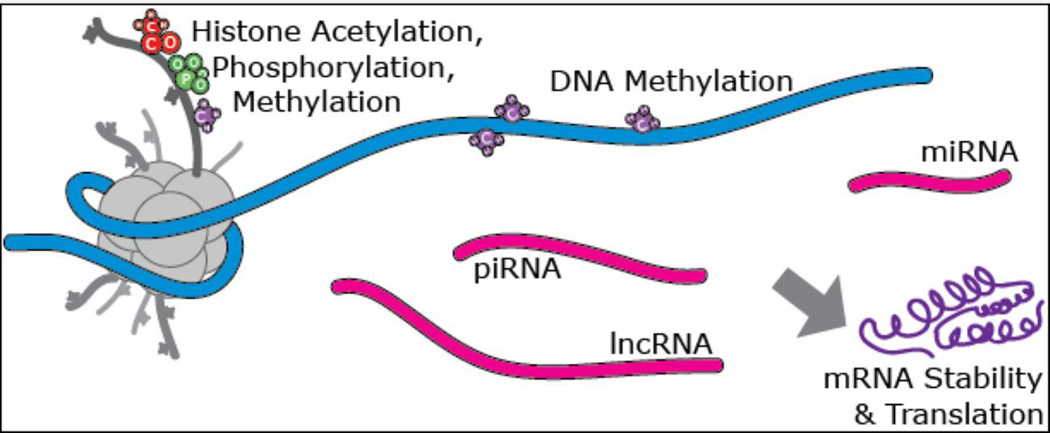
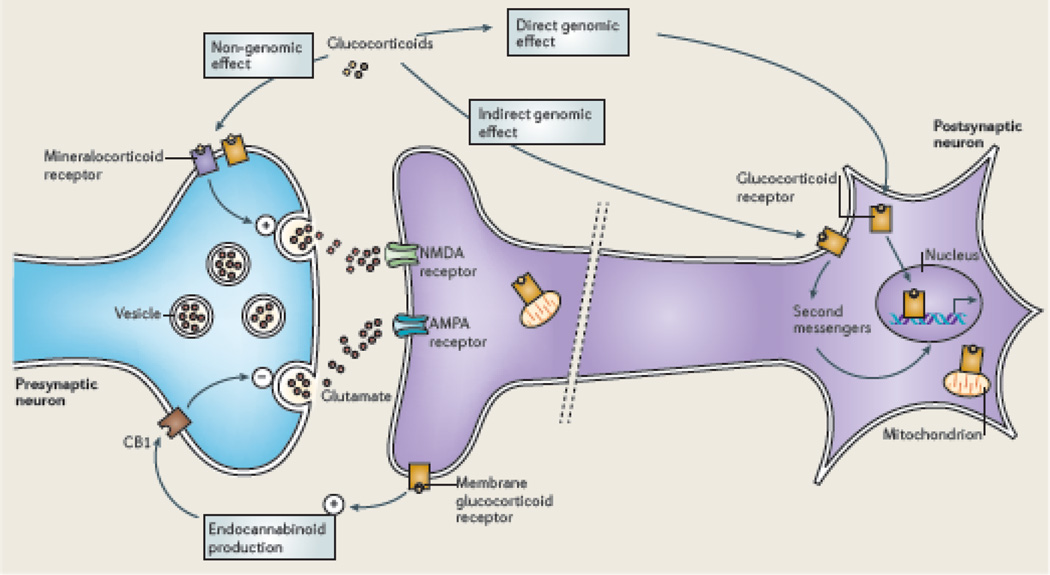
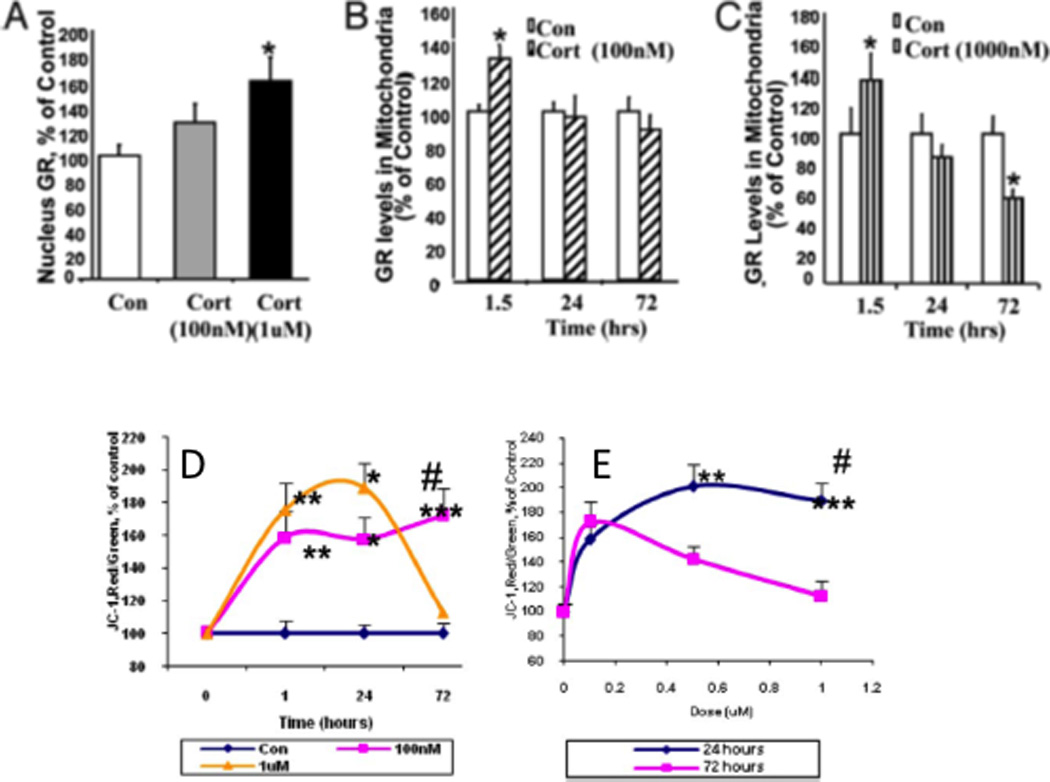
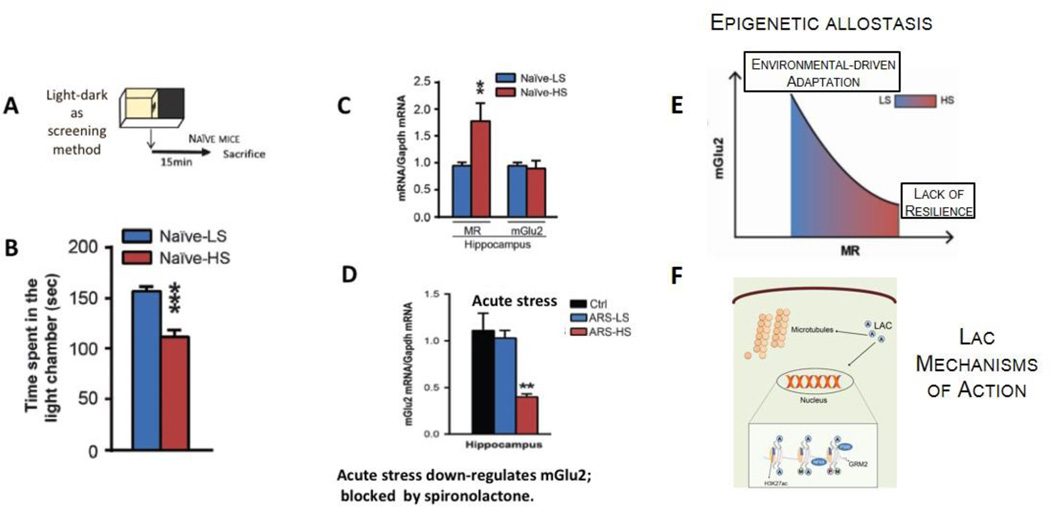
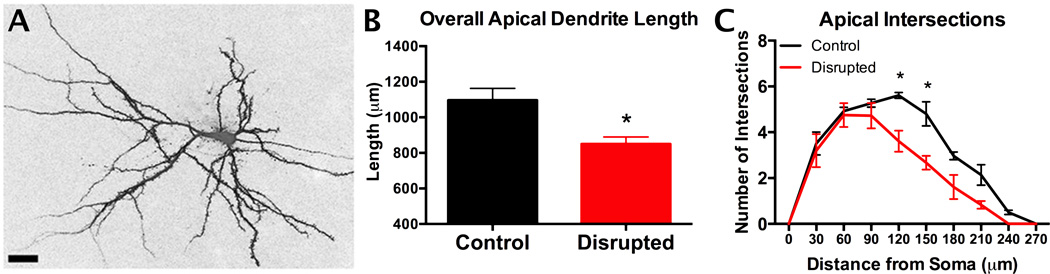
The brain is the central organ involved in perceiving and adapting to social and physical stressors via multiple interacting mediators, from the cell surface to the cytoskeleton to epigenetic regulation and nongenomic mechanisms. A key result of stress is structural remodeling of neural architecture, which may be a sign of successful adaptation, whereas persistence of these changes when stress ends indicates failed resilience. Excitatory amino acids and glucocorticoids have key roles in these processes, along with a growing list of extra- and intracellular mediators that includes endocannabinoids and brain-derived neurotrophic factor (BDNF). The result is a continually changing pattern of gene expression mediated by epigenetic mechanisms involving histone modifications and CpG methylation and hydroxymethylation as well as by the activity of retrotransposons that may alter genomic stability. Elucidation of the underlying mechanisms of plasticity and vulnerability of the brain provides a basis for understanding the efficacy of interventions for anxiety and depressive disorders as well as age-related cognitive decline.


Conflict of interest statement

The authors declare that there are no conflicts of interest.

Figures

Figure 1
Figure 1. Effects of acute and chronic stress, mediated in part by glutamate and glucocorticoids as well as other molecules described in the text and in BOX 1
These effects follow an “inverted U shape” curve in dose and time. The time line shows how acute and chronic stress and aging interact with the intensity and duration of stressor.
Figure 2
Figure 2. Gene expression changes in hippocampus in response to stress and glucocorticoid challenge depend on the prior stress history of the subject
Hippocampal microarray data reveals stress-induced gene expression changes. (a) Solid bars represent the number of significantly increased genes and hatched bars represent significantly decreased genes identified by pairwise comparisons of each stress group with age-matched controls. (b) Proportional Venn diagram illustrating the genes significantly altered by both the acute stress, chronic stress, and CORT injection conditions. The numbers of genes unique to each comparison that were increased or decreased are listed next to arrows indicating the direction of change. (c) Venn diagram of genes altered by each FST condition reveals a core of 95 genes that were always changed by this stressor. The large number of unique gene expression changes in each condition shows that the response to FST is altered by the stress history of the group, with the vast majority of changes occurring when the animal is exposed to a novel stressor immediately after a chronic stress exposure, as also shown in (a). (d) Scatter plot of normalized expression values for each microarray probe comparing CRS (x axis) with recovery from CRS (y axis). The majority of genes are increased by CRS, but decreased after recovery; however, there are a number of probes that are increased by CRS that remain elevated after recovery or are suppressed by CRS and remain low in recovery. Highlighted probes are those that reached significance when compared with age-matched controls (blue=CRS, red=recovery from CRS, gray=not significant). Several examples of the highlighted genes are listed below the scatter plot by color designation and quadrant. For example, blue points in the lower left quadrant, such as Nrg3 and Scn1b, represent genes that are significantly changed by CRS when compared with unstressed controls and are also decreased after recovery from CRS. Whereas red points in the upper right quadrant, such as Cdk2 and Gria2, are genes that remained significantly different from controls after recovery from CRS, and were also increased immediately following CRS. (e) Venn diagram illustrating that the number of genes significantly different from controls after recovery from CRS are mostly unique from those significantly altered by CRS. Reprinted from by permission. (f) Pie charts of overrepresented GO-terms among the 576 genes that were differentially expressed upon GC-challenge in naive versus chronically stressed rats. The differentially expressed genes were divided in a group that responded to GCs in both controls and CRS animals (center) or only in controls (left) or in CRS animals (right). The pie charts represent the GO-terms that were overrepresented in the 3 groups of GC-responsive genes and show that after CRS, GC-challenge gives rise to a different gene signature than in control animals. From by permission.
Figure 3
Figure 3. Molecular Epigenetic Modifications
Among the molecular mechanisms that fall under the epigenetic rubric are covalent modifications of the histone proteins which package and control access to the DNA, which include acetylation, methylation, and phosphorylation; as well as a growing number of more exotic modifications. The DNA itself may be methylated or hydroxyl-methylated at cytosine residues. A suite of non-coding RNA species such as microRNA (miRNA), piwi-interacting RNA (piRNA) and long non-coding RNA (lncRNA) also act to convey epigenetic information and to co-ordinate interactions between DNA and the transcriptional and chromatin modification machinery. It is worth noting that many of these mechanisms appear to have evolved in part from, or as a consequence of the presence of transposable elements in eukaryotic genomes. Adapted from.
Figure 4
Figure 4. The tripartite glutamate synapse
Neuronal glutamate (Glu) is synthesized de novo from glucose (not shown) and from glutamine (Gln) supplied by glial cells. Glutamate is then packaged into synaptic vesicles by vesicular glutamate transporters (vGluTs). SNARE complex proteins mediate the interaction and fusion of vesicles with the presynaptic membrane. Metabotropic glutamate receptors of class II, such as mGlu2 and mGlu3, regulate neuronal release of glutamate into the synaptic space. After release into the synaptic space, glutamate binds to ionotropic glutamate receptors (NMDA receptors (NMDARs) and AMPA receptors (AMPARs)) and metabotropic glutamate receptors (mGluR1 to mGluR8) on the membranes of both postsynaptic and presynaptic neurons and glial cells. Upon binding, the receptors initiate various responses, including membrane depolarization, activation of intracellular messenger cascades, modulation of local protein synthesis and, eventually, gene expression (not shown). Surface expression and function of NMDARs and AMPARs is dynamically regulated by protein synthesis and degradation and receptor trafficking between the postsynaptic membrane and endosomes. The insertion and removal of postsynaptic receptors provide a mechanism for long-term modulation of synaptic strength. Glutamate is cleared from the synapse through excitatory amino acid transporters (EAATs) on neighboring glial cells (EAAT1 and EAAT2) and, to a lesser extent, on neurons (EAAT3 and EAAT4). Within the glial cell, glutamate is converted to glutamine by glutamine synthetase and the glutamine is subsequently released by System N transporters and taken up by neurons through System A sodium-coupled amino acid transporters to complete the glutamate–glutamine cycle. Reprinted from by permission.
Figure 5
Figure 5. Biphasic effect of glucocorticoids (Cort) in regulating mitochondrial function
(A) Cort readily penetrate the cell membrane and interact with cytoplasmic glucocorticoid receptors (GRs), showing a dose-dependent increase in GR translocation into cell nuclei; (B), GR translocation into mitochondria as a complex with the anti-apoptotic protein, Bcl-2, where they upregulate mitochondrial calcium levels, membrane potential and oxidation; this is stabilized at 100nM dose (B) and (C) decreases with time at the high 1000nM Cort dose, where, after a 3 day treatment, high Cort leads to decreased GR and Bcl-2 levels in mitochondria (c). CORT modulates membrane potential, measured by Janus-1 (JC-1) staining in a dose- and time-dependent manner: (D) Time course of JC-1 staining after Cort treatment shows sustained potential at 100nM dose and loss of potential at high 1000nM dose; (E) Dose-dependent curve for JC-1 staining after Cort treatment showing that both low and high Cort maintain potential at 24h but high Cort causes failure of membrane potential at 72h. This regulation of mitochondrial function by Cort parallels neuroprotection; that is, treatment with low doses of Cort has a neuroprotective effect, whereas treatment with high Cort enhanced kainic acid (KA)-induced toxicity of cortical neurons,, consistent with the “glucocorticoid endangerment” hypothesis. Modified from by permission.
Figure 6
Figure 6
Individual differences in naïve C57Bl6 mice in anxiety-related behavior reveal animals more sensitive to stress-induced down-regulation of hippocampal mGlu2 expression, a biomarker of depressive-like behavior and antidepressant response. The use of the light-dark test as a screening method (A) allows identification of clusters of animals with a different baseline anxiety profile (B), along with differences in mineralocorticoid receptor (MR) levels in hippocampus (C). The susceptible mice that are characterized by higher baseline MR levels show reduced hippocampal mGlu2 expression associated with exacerbation of anxious and of depressive-like behaviors after acute (D) and chronic stress, respectively. Conversely, individuals with lower baseline MR levels cope better with stress and show adaptation in mGlu2 receptor expression in hippocampus. The epigenetic allostasis model (E) points to the developmental origins of these individual differences, suggesting that as yet unknown epigenetic influences early in life may lead to alterations in MR hippocampal levels. In (F) representative mechanisms of action of acetyl-L-carnitine (LAC): ours and other laboratories have shown that the decrease in mGlu2 receptors either following stress exposure or in a genetic animal model of depression is rapidly corrected by 3 days of intraperitoneal administration of the novel antidepressant candidate LAC via acetylation of either the H3K27 bound to Grm2 promoter, which codifies for mGlu2 receptors, or the NFkB/p65 sub-unit.
Figure 7
Figure 7. Mice cannot adjust to a 10:10 light:dark cycle as indicated by body temperature and locomotor activity rhythms
This circadian disruption, as in shift work, leads to increase body fat and leptin and insulin resistance, along with remodeling of apical dendrites of prefrontal cortical neurons and indications of cognitive rigidity. Data from.

References

    1. McEwen BS. Protective and Damaging Effects of Stress Mediators. New England J. Med. 1998;338:171–179. - PubMed
    1. McEwen BS. Protective and damaging effects of stress mediators: central role of the brain. Dial. in Clin. Neurosci.: Stress. 2006;8:367–381. - PMC - PubMed
    1. McEwen BS, Wingfield JC. The concept of allostasis in biology and biomedicine. Horm. & Behav. 2003;43:2–15. - PubMed
    1. Shonkoff JP, Boyce WT, McEwen BS. Neuroscience, molecular biology, and the childhood roots of health disparities. JAMA. 2009;301:2252–2259. - PubMed
    1. McEwen BS. Brain on stress: How the social environment gets under the skin. Proc Natl Acad Sci U S A. 2012;109(Suppl 2):17180–17185. - PMC - PubMed

Publication types