. 2015 Nov;28(11):1455-62.
doi: 10.1002/nbm.3384. Epub 2015 Sep 24.

(31)P-MRS of healthy human brain: ATP synthesis, metabolite concentrations, pH, and T1 relaxation times

Affiliations

(31)P-MRS of healthy human brain: ATP synthesis, metabolite concentrations, pH, and T1 relaxation times

Jimin Ren et al. NMR Biomed. 2015 Nov.

Abstract

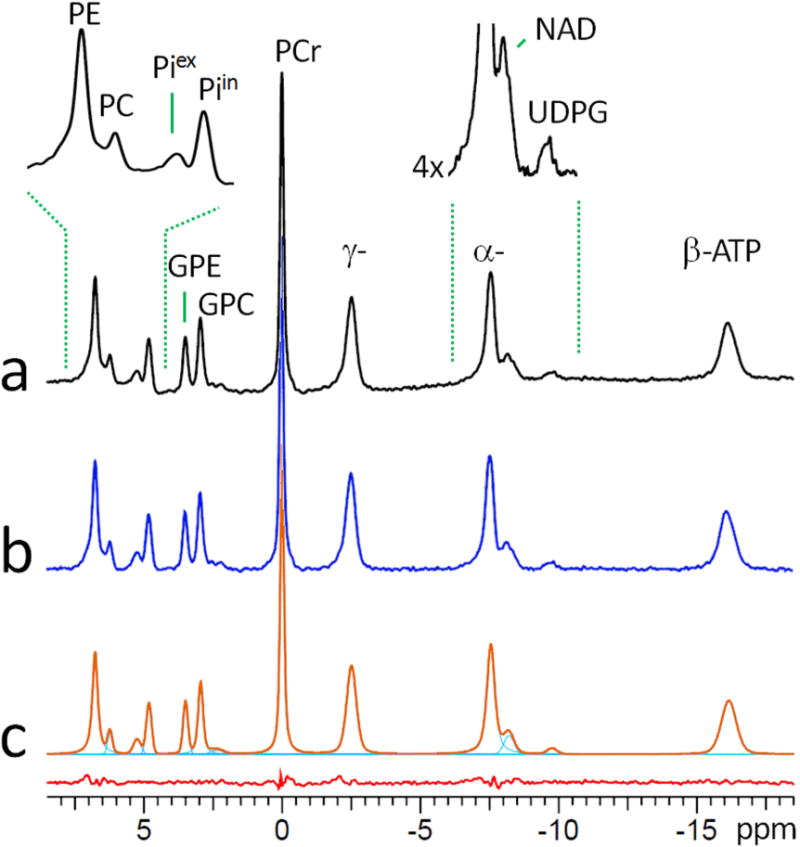
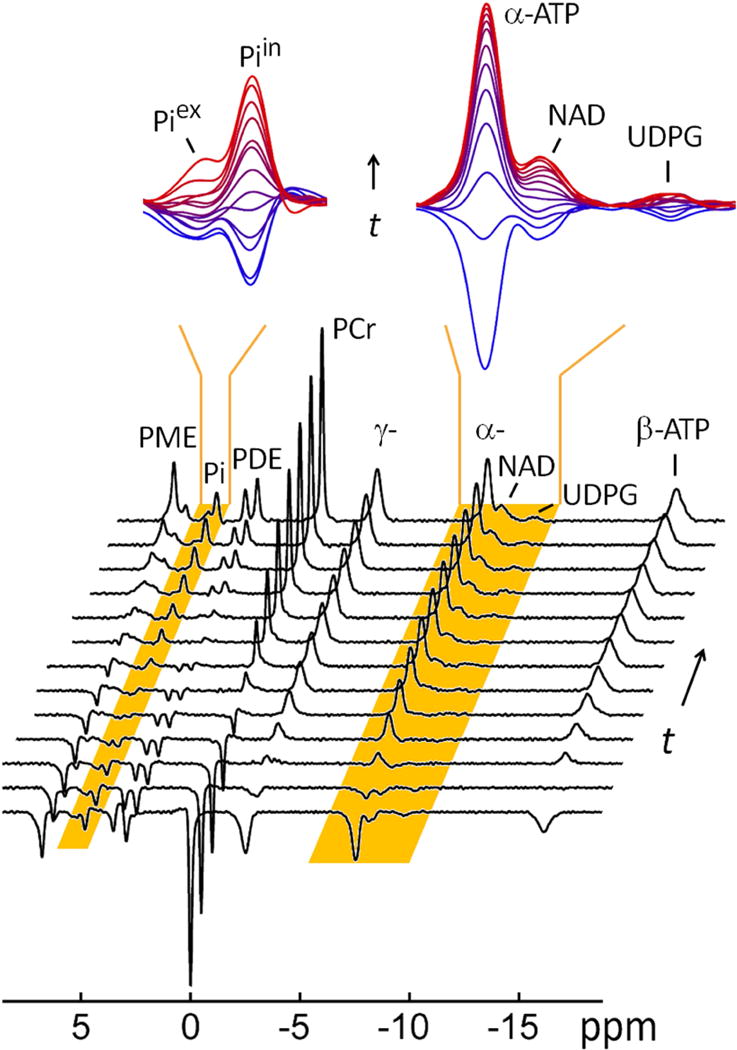
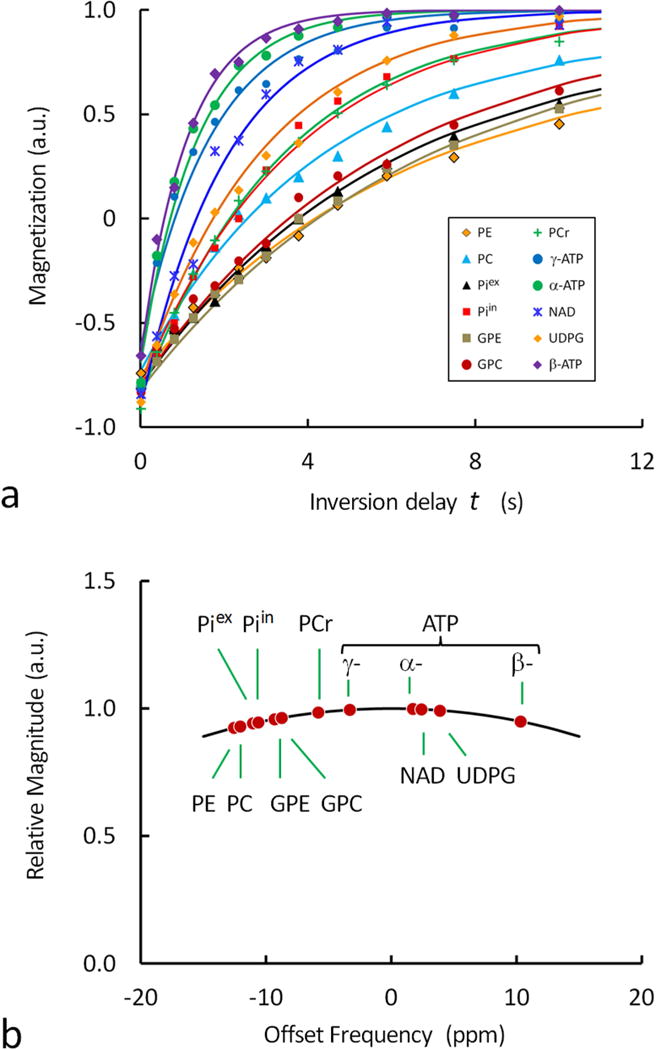
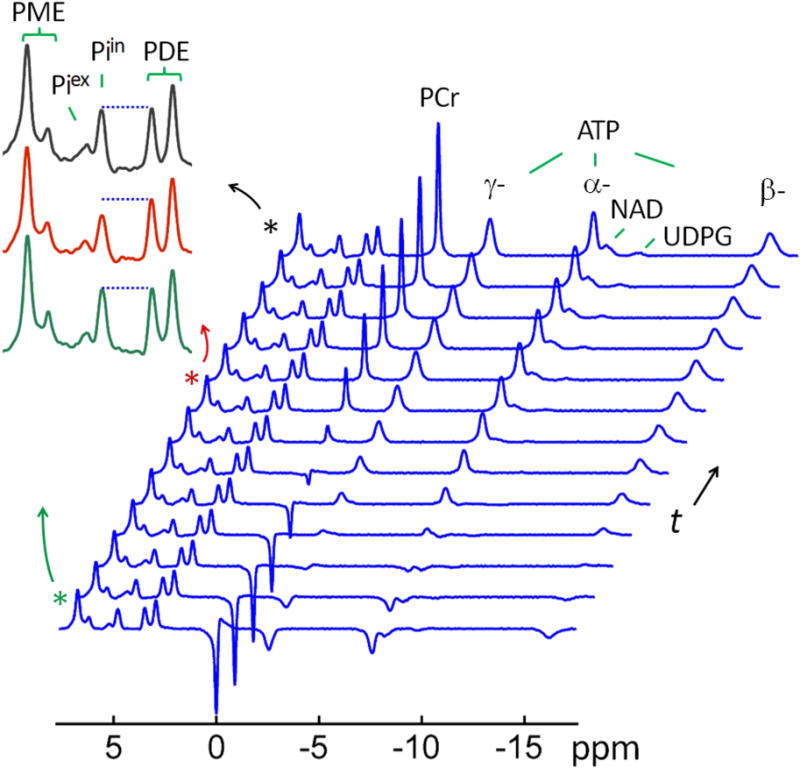
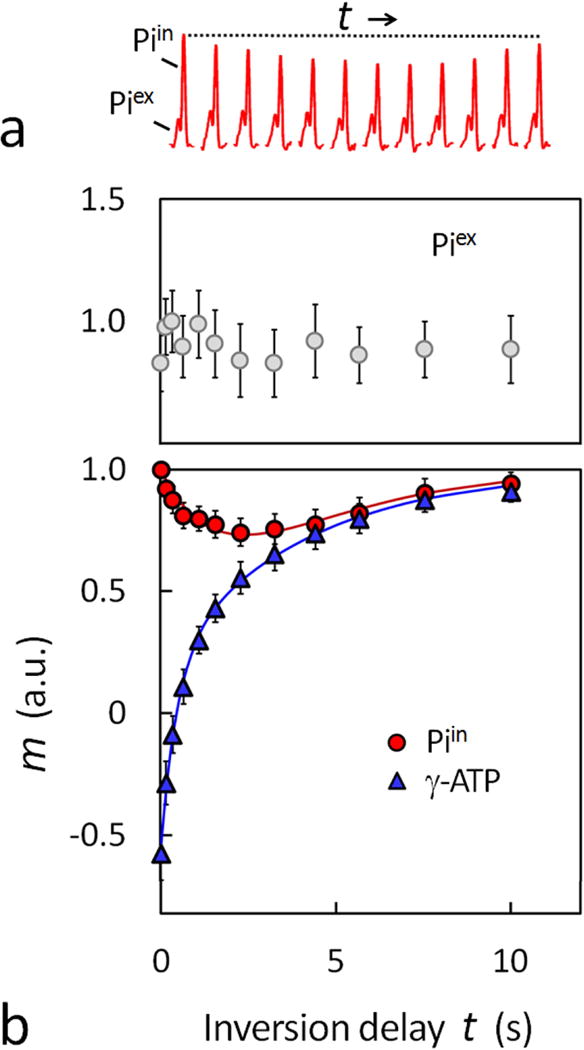
The conventional method for measuring brain ATP synthesis is (31)P saturation transfer (ST), a technique typically dependent on prolonged pre-saturation with γ-ATP. In this study, ATP synthesis rate in resting human brain is evaluated using EBIT (exchange kinetics by band inversion transfer), a technique based on slow recovery of γ-ATP magnetization in the absence of B1 field following co-inversion of PCr and ATP resonances with a short adiabatic pulse. The unidirectional rate constant for the Pi → γ-ATP reaction is 0.21 ± 0.04 s(-1) and the ATP synthesis rate is 9.9 ± 2.1 mmol min(-1) kg(-1) in human brain (n = 12 subjects), consistent with the results by ST. Therefore, EBIT could be a useful alternative to ST in studying brain energy metabolism in normal physiology and under pathological conditions. In addition to ATP synthesis, all detectable (31)P signals are analyzed to determine the brain concentration of phosphorus metabolites, including UDPG at around 10 ppm, a previously reported resonance in liver tissues and now confirmed in human brain. Inversion recovery measurements indicate that UDPG, like its diphosphate analogue NAD, has apparent T1 shorter than that of monophosphates (Pi, PMEs, and PDEs) but longer than that of triphosphate ATP, highlighting the significance of the (31)P-(31)P dipolar mechanism in T1 relaxation of polyphosphates. Another interesting finding is the observation of approximately 40% shorter T1 for intracellular Pi relative to extracellular Pi, attributed to the modulation by the intracellular phosphoryl exchange reaction Pi ↔ γ-ATP. The sufficiently separated intra- and extracellular Pi signals also permit the distinction of pH between intra- and extracellular environments (pH 7.0 versus pH 7.4). In summary, quantitative (31)P MRS in combination with ATP synthesis, pH, and T1 relaxation measurements may offer a promising tool to detect biochemical alterations at early stages of brain dysfunctions and diseases.

Keywords: 31P MRS; ATP; T1 relaxation time; brain metabolism; chemical exchange; inversion transfer; magnetization transfer; pH.


Figures

FIG. 1
FIG. 1
A 7T 31P MR spectrum, group-averaged for 12 subjects, acquired from resting human brain using a spatially nonselective single-pulse sequence with long TR of 30 sec, before (a) and after (b) baseline correction, and the result of 31P peak fitting (c). The fitting residual (bottom red trace) in (c) represents the spectral subtraction (bc). Abbreviation: PE, phosphoethenolamine; PC, phosphocholine, GPE, glycerophosphoethanolamine; GPC, glycerophosphocholine; Piin and Piex, intra- and extracellular inorganic phosphate; PCr, phosphocreatine; ATP, adenosine triphosphate; NAD, nicotinamide adenine dinucleotide; UDPG, uridine diphosphate glucose.
FIG. 2
FIG. 2
Brain concentration of P-metabolites (a) and Mg2+ (b), and intra- and extracellular pH (c), averaged for n = 12 subjects. Data quantification was based on the 31P peak fitting shown in Figure 1c, with P-metabolites concentrations evaluated by the integral of 31P peaks, [Mg2+] by chemical shift difference between α- and β-ATP, and pH by the chemical shift difference between Pi and PCr.
FIG. 3
FIG. 3
A typical 31P MR spectral series acquired from resting human brain at 7 T using a non-selective inversion-recovery sequence at TR 30 sec, NA = 6 and varying inversion delay time t. The insets showed the regional spectra enlarged for clear view of 31P signals of low-intensity in the chemical shift regions of 4.5 – 5.5 ppm (left) and −6.5 – −10.5 ppm (right); the spectra were colored coded from blue to red to indicate the gradual increase of the inversion delay time t. For comparison, the last trace of the spectral series represents the fully relaxed brain 31P MR spectrum acquired at TR 30 sec without applying the inversion pulse.
FIG. 4
FIG. 4
(a) Plots of normalized 31P magnetization against the inversion delay time t for the evaluation of apparent T1 relaxation time of brain metabolites. The data were from the signal intensity measurements in the inversion-recovery 31P spectra shown in Figure 3, and the solid curves represent the fitting based a mono-exponential process. Note the rapid relaxation of ATP, NAD and UDPG (P-metabolites with two or more coupling phosphate groups) as compared to PME, PDE, Pi and PCr (P-metabolites with a single phosphate group). (b) Excitation profile of the 31P spectrum showing the dependence of signal intensity on transmitter offset frequency. The excitation profile was used for correction of metabolite concentration based on signal intensity.
FIG. 5
FIG. 5
A typical 31P MR spectral series acquired with EBIT sequence using a band inversion pulse selectively inverting PCr and ATP spins, and followed by a varying delay time t All data are shown with identical y-scale. The insets show the regional spectra in the chemical shift region of 2 – 8 ppm, enlarged for a clear view of magnetization transfer effect at intracellular inorganic phosphate (Piin) from γ-ATP due to inversion delay (green trace: inversion delay time t = 3 ms; red trace: t = 3.2 sec; and black trace: fully relaxed spectrum). For comparison, the last trace of the spectral series represents the fully relaxed brain 31P MR spectrum acquired at TR 30 sec without applying the inversion pulse.
FIG. 6
FIG. 6
(a) Comparison of intra- and extracellular Pi signal changes in response to increase in the inversion recovery delay time t. All data are shown with identical y-scale, and taken from the EBIT spectra shown in Figure 5. (b) Normalized Z-magnetizations versus delay time t for extracellular Pi (top) and intracellular Pi and γ-ATP (bottom, averaged for 12 subjects). The solid curves in the plots represent the data fitting using a bi-exponential equation (Eq. [7]) for Pi and a mono-exponential equation for γ-ATP.

References

    1. Lei H, Ugurbil K, Chen W. Measurement of unidirectional Pi to ATP flux in human visual cortex at 7 T by using in vivo 31P magnetic resonance spectroscopy. Proc Natl Acad Sci U S A. 2003;100(24):14409–14. - PMC - PubMed
    1. Du F, Zhu XH, Qiao H, Zhang X, Chen W. Efficient in vivo 31P magnetization transfer approach for noninvasively determining multiple kinetic parameters and metabolic fluxes of ATP metabolism in the human brain. Magn Reson Med. 2007;57(1):103–14. - PubMed
    1. Befroy DE, Rothman DL, Petersen KF, Shulman GI. 31P-magnetization transfer magnetic resonance spectroscopy measurements of in vivo metabolism. Diabetes. 2012 Nov;61(11):2669–78. - PMC - PubMed
    1. Ren J, Yang B, Sherry AD, Malloy CR. Exchange kinetics by inversion transfer: Integrated analysis of the phosphorus metabolite kinetic exchanges in resting human skeletal muscle at 7 T. Magn Reson Med. 2015;73(4):1359–69. - PMC - PubMed
    1. Bresnen A, Duong TQ. Brain high-energy phosphates and creatine kinase synthesis rate under graded isoflurane anesthesia: An in vivo (31) P magnetization transfer study at 11.7 tesla. Magn Reson Med. 2015;73(2):726–30. - PMC - PubMed

Publication types

LinkOut - more resources