

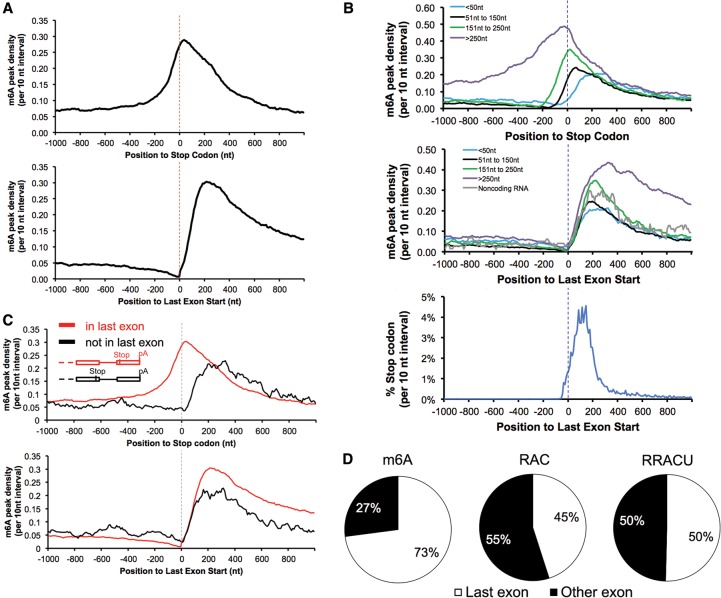
A majority of m6A residues are in the last exons, allowing the potential for 3' UTR regulation
- PMID: 26404942
- PMCID: PMC4604345
- DOI: 10.1101/gad.269415.115
A majority of m6A residues are in the last exons, allowing the potential for 3' UTR regulation
Abstract
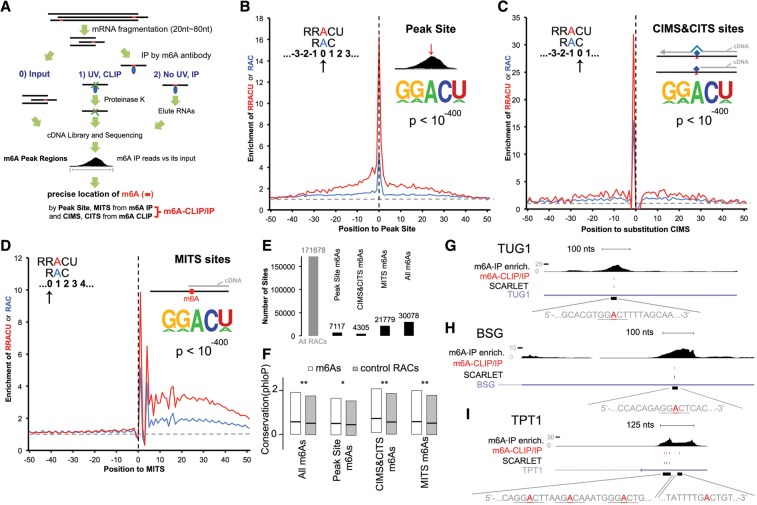
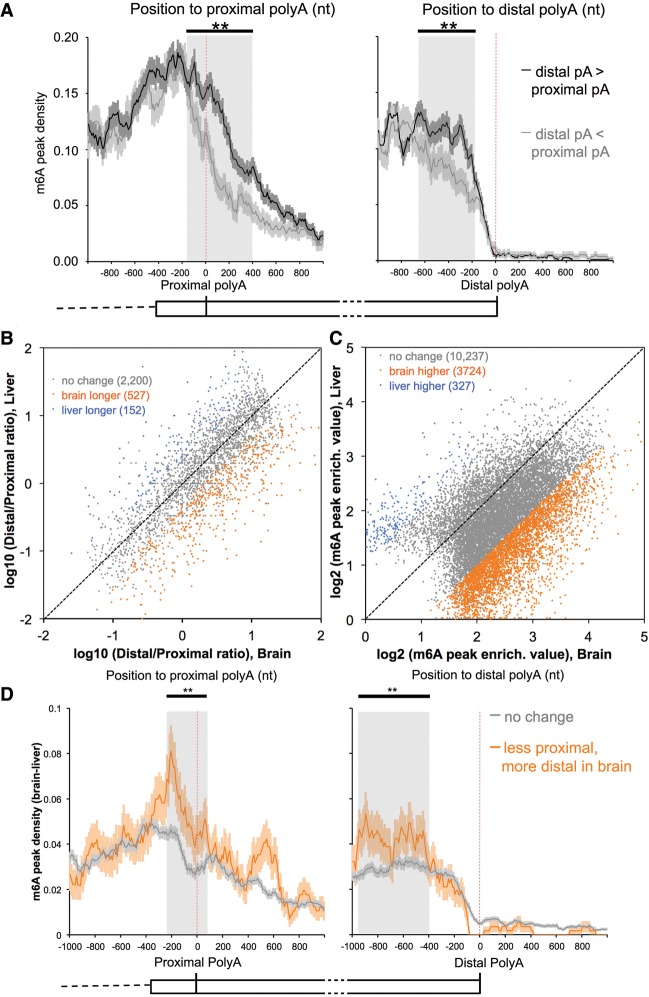
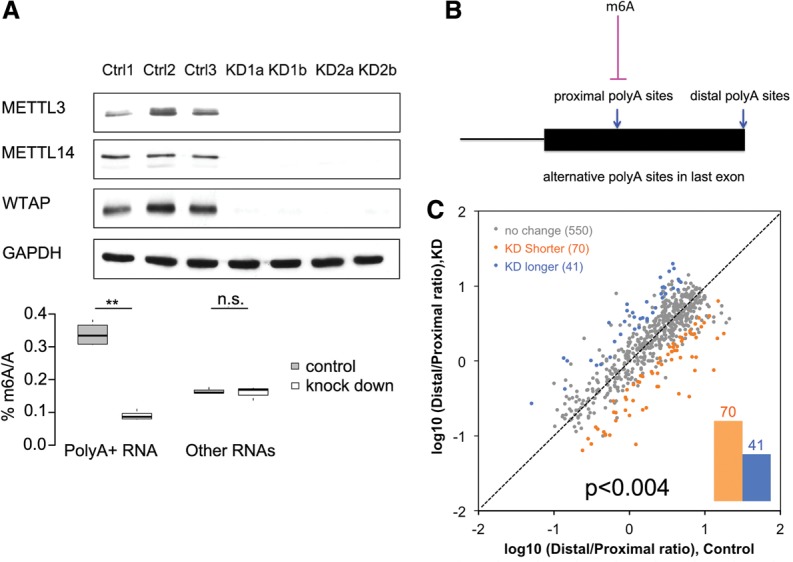
We adapted UV CLIP (cross-linking immunoprecipitation) to accurately locate tens of thousands of m(6)A residues in mammalian mRNA with single-nucleotide resolution. More than 70% of these residues are present in the 3'-most (last) exons, with a very sharp rise (sixfold) within 150-400 nucleotides of the start of the last exon. Two-thirds of last exon m(6)A and >40% of all m(6)A in mRNA are present in 3' untranslated regions (UTRs); contrary to earlier suggestions, there is no preference for location of m(6)A sites around stop codons. Moreover, m(6)A is significantly higher in noncoding last exons than in next-to-last exons harboring stop codons. We found that m(6)A density peaks early in the 3' UTR and that, among transcripts with alternative polyA (APA) usage in both the brain and the liver, brain transcripts preferentially use distal polyA sites, as reported, and also show higher proximal m(6)A density in the last exons. Furthermore, when we reduced m6A methylation by knocking down components of the methylase complex and then examined 661 transcripts with proximal m6A peaks in last exons, we identified a set of 111 transcripts with altered (approximately two-thirds increased proximal) APA use. Taken together, these observations suggest a role of m(6)A modification in regulating proximal alternative polyA choice.
Keywords: alternative polyadenylation; last exon; m6A-CLIP/IP; microRNA.
© 2015 Ke et al.; Published by Cold Spring Harbor Laboratory Press.
Figures
References
-
- Bernhardt D, Darnell JEJ. 1969. tRNA synthesis in HeLa cells: a precursor to tRNA and the effects of methionine starvation on tRNA synthesis. J Mol Biol 42: 43–56. - PubMed
-
- Bringmann P, Luhrmann R. 1987. Antibodies specific for N6-methyladenosine react with intact snRNPs U2 and U4/U6. FEBS Lett 213: 309–315. - PubMed
Publication types
MeSH terms
Substances
Associated data
- Actions
Grants and funding
LinkOut - more resources
Full Text Sources
Other Literature Sources
Molecular Biology Databases