. 2015 Sep 25;11(9):e1005535.
doi: 10.1371/journal.pgen.1005535. eCollection 2015.

Evaluating the Performance of Fine-Mapping Strategies at Common Variant GWAS Loci

Affiliations

Evaluating the Performance of Fine-Mapping Strategies at Common Variant GWAS Loci

Martijn van de Bunt et al. PLoS Genet. .

Abstract

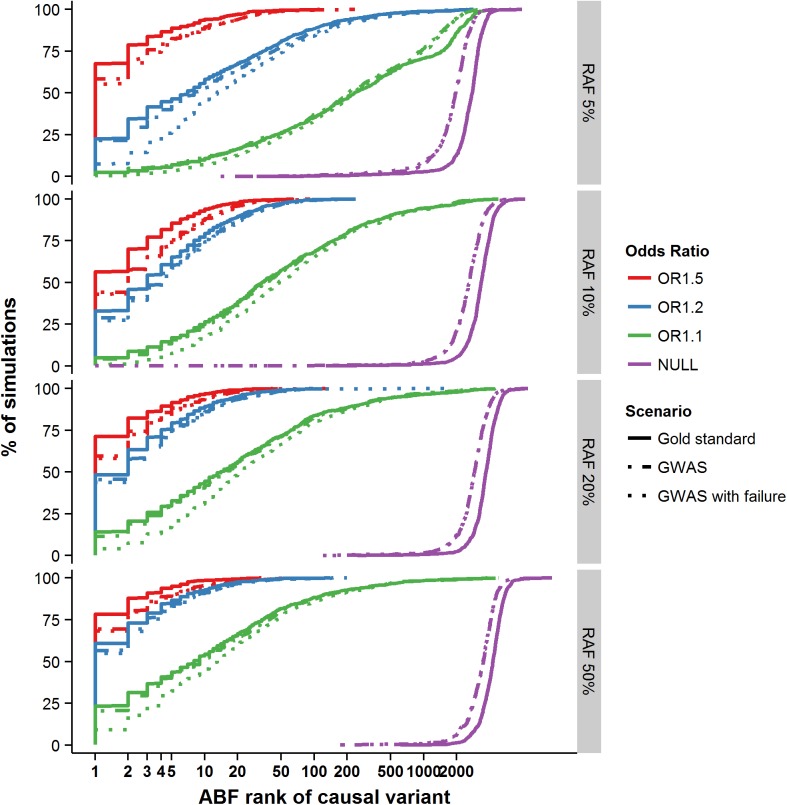
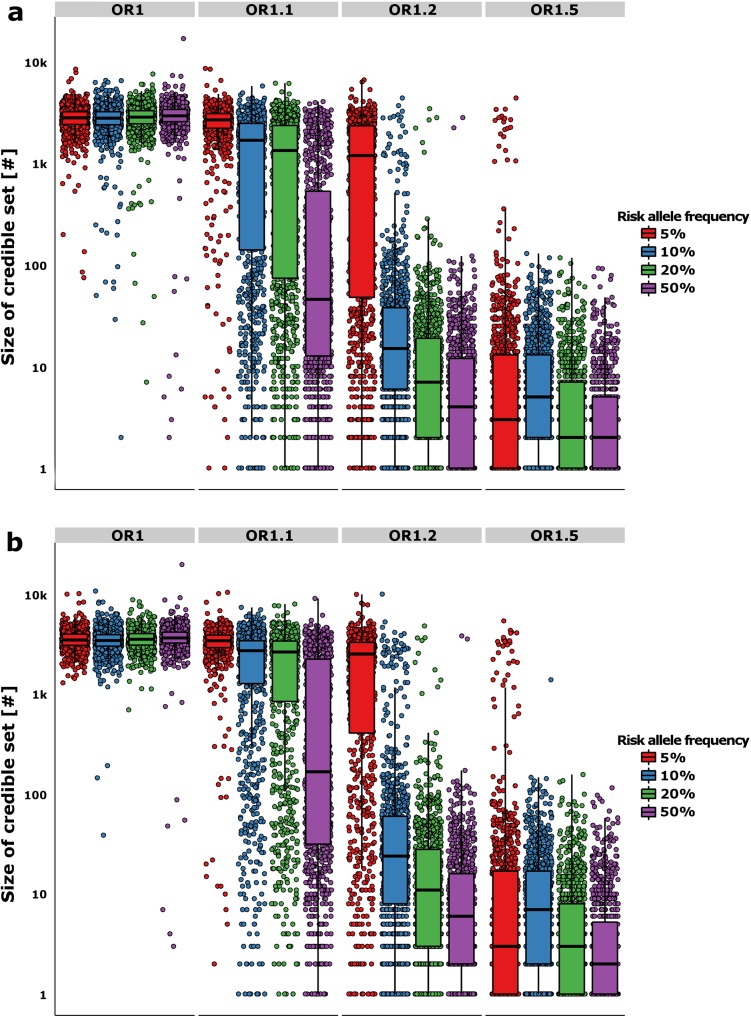
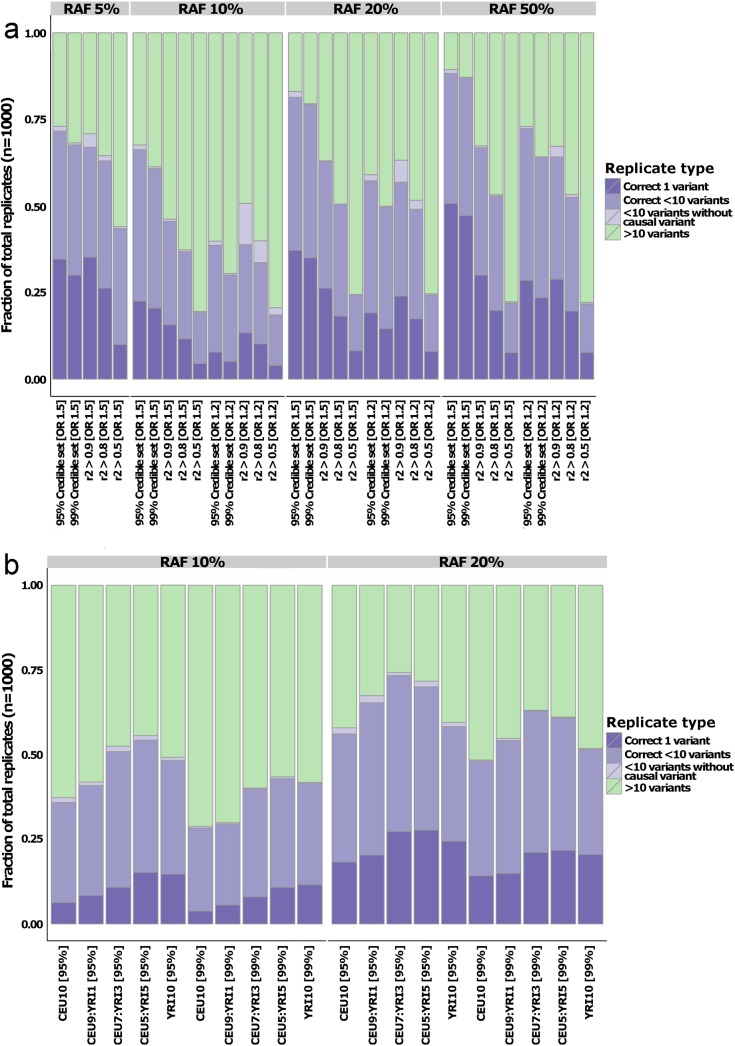
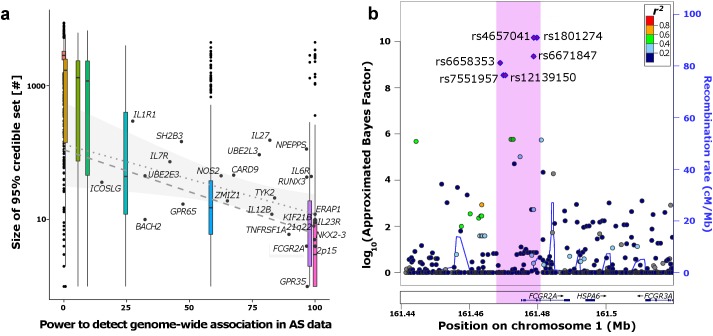
The growing availability of high-quality genomic annotation has increased the potential for mechanistic insights when the specific variants driving common genome-wide association signals are accurately localized. A range of fine-mapping strategies have been advocated, and specific successes reported, but the overall performance of such approaches, in the face of the extensive linkage disequilibrium that characterizes the human genome, is not well understood. Using simulations based on sequence data from the 1000 Genomes Project, we quantify the extent to which fine-mapping, here conducted using an approximate Bayesian approach, can be expected to lead to useful improvements in causal variant localization. We show that resolution is highly variable between loci, and that performance is severely degraded as the statistical power to detect association is reduced. We confirm that, where causal variants are shared between ancestry groups, further improvements in performance can be obtained in a trans-ethnic fine-mapping design. Finally, using empirical data from a recently published genome-wide association study for ankylosing spondylitis, we provide empirical confirmation of the behaviour of the approximate Bayesian approach and demonstrate that seven of twenty-six loci can be fine-mapped to fewer than ten variants.


Conflict of interest statement

The authors have declared that no competing interests exist.

Figures

Fig 1
Fig 1. Ranking of the causal variant across simulated loci.
Cumulative percentage of simulations (y-axis) with decreasing ranking of the causal variant amongst all variants in the regions (x-axis). Panels are split by risk allele frequency of the causal variant along the vertical axis.
Fig 2
Fig 2. Refinement of the credible sets.
The y-axis shows the number of variants in the 95% (a) and 99% (b) likely credible sets. The boxplots show the median and interquartile range of the simulations, while each point denotes a single “replicate”. The color of the boxplots/points denotes the RAF of the simulated causal variant, while each panel is split by the effect size along the horizontal plane.
Fig 3
Fig 3. Quantifying fine-mapping success.
Fraction of the simulations where the fine-mapped set is reduced to fewer than 10 variants for the comparison with r2-derived sets (a) and multi-ethnic study designs (b). Colors denote whether the set contains the causal variants and only one variant (dark purple), causal variant and fewer than 10 variants (medium purple), fewer than 10 variants but not the causal variant (light purple), or more than 10 variants (green). In both panels, the data is split by risk allele frequency (RAF) on the horizontal plane. Panel (a) is grouped by odds ratio (OR) on the x-axis, whereas the OR was set to 1.2 in all the multi-ethnic simulations.
Fig 4
Fig 4. Fine-mapping the ankylosing spondylitis (AS) regions.
a) Correlation between predicted power to detect genome-wide association signals and size of the 95% credible sets. Boxplots represent the distribution of the simulations at the respective power of each RAF/OR setting. The labelled dots show the distribution of the empirical AS data. Regression lines in the range of predicted power of the AS loci (15–99.9%) are derived from the simulations (dashed) and AS loci (dotted with confidence interval of regression line). b) Example FCGR2A region where the 99% credible set (purple dots) could be fine-mapped to a small region (pink) containing few variant.

References

    1. Dickson SP, Wang K, Krantz I, Hakonarson H, Goldstein DB (2010) Rare variants create synthetic genome-wide associations. PLoS Biol 8: e1000294 10.1371/journal.pbio.1000294 - DOI - PMC - PubMed
    1. Hunt KA, Mistry V, Bockett NA, Ahmad T, Ban M, et al. (2013) Negligible impact of rare autoimmune-locus coding-region variants on missing heritability. Nature 498: 232–235. 10.1038/nature12170 - DOI - PMC - PubMed
    1. Morris AP, Voight BF, Teslovich TM, Ferreira T, Segre AV, et al. (2012) Large-scale association analysis provides insights into the genetic architecture and pathophysiology of type 2 diabetes. Nat Genet 44: 981–990. 10.1038/ng.2383 - DOI - PMC - PubMed
    1. Abecasis GR, Auton A, Brooks LD, DePristo MA, Durbin RM, et al. (2012) An integrated map of genetic variation from 1,092 human genomes. Nature 491: 56–65. 10.1038/nature11632 - DOI - PMC - PubMed
    1. Cortes A, Hadler J, Pointon JP, Robinson PC, Karaderi T, et al. (2013) Identification of multiple risk variants for ankylosing spondylitis through high-density genotyping of immune-related loci. Nat Genet 45: 730–738. 10.1038/ng.2667 - DOI - PMC - PubMed

Publication types