

Regulators of gut motility revealed by a gnotobiotic model of diet-microbiome interactions related to travel
- PMID: 26406373
- PMCID: PMC4583712
- DOI: 10.1016/j.cell.2015.08.059
Regulators of gut motility revealed by a gnotobiotic model of diet-microbiome interactions related to travel
Erratum in
- Cell. 2015 Nov 5;163(4):1037
Abstract
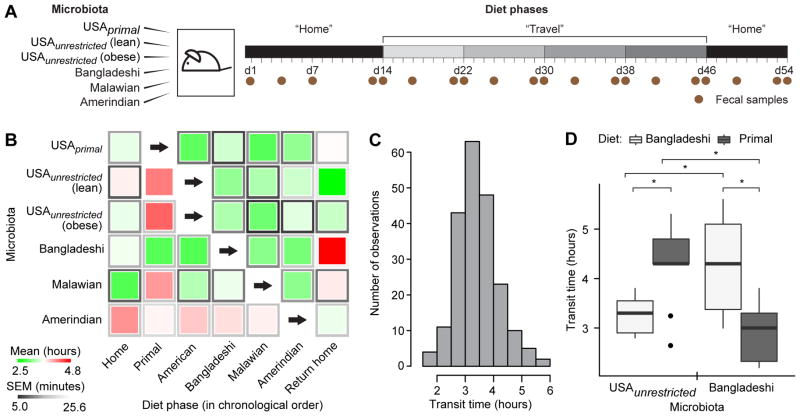
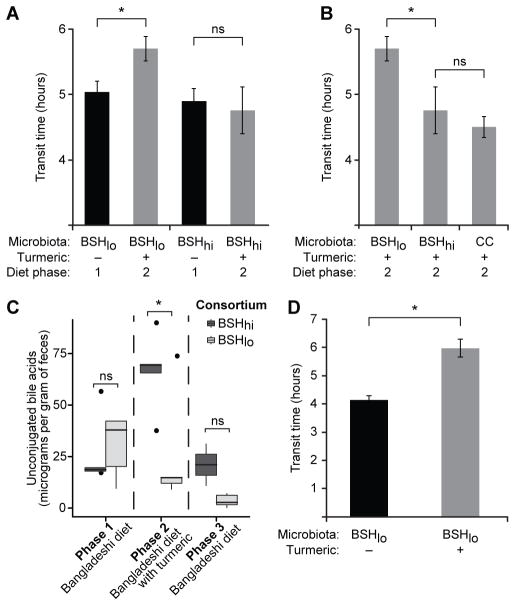
To understand how different diets, the consumers' gut microbiota, and the enteric nervous system (ENS) interact to regulate gut motility, we developed a gnotobiotic mouse model that mimics short-term dietary changes that happen when humans are traveling to places with different culinary traditions. Studying animals transplanted with the microbiota from humans representing diverse culinary traditions and fed a sequence of diets representing those of all donors, we found that correlations between bacterial species abundances and transit times are diet dependent. However, the levels of unconjugated bile acids-generated by bacterial bile salt hydrolases (BSH)-correlated with faster transit, including during consumption of a Bangladeshi diet. Mice harboring a consortium of sequenced cultured bacterial strains from the Bangladeshi donor's microbiota and fed a Bangladeshi diet revealed that the commonly used cholekinetic spice, turmeric, affects gut motility through a mechanism that reflects bacterial BSH activity and Ret signaling in the ENS. These results demonstrate how a single food ingredient interacts with a functional microbiota trait to regulate host physiology.
Copyright © 2015 Elsevier Inc. All rights reserved.
Figures
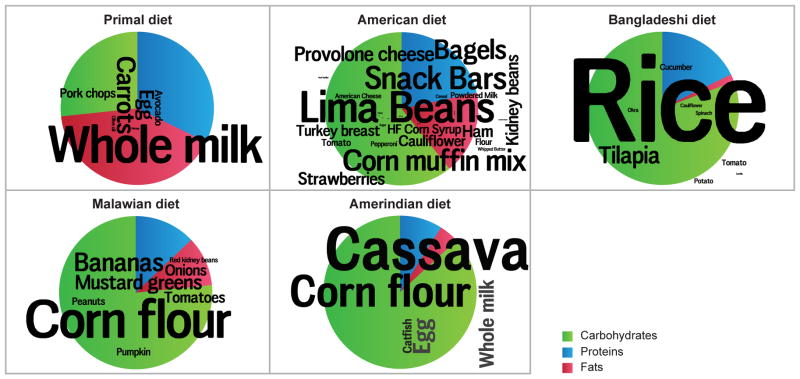
 unrestricted American diet
Bangladeshi diet
Malawian diet
Amerindian diet). (C) Histogram showing distribution of all transit times recorded throughout the 6-phase travel experiment. (D) The most contrasted diet-by-microbiota effects on transit times were observed in mice colonized with a Bangladeshi or USAunrestricted microbiota and fed Bangladeshi versus primal diets. Results for USAunrestricted (lean) and USAunrestricted (obese) were aggregated and are represented together as USAunrestricted. Results from the ‘home’ and ‘return home’ phases for mice colonized with a Bangladeshi microbiota and fed a Bangladeshi diet were also aggregated. Statistical significance was determined using a two-tailed Student’s t-test; *, p<0.05. See also Figures 1, 3, S1, S2 and Tables S1, S2, S3, S4, S5.
unrestricted American diet
Bangladeshi diet
Malawian diet
Amerindian diet). (C) Histogram showing distribution of all transit times recorded throughout the 6-phase travel experiment. (D) The most contrasted diet-by-microbiota effects on transit times were observed in mice colonized with a Bangladeshi or USAunrestricted microbiota and fed Bangladeshi versus primal diets. Results for USAunrestricted (lean) and USAunrestricted (obese) were aggregated and are represented together as USAunrestricted. Results from the ‘home’ and ‘return home’ phases for mice colonized with a Bangladeshi microbiota and fed a Bangladeshi diet were also aggregated. Statistical significance was determined using a two-tailed Student’s t-test; *, p<0.05. See also Figures 1, 3, S1, S2 and Tables S1, S2, S3, S4, S5.
Comment in
-
Microbiome: In transit.Nat Rev Microbiol. 2015 Nov;13(11):659. doi: 10.1038/nrmicro3572. Epub 2015 Oct 12. Nat Rev Microbiol. 2015. PMID: 26456926 No abstract available.
-
Gut microbiota: Culinary traditions-revealing the effect of travel and diet on gut microbiota and motility.Nat Rev Gastroenterol Hepatol. 2015 Nov;12(11):607. doi: 10.1038/nrgastro.2015.179. Epub 2015 Oct 13. Nat Rev Gastroenterol Hepatol. 2015. PMID: 26460353 No abstract available.
-
Eat Your Curry.Cell Host Microbe. 2015 Oct 14;18(4):385-7. doi: 10.1016/j.chom.2015.10.005. Cell Host Microbe. 2015. PMID: 26468739 Free PMC article.
References
-
- Burkitt DP, Walker ARP, Painter NS. Effect of dietary fibre on stools and the transit-times, and its role in the causation of disease. The Lancet. 1972;300:1408–1411. - PubMed
-
- Chase JM. Community assembly: when should history matter? Oecologia. 2003;136:489–498. - PubMed
-
- Chevreux B, Wetter T, Suhai S. Genome Sequence Assembly Using Trace Signals and Additional Sequence Information. Comput Sci Biol Proc Ger Conf Bioinforma GCB. 1999;99:45–56.
Publication types
MeSH terms
Substances
Grants and funding
LinkOut - more resources
Full Text Sources
Other Literature Sources
Medical
