. 2015 Sep 25;13(9):e1002258.
doi: 10.1371/journal.pbio.1002258. eCollection 2015.

HDAC1/2-Dependent P0 Expression Maintains Paranodal and Nodal Integrity Independently of Myelin Stability through Interactions with Neurofascins

Affiliations

HDAC1/2-Dependent P0 Expression Maintains Paranodal and Nodal Integrity Independently of Myelin Stability through Interactions with Neurofascins

Valérie Brügger et al. PLoS Biol. .

Abstract

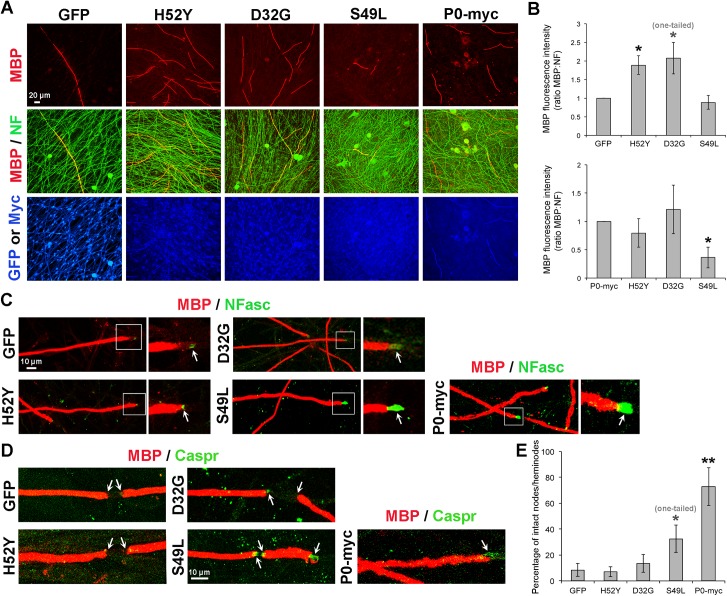
The pathogenesis of peripheral neuropathies in adults is linked to maintenance mechanisms that are not well understood. Here, we elucidate a novel critical maintenance mechanism for Schwann cell (SC)-axon interaction. Using mouse genetics, ablation of the transcriptional regulators histone deacetylases 1 and 2 (HDAC1/2) in adult SCs severely affected paranodal and nodal integrity and led to demyelination/remyelination. Expression levels of the HDAC1/2 target gene myelin protein zero (P0) were reduced by half, accompanied by altered localization and stability of neurofascin (NFasc)155, NFasc186, and loss of Caspr and septate-like junctions. We identify P0 as a novel binding partner of NFasc155 and NFasc186, both in vivo and by in vitro adhesion assay. Furthermore, we demonstrate that HDAC1/2-dependent P0 expression is crucial for the maintenance of paranodal/nodal integrity and axonal function through interaction of P0 with neurofascins. In addition, we show that the latter mechanism is impaired by some P0 mutations that lead to late onset Charcot-Marie-Tooth disease.


Conflict of interest statement

The authors have declared that no competing interests exist.

Figures

Fig 1
Fig 1. HDAC1/2 depletion in adult Schwann cells leads to motor and sensory dysfunction in peripheral nerves.
Immunofluorescence of HDAC1 (A, red) and neurofilament (NF, green) or HDAC2 (B, red) in sciatic nerve cryosections of control and dKO mice at 8 wk post-tamoxifen showing efficient loss of HDAC1 and HDAC2 in dKO sciatic nerves. Nuclei are labeled in blue with DAPI. Arrows show elongated nuclei (presumably SC nuclei) expressing HDAC1 (A, pink) or HDAC2 (B, pink) in control, but are devoid of HDAC1 (A, blue) or HDAC2 (B, blue) in dKO sciatic nerves. Images of dKO sciatic nerves where HDAC1/2 were ablated in 85% of SCs are shown. (C) Western blot of HDAC1 and HDAC2 and quantification normalized to GAPDH (loading control) in sciatic nerves of adult HDAC1/2 dKO mice compared to control littermates (Co), showing protein loss at 7 d post-tamoxifen in dKO sciatic nerve lysates. (D) Representative photograph of tail-suspension test at 6 wk post-tamoxifen showing abnormal hind limb crossing in dKO mice, while control littermates show normal extension reflex. (E) Rotarod test showing impaired motor performances and (F) hot plate test identifying reduced sensitivity to heat of dKO mice compared to control littermates at 8 wk post-tamoxifen. Gait analysis showing affected stride length (G) and base (H) in dKO mice compared to control littermates (average of ten steps per mouse). Three to six animals per group were used for each experiment. P-values (two-tailed unpaired Student's t test): * = p < 0.05, ** = p < 0.01, *** = p < 0.001, error bars = standard error of the mean (SEM).
Fig 2
Fig 2. Demyelination/remyelination and decreased P0 expression in dKO mice.
(A) Electron micrographs of ultrathin cross sections of control, dKO, H1HTZ, H2HTZ, H1KO, and H2KO sciatic nerves, at 8 wk post-tamoxifen, and percentage of demyelinated/remyelinated axons (3 animals per group, at least 700 axons counted per mouse), identifying a demyelination/remyelination phenotype in dKO sciatic nerves. Asterisks indicate demyelinated axons and “M” macrophages. (B) CD68 (green) immunofluorescence in longitudinal cryosections of control and dKO sciatic nerves labeled with DAPI (blue = nuclei) showing increased presence of macrophages in dKO sciatic nerves, consistent with the demyelination phenotype. Arrows indicate macrophages. (C) In situ hybridization (ISH) of P0 on longitudinal cryosections of control and dKO sciatic nerves identifying a reduction of P0 at the transcript level at 5 wk post-tamoxifen, before the onset of demyelination and when macrophages are not present in the nerve. Pictures on the right are magnifications of black boxes depicted on the left. Black arrows show SC nuclei. (D) Western blot of P0 and quantification normalized to GAPDH (loading control) in sciatic nerve lysates of control and dKO mice at 8 wk post-tamoxifen (3 mice per group), showing reduced P0 protein levels in dKO sciatic nerves. (E) Confocal images of MBP (magenta) and P0 (red) coimmunofluorescence in paraffin cross sections of dKO mice at 8 wk post-tamoxifen, showing reduced P0 levels in most myelin rings, while MBP levels remain high. Nuclei are labeled in blue by DAPI. A single optical section is shown. White arrows indicate MBP positive/P0 negative myelin rings, the yellow arrowhead shows an MBP/P0 double negative SC, and blue arrowheads MBP/P0 double positive myelin rings. Three animals per group were used for each experiment. P-values (two-tailed unpaired (A) or paired (D) Student's t test): * = p < 0.05, ** = p < 0.01, *** = p < 0.001, error bars = SEM.
Fig 3
Fig 3. Loss of neurofascins and Caspr in dKO mice.
(A) Western blots of Caspr, NFasc155, Contactin, NFasc186, and quantification normalized to the loading control β-actin or GAPDH on sciatic nerve lysates of dKO mice compared to control littermates (set at 100%) at 8 wk post-tamoxifen (three mice per group) identifying reduced levels of Caspr and neurofascins. Coimmunofluorescence of (B) Contactin (red) with Caspr (green) or (C) total neurofascins (green) with Kv1.2 (red) or (D) total neurofascins (green) with NFasc186 (red), and (E) magnifications of representative single nodal/paranodal structures, on longitudinal cryosections of control and dKO sciatic nerves at 8 wk post-tamoxifen, showing loss of Caspr in paranodes and of NFasc186 in nodes and mislocalization or loss of Kv1.2 in dKO sciatic nerves. Overlays appear yellow. Representative images of three control and three dKO mice are shown. Arrows show the position of nodes in B, D, and of Kv1.2 signal (in juxtaparanodes in control, and in paranodes or absence of signal in dKO) in C. In E, asterisks mark the position (lateral dimension) of the node of Ranvier. Scale bars = 5 μm. (F–G) Percentage of nodes lacking NFasc186 and paranodes lacking Caspr (F), and of normal, elongated, and abnormal (low intensity, asymmetric, irregular shape) paranodes based on NFasc staining in paranodes (G) in control and dKO nerves at 8 wk post-tamoxifen, demonstrating paranodal/nodal defects in dKO sciatic nerves. Three animals per group were used for each experiment. In F and G, 50 to 100 nodes/paranodes counted per animal, 180 to 230 counted per genotype. P-values (two-tailed paired (A) or unpaired (F,G) Student's t test): * = p < 0.05, ** = p < 0.01, *** = p < 0.001, error bars = SEM.
Fig 4
Fig 4. Detached paranodal loops and wider nodes in dKO.
Electron micrographs of ultrathin longitudinal control and dKO sciatic nerve sections at 8 wk post-tamoxifen showing in (A) paranodal loops attached to the axolemma and septate-like junctions (arrows) in control nerves, and detached paranodal loops devoid of septate-like junctions (arrows) in dKO nerves. In some dKO nodes, microvilli (highlighted in blue, image on the right) invaded the space between paranodal loops and the axolemma. Images on the right are magnifications of white boxes depicted on the left images. The graph representing the percentage of paranodes with detached loops in control and dKO demonstrates frequent occurrence of these defects in dKO sciatic nerves. Three animals per genotype were used, 11 to 38 paranodes were counted per animal, and 56 to 72 were counted per genotype. In (B), electron micrographs represent nodes of control (Ctr in the graph) and dKO nerves, and the quantification of nodal widths in the graph shows significant widening of the nodal region in dKO sciatic nerves. Three animals per genotype were used for quantification. The average width of 7 to 17 nodes of Ranvier was calculated per animal (n = 3), a total of 32 to 42 nodes were measured per genotype. Scale bars = 1 μm. In (A), error bar = SEM. In (B), the graph is a box plot where the lower box (Median − Quartile 1) and the upper box (Quartile 3 − Median) are separated by the Median value and flanked by top and bottom Whiskers. P-values (unpaired two-tailed Student's t test): *** = p < 0.001, n = 3.
Fig 5
Fig 5. P0 rescues myelination, Caspr, and neurofascins in plp-dKO DRG cultures.
Confocal coimmunofluorescence images of (A) MBP (red) and neurofilament (NF, green), or (C) P0 (red) and MBP (green), or (D) Caspr (red), total neurofascins (NFasc, green), and MBP (white), or (F) MBP (red), NF (white), and either GFP, P0, or Myc (green), or (H) Caspr (red) and NFasc186 (false-colored green) in myelinated control and plp -dKO DRG cultures with (A,C,D,F,H) or without (A) tamoxifen. Briefly, A–D demonstrate demyelination, loss of P0 and paranodal/nodal defects in plp -dKO DRG cultures, mimicking the in vivo phenotype of dKO sciatic nerves. In (F,H), plp -dKO DRG cultures were transduced with doxycycline-inducible lentiviruses expressing either GFP, P0, or P0-myc. (B,G) Quantification of MBP fluorescence intensity normalized to NF. (E,I) Percentage of intact nodes/paranodes expressing Caspr and high levels of NFasc. F–I show that exogenously delivered P0 significantly rescues demyelination and paranodal/ nodal defects of plp -dKO DRG cultures. In (C), white arrows indicate MBP positive/P0 negative fibers, and magenta arrowheads MBP/P0 double positive fibers. Merges MBP/P0 (C) or Caspr/NFasc (D) appear yellow. In (D), dashed lines delineate the paranodal region. In (H), control and plp -dKO were transduced with lentiviruses expressing GFP, and plp -dKO + P0 with lentiviruses expressing P0 (white). Z-series projections (A,C,F) and single optical sections (D,H) are shown. In (D,H), arrows indicate heminodes or full nodes. Images on the right are magnifications of white boxes depicted on the left images. At least three control and three plp -dKO embryos were used for quantification (average of three coverslips per embryos), representative images are shown. Nuclei are labeled in blue with DAPI. P-values (unpaired [B,E,I] or paired [G] two-tailed Student's t test, unless stated otherwise in the figure): * = p < 0.05, *** = p < 0.001, error bars = SEM.
Fig 6
Fig 6. P0 is present in internodes, paranodes, and nodes of Ranvier of the PNS.
Confocal images (z-series projections) of (A) P0 (green) or Alexa Fluor 488-AffiniPure Goat Anti-chicken IgG (2ndary AB) as negative control and total neurofascins (NFasc, red) coimmunofluorescence or (B) P0 (green), total NFasc (red) and NFasc186 (blue), or (C) P0 (green), Contactin (CNTN, red), and NFasc186 (blue) coimmunofluorescence on longitudinal cryosections (5-μm thick) of wild type (A,B) or P0 KO and control littermate (C) adult (3 months old in A,B; 10 months old in C) mouse sciatic nerves. These stainings show robust P0 signal in internodal, paranodal, and nodal regions of wild type and control sciatic nerves, while no P0 signal is detected in P0KO sciatic nerves, demonstrating the specificity of the P0 antibody used. 3-D reconstruction by Imaris software of (D) P0 (green) and total NFasc (red) coimmunofluorescence and (E) P0 (green), total NFasc (red) and NFasc186 (blue) coimmunofluorescence in wild type nerves, showing colocalization of P0 with neurofascins. Interestingly, there is no visible gap between NFasc155 and NFasc186 signals. A 3-D transversal view (D) and 3-D longitudinal views (D,E) are shown together with schematic representations of optical cuts through the structure and the angle of view (schematic eye) above each 3-D image. Surfaces of P0 and total NFasc (D) or of P0, total NFasc and NFasc186 (E) are represented in combination with volumes (raw staining signal) of total NFasc (D, red punctuated staining) or NFasc186 (E, blue punctuated staining). Six paranodes/nodes have been analyzed by 3-D reconstruction and representative images are shown. (F) P0 detection by immunoelectron microscopy using ultrasmall gold particles plus silver enhancement carried out on whole adult mouse sciatic nerves before embedding and sectioning. Immunogold density is low using this protocol, but specific to compact myelin, paranodes (arrows) and microvilli. Scale bars = 200 nm. Images on the right are magnifications of dashed-line boxes depicted on left images. Sciatic nerves of three wild-type mice were analyzed and representative pictures are shown. Quantification of the number of gold particles per μm (longitudinal length) found in paranodal loops, microvilli, or myelin shows significant P0 staining in these structures compared to associated axons (background staining), with most abundant signal in myelin sheaths, followed by microvilli and then paranodal loops. Thirteen paranodes, 15 microvilli, 6 myelin sheaths, and 24 associated axons were quantified. No gold particles were found labeling endoneurial fibroblasts or nonmyelinating SCs associated with small caliber axons. P-values (unpaired two-tailed Student's t test, unless stated otherwise in the figure): + = p < 0.05, ++ = p < 0.01, *** = p < 0.001 (asterisks show significance compared to axons), error bars = SEM.
Fig 7
Fig 7. P0 interacts with neurofascins.
(A–E) Adhesion assay in HEK293T cells showing homophilic adhesion of P0 extracellular domain, as well as binding to the extracellular domain of NFasc155 and NFasc186. Confocal images of P0-Fc or control-Fc (Neg-Fc) particles (green, or false-colored green for Contactin-GFP) and Myc (A, red), neurofascins (B and C, red), Caspr (D, red), or Contactin (E, red) coimmunofluorescence and GFP fluorescence (E, false-colored turquoise; right side of the panel) in HEK293T cells expressing P0-Myc (A), NFasc155 (B), NFasc186 (C), Caspr (D) or Contactin-GFP (E), indicated by arrows. Overlays appear yellow. Nuclei are labeled in blue with DAPI. Single optical sections are shown. Each experiment was done at least three times and representative pictures are shown. (F) Immunoprecipitation (IP) IgY (negative control with chicken IgY) and IP P0 (with chicken anti-P0 antibody) from adult dKO and control littermate sciatic nerve lysates and detection with pan-NFasc antibody, and western blot for total NFasc on a 10% acrylamide SDS-Page gel, and reblot of immunoprecipitations (IPs) and western blot with P0 antibody. GAPDH western blot on lysates used for IgY and P0 IPs shows input. The band marked by an asterisk is most likely nonspecific. The graphs showing the quantification of coimmunoprecipitated (IPed) NFasc186 or NFasc155 with P0 (normalized to GAPDH input and calculated as fold change compared to IgY IP which was set to 1) in sciatic nerves of three dKO and three control littermate mice at 8 wk post-tamoxifen indicate that binding of P0 to neurofascins occurs in vivo in sciatic nerves of wild type mice, but is largely lost in dKO mice. Both sciatic nerves of each animal were pooled and split into two equal volumes for each IP IgY and P0. P-values (unpaired two-tailed Student's t test): * = p < 0.05, ** = p < 0.01, error bars = SEM.
Fig 8
Fig 8. The four P0 mutations D6Y, D32G, H52Y and S49L result in three different binding profiles to neurofascins: preserved (S49L), impaired binding to NFasc155 (D32G), impaired binding to both NFasc (D6Y and H52Y), while binding to P0 is maintained for all mutants.
Adhesion assay in HEK293T cells. Confocal images of P0-Fc, P0-D6Y-Fc, P0-D32G-Fc, P0-H52Y-Fc, P0-S49L-Fc or control-Fc (Neg-Fc) particles (green) and neurofascins or Myc (red) coimmunofluorescence in HEK293T cells expressing P0-myc (A), NFasc155 (B) or NFasc186 (C), indicated by arrows. Overlays appear yellow. Nuclei are labeled in blue with DAPI. Single optical sections are shown. At least three independent experiments were analyzed for each panel and representative pictures are shown.
Fig 9
Fig 9. In contrast to the S49L P0 mutant, D32G and H52Y P0 mutants rescue myelination of HDAC1/2 plp-dKO DRG but not paranodal/nodal integrity.
Coimmunofluorescence of MBP (red) and (A) neurofilament (NF, green), and Myc or GFP fluorescence (blue), or (C) neurofascins (NFasc, green), or (D) Caspr (green) in myelinated HDAC1/2 plp-dKO DRG cultures transduced with lentiviruses expressing either GFP, H52Y-myc, D32G-myc, S49L-myc or P0-myc, and treated with tamoxifen for 10 d after completion of myelination. A–B show that H52Y and D32G but not S49L P0 mutants are able to rescue myelination of plp-dKO DRG cultures, similarly to P0-myc, and C–D show that S49L, but not H52Y or D32G, P0 mutant is able to partially rescue paranodal/nodal defects of plp-dKO DRG cultures. In (C), pictures on the right are magnifications of the white boxes depicted on left images. Arrows indicate paranodes/nodes. In (B), quantification of MBP fluorescence intensity normalized to NF and compared to GFP or P0-myc (set to 1). DRG of six plp-dKO embryos were quantified (three plp-dKO embryos per graph, four coverslips per plp-dKO). In (C,D), DRG of three plp-dKO embryos were analyzed and representative pictures are shown. In (E), the graph represents the percentage of intact (Caspr-positive or high NFasc levels) nodes and heminodes. DRG of three plp-dKO embryos were quantified, four coverslips per plp-dKO, 80 to 300 nodes/heminodes counted per plp-dKO per virus. P-values (paired (B) and unpaired (E) two-tailed (unless stated otherwise in the figure) Student's t test): * = p < 0.05, ** = p < 0.01, error bars = SEM.

References

    1. Craner MJ, Newcombe J, Black JA, Hartle C, Cuzner ML, Waxman SG. Molecular changes in neurons in multiple sclerosis: altered axonal expression of NaV1.2 and NaV1.6 sodium channels and Na+/Ca+ exchanger. Proc Natl Acad Sci USA. 2004;101: 8168–8173. - PMC - PubMed
    1. Mathey EK, Derfuss T, Storch MK, Williams KR, Hales K, Woolley DR, et al. Neurofascin as a novel target for autoantibody-mediated axonal injury. J Exp Med. 2007;204: 2363–2372. - PMC - PubMed
    1. Susuki K, Rasband MN, Tohyama K, Koibuchi K, Okamoto S, Funakoshi K, et al. Anti-GM1 antibodies cause complement-mediated disruption of sodium channel clusters in peripheral motor nerve fibers. J Neurosci. 2007;27: 3956–3967. - PMC - PubMed
    1. Devaux JJ, Odaka M, Yuki N. Nodal proteins are target antigens in Guillain-Barré syndrome. J Peripher Nerv Syst. 2012;17: 62–71. 10.1111/j.1529-8027.2012.00372.x - DOI - PubMed
    1. Meadows LS, Malhotra J, Loukas A, Thyagarajan V, Kazen-Gillespie KA, Koopman MC, et al. Functional and biochemical analysis of a sodium channel beta1 subunit mutation responsible for generalized epilepsy with febrile seizures plus type 1. J Neurosci. 2002;22: 10699–10709. - PMC - PubMed

Publication types

MeSH terms