

Dynamics of Competition between Subnetworks of Spiking Neuronal Networks in the Balanced State
- PMID: 26407178
- PMCID: PMC4583999
- DOI: 10.1371/journal.pone.0138947
Dynamics of Competition between Subnetworks of Spiking Neuronal Networks in the Balanced State
Abstract
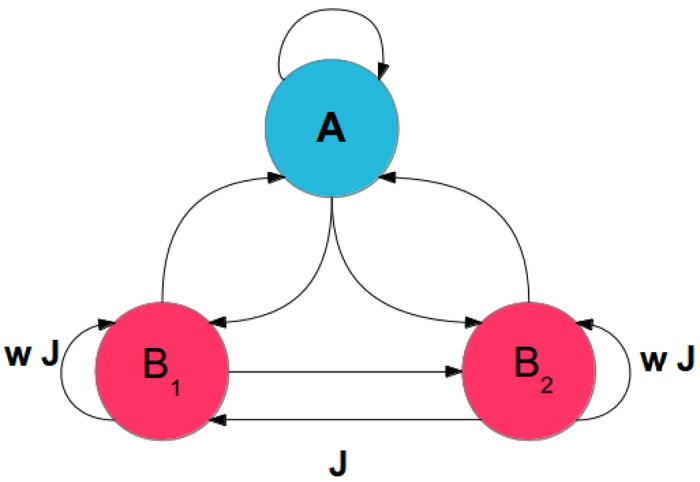
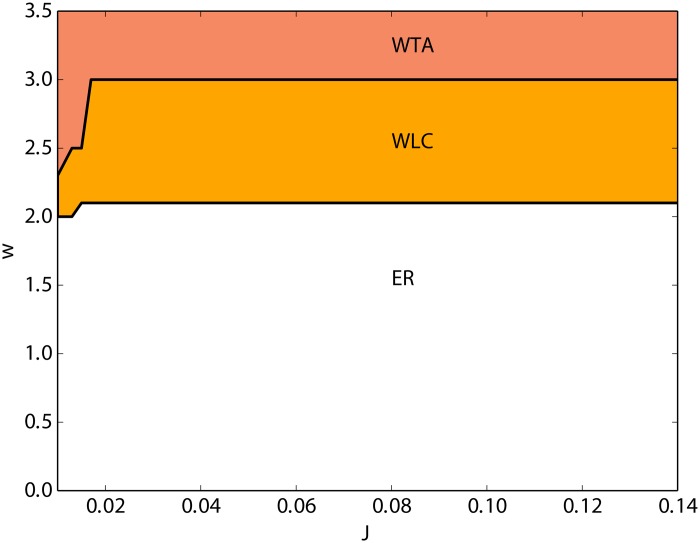
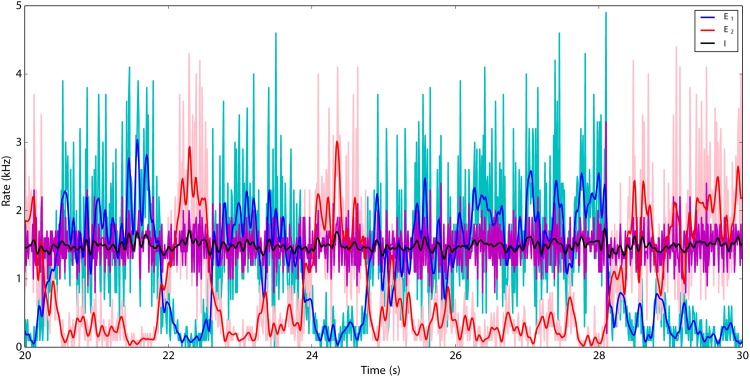
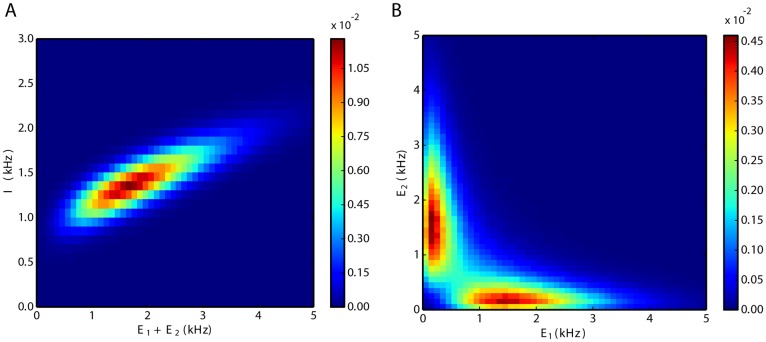
We explore and analyze the nonlinear switching dynamics of neuronal networks with non-homogeneous connectivity. The general significance of such transient dynamics for brain function is unclear; however, for instance decision-making processes in perception and cognition have been implicated with it. The network under study here is comprised of three subnetworks of either excitatory or inhibitory leaky integrate-and-fire neurons, of which two are of the same type. The synaptic weights are arranged to establish and maintain a balance between excitation and inhibition in case of a constant external drive. Each subnetwork is randomly connected, where all neurons belonging to a particular population have the same in-degree and the same out-degree. Neurons in different subnetworks are also randomly connected with the same probability; however, depending on the type of the pre-synaptic neuron, the synaptic weight is scaled by a factor. We observed that for a certain range of the "within" versus "between" connection weights (bifurcation parameter), the network activation spontaneously switches between the two sub-networks of the same type. This kind of dynamics has been termed "winnerless competition", which also has a random component here. In our model, this phenomenon is well described by a set of coupled stochastic differential equations of Lotka-Volterra type that imply a competition between the subnetworks. The associated mean-field model shows the same dynamical behavior as observed in simulations of large networks comprising thousands of spiking neurons. The deterministic phase portrait is characterized by two attractors and a saddle node, its stochastic component is essentially given by the multiplicative inherent noise of the system. We find that the dwell time distribution of the active states is exponential, indicating that the noise drives the system randomly from one attractor to the other. A similar model for a larger number of populations might suggest a general approach to study the dynamics of interacting populations of spiking networks.
Conflict of interest statement
Figures
Similar articles
-
Mean-driven and fluctuation-driven persistent activity in recurrent networks.Neural Comput. 2007 Jan;19(1):1-46. doi: 10.1162/neco.2007.19.1.1. Neural Comput. 2007. PMID: 17134316
-
Bifurcation analysis of the dynamics of interacting subnetworks of a spiking network.Sci Rep. 2019 Aug 6;9(1):11397. doi: 10.1038/s41598-019-47190-9. Sci Rep. 2019. PMID: 31388027 Free PMC article.
-
A Markov model for the temporal dynamics of balanced random networks of finite size.Front Comput Neurosci. 2014 Dec 3;8:142. doi: 10.3389/fncom.2014.00142. eCollection 2014. Front Comput Neurosci. 2014. PMID: 25520644 Free PMC article.
-
Associative memory in networks of spiking neurons.Neural Netw. 2001 Jul-Sep;14(6-7):825-34. doi: 10.1016/s0893-6080(01)00064-8. Neural Netw. 2001. PMID: 11665774 Review.
-
Finite-size and correlation-induced effects in mean-field dynamics.J Comput Neurosci. 2011 Nov;31(3):453-84. doi: 10.1007/s10827-011-0320-5. Epub 2011 Mar 8. J Comput Neurosci. 2011. PMID: 21384156 Review.
Cited by
-
Winnerless competition in clustered balanced networks: inhibitory assemblies do the trick.Biol Cybern. 2018 Apr;112(1-2):81-98. doi: 10.1007/s00422-017-0737-7. Epub 2017 Oct 26. Biol Cybern. 2018. PMID: 29075845 Free PMC article.
-
Antifragile control systems in neuronal processing: a sensorimotor perspective.Biol Cybern. 2025 Feb 15;119(2-3):7. doi: 10.1007/s00422-025-01003-7. Biol Cybern. 2025. PMID: 39954086 Free PMC article. Review.
-
Structural influences on synaptic plasticity: The role of presynaptic connectivity in the emergence of E/I co-tuning.PLoS Comput Biol. 2024 Oct 31;20(10):e1012510. doi: 10.1371/journal.pcbi.1012510. eCollection 2024 Oct. PLoS Comput Biol. 2024. PMID: 39480889 Free PMC article.
-
A connectome manipulation framework for the systematic and reproducible study of structure-function relationships through simulations.Netw Neurosci. 2025 Mar 5;9(1):207-236. doi: 10.1162/netn_a_00429. eCollection 2025. Netw Neurosci. 2025. PMID: 40161987 Free PMC article.
-
Geometry and dynamics of representations in a precisely balanced memory network related to olfactory cortex.Elife. 2025 Jan 13;13:RP96303. doi: 10.7554/eLife.96303. Elife. 2025. PMID: 39804831 Free PMC article.
References
-
- Song S, Sjöström PJ, Reigl M, Nelson S, Chklovskii DB. Highly nonrandom features of synaptic connectivity in local cortical circuits. PLoS biology. 2005. March;3(3):e68 Available from: http://www.pubmedcentral.nih.gov/articlerender.fcgi?artid=1054880&tool=p... 10.1371/journal.pbio.0030068 - DOI - PMC - PubMed
-
- Perin R, Berger TK, Markram H. A synaptic organizing principle for cortical neuronal groups. Proceedings of the National Academy of Sciences of the United States of America. 2011. March;108(13):5419–24. Available from: http://www.pubmedcentral.nih.gov/articlerender.fcgi?artid=3069183&tool=p... 10.1073/pnas.1016051108 - DOI - PMC - PubMed
-
- Litwin-Kumar A, Doiron B. Formation and maintenance of neuronal assemblies through synaptic plasticity. Nature Communications. 2014;5(May):5319 Available from: http://www.nature.com/doifinder/10.1038/ncomms6319 10.1038/ncomms6319 - DOI - DOI - PubMed
Publication types
MeSH terms
LinkOut - more resources
Full Text Sources
Other Literature Sources
