. 2015 Sep 25:16:209.
doi: 10.1186/s13059-015-0769-z.

Deep sequencing and de novo assembly of the mouse oocyte transcriptome define the contribution of transcription to the DNA methylation landscape

Affiliations

Deep sequencing and de novo assembly of the mouse oocyte transcriptome define the contribution of transcription to the DNA methylation landscape

Lenka Veselovska et al. Genome Biol. .

Erratum in

Abstract

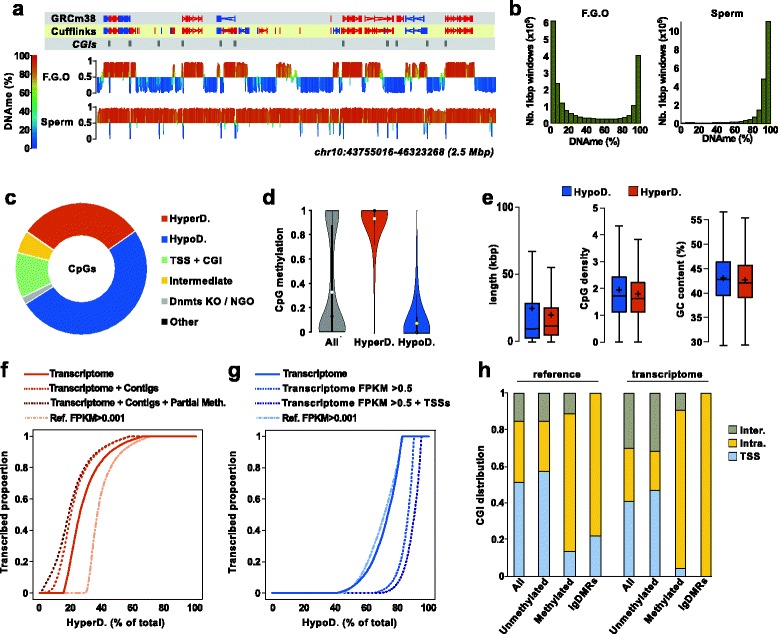
Background: Previously, a role was demonstrated for transcription in the acquisition of DNA methylation at imprinted control regions in oocytes. Definition of the oocyte DNA methylome by whole genome approaches revealed that the majority of methylated CpG islands are intragenic and gene bodies are hypermethylated. Yet, the mechanisms by which transcription regulates DNA methylation in oocytes remain unclear. Here, we systematically test the link between transcription and the methylome.

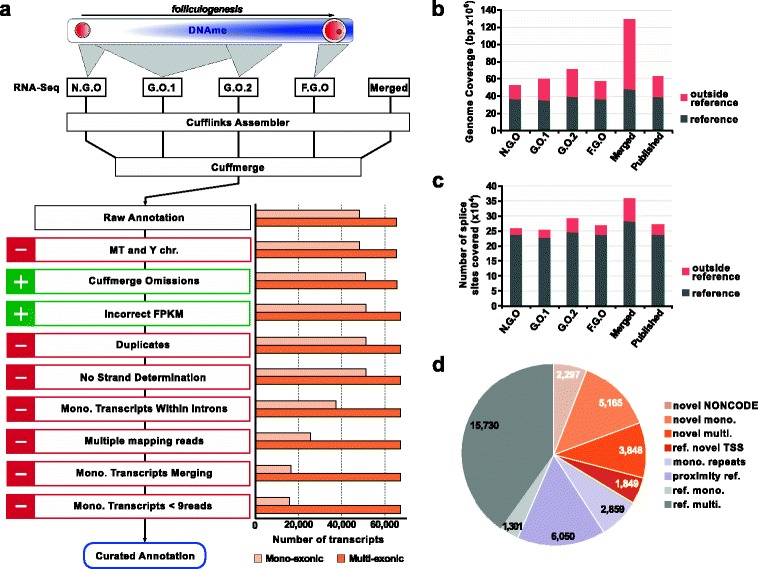
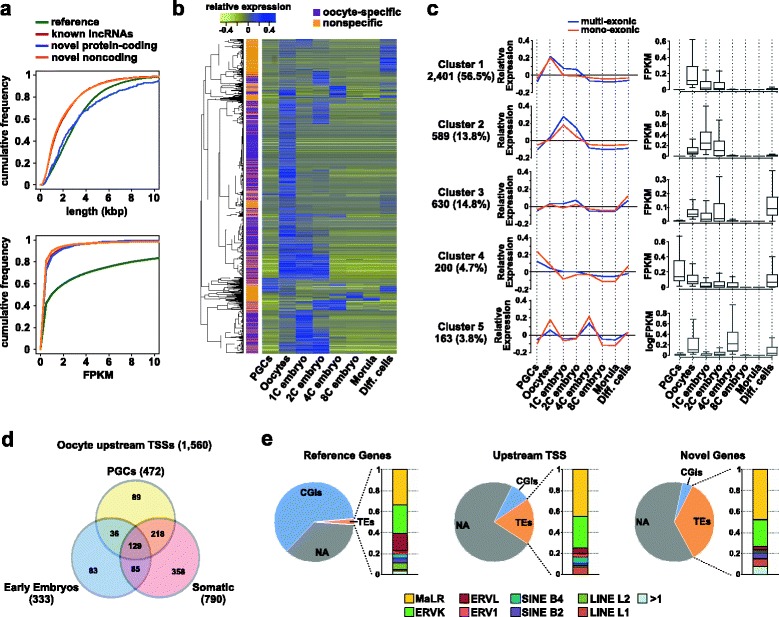
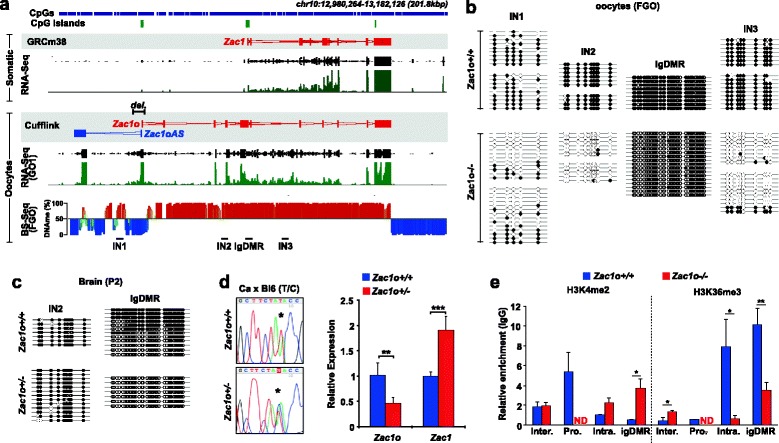
Results: We perform deep RNA-Seq and de novo transcriptome assembly at different stages of mouse oogenesis. This reveals thousands of novel non-annotated genes, as well as alternative promoters, for approximately 10 % of reference genes expressed in oocytes. In addition, a large fraction of novel promoters coincide with MaLR and ERVK transposable elements. Integration with our transcriptome assembly reveals that transcription correlates accurately with DNA methylation and accounts for approximately 85-90 % of the methylome. We generate a mouse model in which transcription across the Zac1/Plagl1 locus is abrogated in oocytes, resulting in failure of DNA methylation establishment at all CpGs of this locus. ChIP analysis in oocytes reveals H3K4me2 enrichment at the Zac1 imprinted control region when transcription is ablated, establishing a connection between transcription and chromatin remodeling at CpG islands by histone demethylases.

Conclusions: By precisely defining the mouse oocyte transcriptome, this work not only highlights transcription as a cornerstone of DNA methylation establishment in female germ cells, but also provides an important resource for developmental biology research.


Figures

Fig. 1
Fig. 1
Oocyte transcriptome assembly. a Overview of the strategy used for the oocyte transcriptome assembly, with the different oocyte stages sequenced in relation to DNAme establishment (top), the curations made to the raw Cufflinks annotation (bottom left) and the corresponding changes in transcript numbers (bottom right). b Fraction of the genome covered by at least five non-redundant reads in our datasets, our merged datasets (Merged) and the merged published oocyte RNA-Seq datasets (Published; Table S2 in Additional file 2). c Number of reference splice sites covered by at least five non-redundant reads in our datasets, our merged datasets (Merged) and the merged published oocyte RNA-Seq datasets (Published). d Composition of the oocyte transcriptome: novel NONCODE corresponding to non-reference transcripts present in the NONCODEv4 database (±5 kbp); ref. novel TSS corresponding to reference transcripts for which an upstream TSS active in oocytes has been identified; mono. repeats corresponding to mono-exonic transcripts matching expressed TEs; proximity ref. corresponding to transcripts within 1 kbp or 5 kbp of reference genes for multi-exonic and mono-exonic transcripts, respectively. FPKM fragments per kilobase of transcript per million mapped reads
Fig. 2
Fig. 2
Characteristics of the novel oocyte genes identified. a Cumulative distributions of length and FPKM values of oocyte transcripts matching the reference annotation, known long ncRNAs (lncRNAs), and novel transcripts with and without protein-coding potential. b Hierarchical clustering of novel oocyte genes according to their relative expression (mean centred, log transformed FPKM, merged datasets) in oocytes versus PGCs, pre-implantation embryos, embryonic stemm cells, mouse embryonic fibroblasts and adult somatic tissues (Diff. cells) (see Table S2 in Additional file 2 for the full list of datasets). c Relative (left) and absolute (right) expression levels of novel oocyte genes in the largest clusters identified. The number of genes and corresponding percentages are indicated under each cluster. Expression values are log transformed FPKM. d Pie charts representing the proportion of TSSs overlapping CGIs, TEs or neither (NA) for reference genes, novel upstream TSSs of reference genes and novel genes. For each category, the proportion of each TE family is displayed as a bar graph. e Venn diagram representing the numbers of upstream TSSs of reference genes identified in our transcriptome assembly, in PGCs, early embryos and somatic tissues
Fig. 3
Fig. 3
Oocyte methylome and correlation with transcriptome. a Visualization of the DNAme landscapes of FGOs and sperm using 2-kbp running genomic windows with a 1-kbp step. Quantification is absolute percentage of DNAme, with the x-axis set at 50 % methylation. b Distribution of 1-kbp genomic windows in FGOs and sperm according to their percentage of DNAme. c Distribution of genomic CpGs according to the following features: HyperDs and HypoDs, TSSs and CGIs, regions with intermediate methylation (25–75 %), regions with >50 % DNAme in DNMT knock-outs (Dnmts KO) and NGOs, and none of the above (Other). d Violin plot representation of DNAme of CpGs in FGOs in the entire genome (All) and in HyperDs and HypoDs (open circles represent the mean, dark circles the median, and black line the 1.5 × interquartile range). e Boxplot representation of the distribution of length, CpG density and GC content within HyperDs and HypoDs (lines represent the median and crosses the mean). f HyperDs ordered according to their increasing overlap with transcription in oocytes, based on the expressed reference genes (Ref. FPKM > 0.001), our transcriptome assembly, our assembly combined with read contigs, our assembly/contig combined with transcribed regions of partial DNAme (>25 %) in DNMT KOs and NGOs. g HypoDs ordered according to their increasing overlap with transcription in oocytes, based on the expressed reference genes (Ref. FPKM > 0.001), our transcriptome assembly, our assembly excluding genes with FPKM ≤ 0.5 alone or including also alternative TSSs. h Genomic location of CGIs and igDMRs in relation to expressed genes in the reference annotation and our oocyte transcriptome assembly
Fig. 4
Fig. 4
Transcription is required for DNAme targeting at the Zac1 locus. a Visualization of the Zac1 transcripts in somatic tissues (top) and in oocytes (bottom), as well as the DNAme landscape at this locus in FGOs. Deletion of Zac1o promoter is indicated by del. above the Cufflinks annotation, and below the DNAme profile are indicated the regions (IN1, IN2, IN3, igDMR) that are subsequently assessed for DNAme in (b, c). b DNAme status of Zac1 igDMR and Zac1o/Zac1oAS intragenic regions in Zac1o+/+ and Zac1o−/− FGOs. DNAme was assessed by bisulfite sequencing (BS-PCR) and each line represents an individual unique clone, with open circles representing unmethylated CpGs and closed circles methylated CpGs. c DNAme (BS-PCR) status of the Zac1 igDMR and Zac1o IN2 intragenic region in Zac1o+/+ and Zac1o+/− neonatal (postnatal day 2 (P2)) brain. d Sequence traces (left) of RT-PCR products from neonatal brain from Castaneus crosses to Zac1o+/+ and Zac1o−/−; the asterisk indicates the T/C single-nucleotide polymorphism. Zac1o and Zac1 expression assessed by quantitative RT-PCR (right) in Zac1o+/+ and Zac1o+/− neonatal brain (***p < 0.001, **p < 0.01, Student’s t-test). e ChIP-quantitative PCR quantification of H3K4me2 and H3K36me3 enrichment in growing oocytes (15 dpp) at Zac1 igDMR, Zac1o intragenic regions and Zac1o intergenic regions (ND non-determined, *p < 0.05, **p < 0.01 Student’s t-test)

References

    1. Seisenberger S, Peat JR, Hore TA, Santos F, Dean W, Reik W. Reprogramming DNA methylation in the mammalian life cycle: building and breaking epigenetic barriers. Philos Trans R Soc Lond B Biol Sci. 2012;368:20110330–0. doi: 10.1098/rstb.2011.0330. - DOI - PMC - PubMed
    1. Smallwood SA, Kelsey G. De novo DNA methylation: a germ cell perspective. Trends Genet. 2012;28:33–42. doi: 10.1016/j.tig.2011.09.004. - DOI - PubMed
    1. Ferguson-Smith AC. Genomic imprinting: the emergence of an epigenetic paradigm. Nat Rev Genet. 2011;12:565–575. doi: 10.1038/nrg3032. - DOI - PubMed
    1. Kobayashi H, Sakurai T, Imai M, Takahashi N, Fukuda A, Yayoi O, et al. Contribution of intragenic DNA methylation in mouse gametic DNA methylomes to establish oocyte-specific heritable marks. PLoS Genet. 2012;8:e1002440. doi: 10.1371/journal.pgen.1002440. - DOI - PMC - PubMed
    1. Smallwood SA, Tomizawa S-I, Krueger F, Ruf N, Carli N, Segonds-Pichon A, et al. Dynamic CpG island methylation landscape in oocytes and preimplantation embryos. Nat Genet. 2011;43:811–814. doi: 10.1038/ng.864. - DOI - PMC - PubMed

Publication types