. 2015 Nov 13;290(46):27791-802.
doi: 10.1074/jbc.M115.684084. Epub 2015 Sep 25.

Truncated Amyloid-β(11-40/42) from Alzheimer Disease Binds Cu2+ with a Femtomolar Affinity and Influences Fiber Assembly

Affiliations

Truncated Amyloid-β(11-40/42) from Alzheimer Disease Binds Cu2+ with a Femtomolar Affinity and Influences Fiber Assembly

Joseph D Barritt et al. J Biol Chem. .

Abstract

Alzheimer disease coincides with the formation of extracellular amyloid plaques composed of the amyloid-β (Aβ) peptide. Aβ is typically 40 residues long (Aβ(1-40)) but can have variable C and N termini. Naturally occurring N-terminally truncated Aβ(11-40/42) is found in the cerebrospinal fluid and has a similar abundance to Aβ(1-42), constituting one-fifth of the plaque load. Based on its specific N-terminal sequence we hypothesized that truncated Aβ(11-40/42) would have an elevated affinity for Cu(2+). Various spectroscopic techniques, complemented with transmission electron microscopy, were used to determine the properties of the Cu(2+)-Aβ(11-40/42) interaction and how Cu(2+) influences amyloid fiber formation. We show that Cu(2+)-Aβ(11-40) forms a tetragonal complex with a 34 ± 5 fm dissociation constant at pH 7.4. This affinity is 3 orders of magnitude tighter than Cu(2+) binding to Aβ(1-40/42) and more than an order of magnitude tighter than that of serum albumin, the extracellular Cu(2+) transport protein. Furthermore, Aβ(11-40/42) forms fibers twice as fast as Aβ(1-40) with a very different morphology, forming bundles of very short amyloid rods. Substoichiometric Cu(2+) drastically perturbs Aβ(11-40/42) assembly, stabilizing much longer fibers. The very tight fm affinity of Cu(2+) for Aβ(11-40/42) explains the high levels of Cu(2+) observed in Alzheimer disease plaques.

Keywords: Alzheimer disease; affinity; albumin; amyloid; amyloid-β (AB); circular dichroism (CD); coordination; copper; fiber kinetics; metal ion-protein interaction.


Figures

FIGURE 1.
FIGURE 1.
β- and β′-secretase processing of APP. The β′ activity of the β-site amyloid precursor protein cleaving enzyme 1 (BACE-1) N-terminally truncates Aβ before Glu11. γ-Secretase cleaves the C terminus most commonly at position 40 or 42, within the lipid bilayer. The α-secretase produces P3, which starts at Lys-17. The percentages of typical Aβ plaque load are also indicated; 19% for Aβ(11–40/42).
FIGURE 2.
FIGURE 2.
(11–40) and Aβ(11–42) form amyloid rods. A, ThT fluorescence follows the fiber growth of Aβ(11–40) (blue), Aβ(11–42) (green), and Aβ(1–40) (red). Shown are representative TEM images of Aβ(11–40) (B), Aβ(1–40) (C), and Aβ(11–42) (E and F) negatively stained with phosphotungstenic acid; the scale bar is 200 nm. Fiber lengths were measured for Aβ(11–40) (blue) and Aβ(1–40) (red), and their percentage frequency is shown in d. N-terminally truncated Aβ formed fibers more rapidly than full-length Aβ and produce short stacked amyloid rods, mild intermittent agitation for all conditions, 10 μm peptide, 10 μm ThT, 30 mm HEPES, and 160 mm NaCl at pH 7.4.
FIGURE 3.
FIGURE 3.
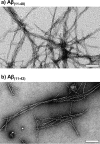
Quiescently grown fibers of Aβ(11–40) (a) and Aβ(11–42) (b). Representative TEM images after 20 days of incubation at room temperature with no agitation, 10 μm peptide, pH 7.4, 160 mm NaCl, and 30 mm HEPES. Under quiescent growth conditions much longer fibers were observed. Scale bars are 200 nm.
FIGURE 4.
FIGURE 4.
Cu2+ visible CD of Aβ(11–40) and Aβ(11–15). A, overlay spectra of Aβ(11–40) (red) and Aβ(11–15) (green). B, comparison of N-terminally truncated Aβ(11–40) (red) and Aβ(11–15) (green) with albumin (orange) and its peptide mimics AAH (blue) and DAH (purple). C, Cu2+ titration with Aβ(11–15) shows signal saturation at 1:1 stoichiometry (spectra as insets) The dotted lines are straight line fits to the initial data points and the points in which saturation is apparent. D, pH dependence of the EVHHQ Cu2+ complex, pKa = 4.7 (spectra are shown as insets). 100 μm Peptides, pH 7.4. Tripeptides used Asp-Ala-His (DAH) and Ala-Ala-His (AAH).
FIGURE 5.
FIGURE 5.
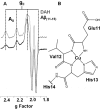
Comparison of Cu2+-EPR spectra of Cu2+-Aβ(11–15) with Cu2+ DAH (the N-terminal residues of albumin Asp-Ala-His). A, EPR shows highly similar spectra, indicating the same 4N square-planar coordination geometry. B, 100 μm peptides, 90 μm CuCl2 at pH 7.4 in 50 mm 60% HEPES, 40% phosphate buffer. Shown is the proposed 4N square planar coordination geometry of Cu2+-Aβ(11–40). Axial coordination from the imidazole nitrogen of His-14 is also probable. DAH, Asp-Ala-His; gII, g-factor parallel; AII, hyperfine splitting.
FIGURE 6.
FIGURE 6.
Cu2+ binds to Aβ(11–40) fibers. A comparison of visible CD spectra of Cu2+ loaded monomer (red) and fibers (blue) of Aβ(11–40). The inset shows Aβ(11–40) fibers loading Cu2+ with approximate 1:1 stoichiometry (0.7: 1). Preformed Aβ(11–40) fibers (70 μm) were generated before Cu2+ titration, pH 7.4. Aβ(11–40) fibers can accommodate Cu2+ binding in the same manner as the monomeric form, with similar CD bands and intensities.
FIGURE 7.
FIGURE 7.
Cu2+ affinity for Aβ(11–40) competitive titrations. Shown is visible CD of Aβ(11–15) using l-histidine (A) and glycine competitors (B). The Cu2+-Aβ(11–40) complex titrated with glycine (C) is shown. The dotted line shows the concentration of competitor needed to remove half the Cu2+ from the Aβ peptides. The insets show visible CD spectra with increasing concentrations of competitor. All experiments were carried out at pH 7.4 with Aβ(11–15) at 100 μm. Aβ(11–40) is at 72 μm.
FIGURE 8.
FIGURE 8.
Influence of Cu2+ on Aβ(11–40) and Aβ(11–42) fiber growth. ThT Fluorescence of Aβ(11–40) and Aβ(11–42) fiber growth with different molar equivalencies of Cu2+, A and D, respectively. TEM images of fibers produced with the following Cu2+ equivalencies: Aβ(11–40) 0.1 (B) and 0.4 (C); Aβ(11–42) 0.1 (E) and 0.4 (F). All scale bars are 50 nm. AFU, arbitrary fluorescence units.
FIGURE 9.
FIGURE 9.
Reversibility of Cu2+ influence on Aβ(11–40) fibers. A, shown is the effect of 0.4 mol eq Cu2+ on preformed Aβ(11–40) fibers and removal of Cu2+ from Cu2+-Aβ(11–40) fibers. Shown is ThT fluorescence of Aβ(11–40) fiber growth with the subsequent addition of 0.4 mol eq of Cu2+ at 235 h and fiber growth of Aβ(11–40) in the presence of Cu2+ with the later addition of 0.4 mol eq of EDTA. ThT fluorescence kinetics traces are an average from n = 6; error bars are S.E. Shown are TEM images of the fibers produced with Cu2+ added to preformed fibers (B) and Cu2+-Aβ(11–40) fibers with subsequent EDTA addition (C). Scale bars are 200 nm. AFU, arbitrary fluorescence units.

References

    1. Prince M., Jackson J., Ferri C. P., Sousa R., Albanese E., Ribeiro W. S., and Honyashiki M. (2009) Alzheimer's disease international world Alzheimer report. In International AsD (ed), pp. 1–96, Alzheimer's Disease International, London
    1. Hardy J. A., and Higgins G. A. (1992) Alzheimer's disease: the amyloid cascade hypothesis. Science 256, 184–185 - PubMed
    1. Kummer M. P., and Heneka M. T. (2014) Truncated and modified amyloid-β species. Alzheimers Res. Ther. 6, 28. - PMC - PubMed
    1. Kang J., Lemaire H. G., Unterbeck A., Salbaum J. M., Masters C. L., Grzeschik K. H., Multhaup G., Beyreuther K., and Müller-Hill B. (1987) The precursor of Alzheimer's disease amyloid A4 protein resembles a cell-surface receptor. Nature 325, 733–736 - PubMed
    1. Prelli F., Castaño E., Glenner G. G., and Frangione B. (1988) Differences between vascular and plaque core amyloid in Alzheimer's disease. J. Neurochem. 51, 648–651 - PubMed

Publication types

MeSH terms