. 2015 Nov 6;290(45):27311-27320.
doi: 10.1074/jbc.M115.665000. Epub 2015 Sep 25.

Membrane Potential Controls the Efficacy of Catecholamine-induced β1-Adrenoceptor Activity

Affiliations

Membrane Potential Controls the Efficacy of Catecholamine-induced β1-Adrenoceptor Activity

Alexandra Birk et al. J Biol Chem. .

Abstract

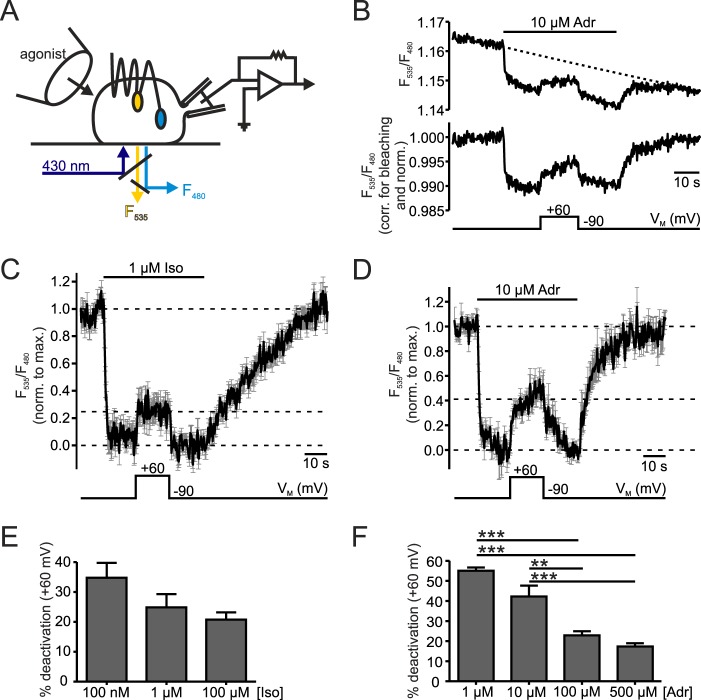
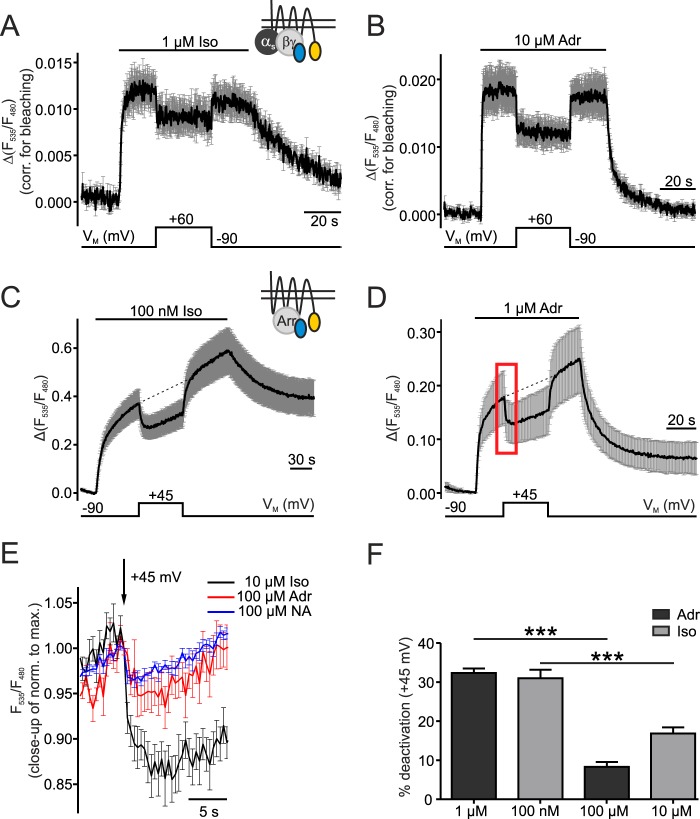
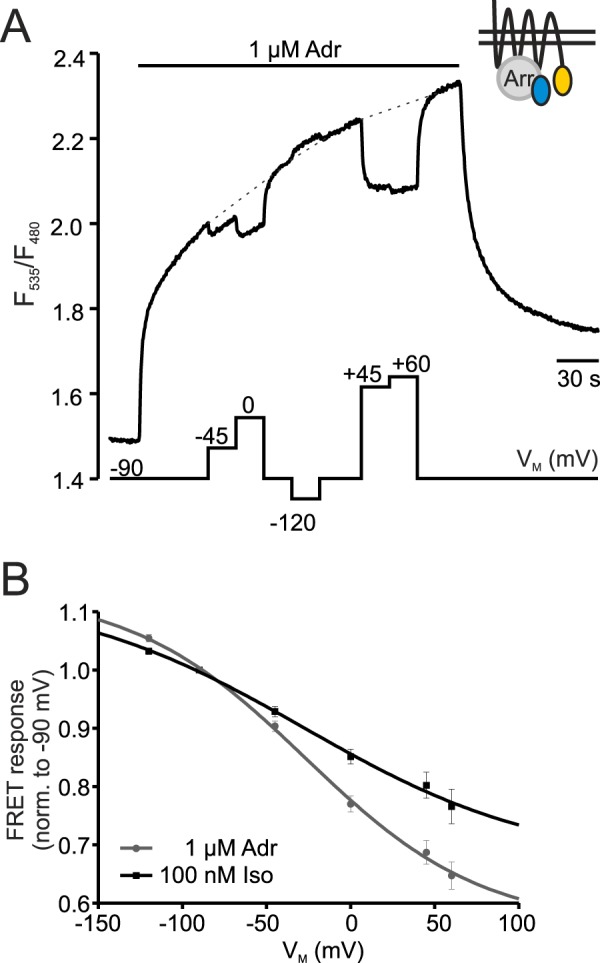
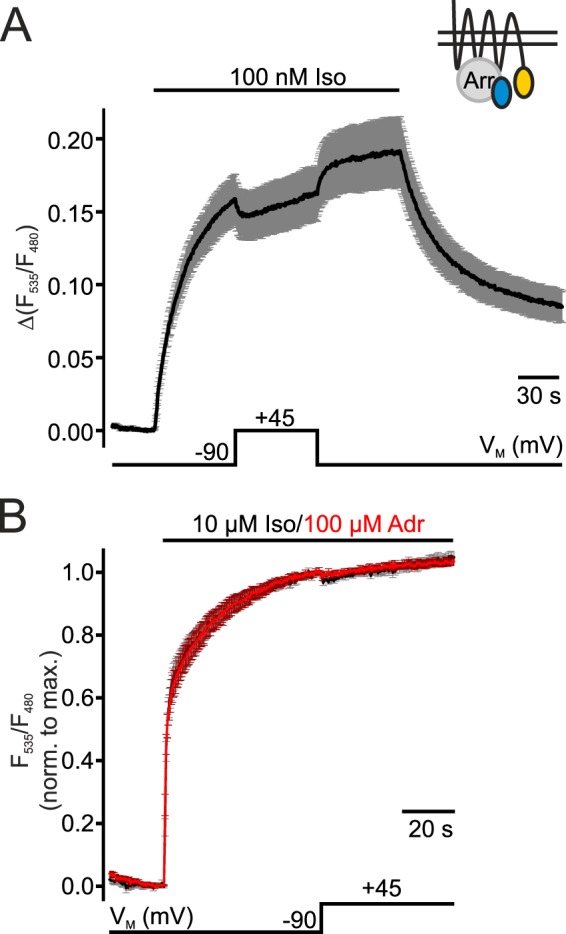
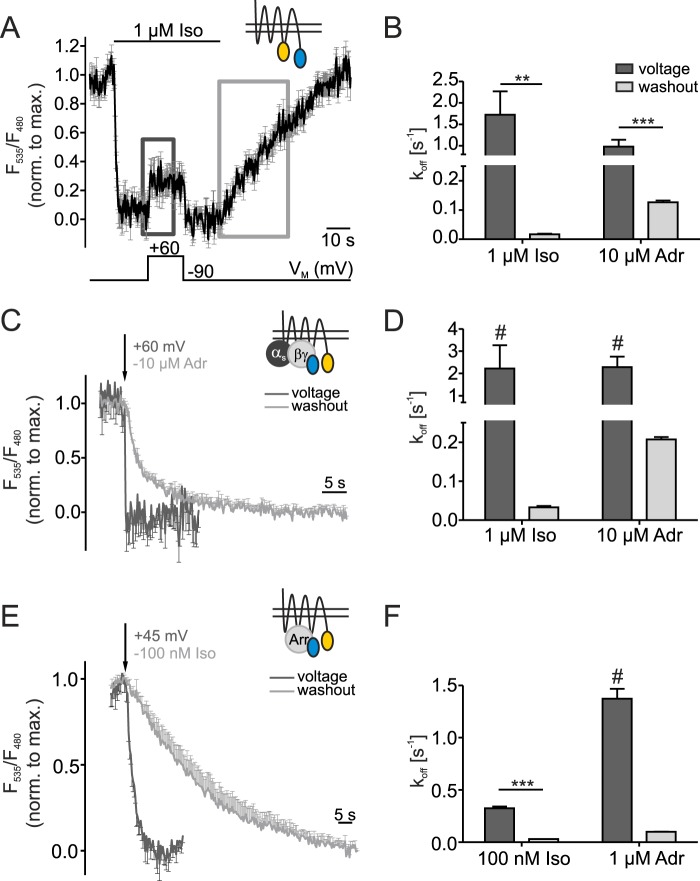
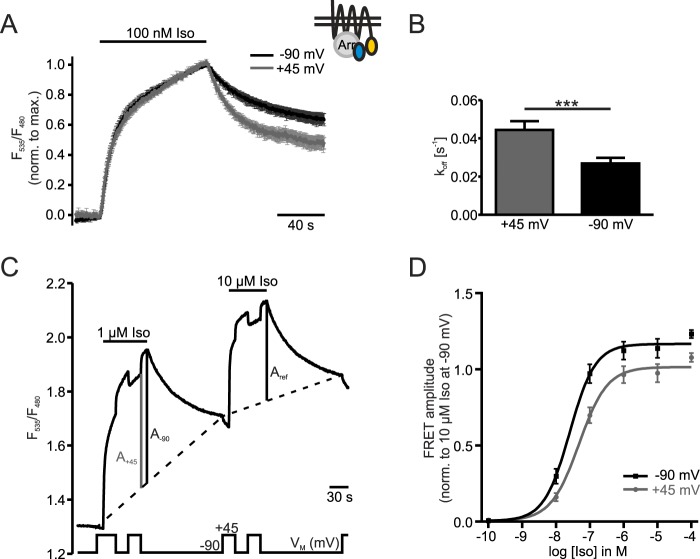
G protein-coupled receptors (GPCRs) are membrane-located proteins and, therefore, are exposed to changes in membrane potential (V(M)) in excitable tissues. These changes have been shown to alter receptor activation of certain Gi-and Gq-coupled GPCRs. By means of a combination of whole-cell patch-clamp and Förster resonance energy transfer (FRET) in single cells, we demonstrate that the activation of the Gs-coupled β1-adrenoreceptor (β1-AR) by the catecholamines isoprenaline (Iso) and adrenaline (Adr) is regulated by V(M). This voltage-dependence is also transmitted to G protein and arrestin 3 signaling. Voltage-dependence of β2-AR activation, however, was weak compared with β1-AR voltage-dependence. Drug efficacy is a major target of β1-AR voltage-dependence as depolarization attenuated receptor activation, even under saturating concentrations of agonists, with significantly faster kinetics than the deactivation upon agonist withdrawal. Also the efficacy of the endogenous full agonist adrenaline was reduced by depolarization. This is a unique finding since reports of natural full agonists at other voltage-dependent GPCRs only show alterations in affinity during depolarization. Based on a Boltzmann function fit to the relationship of V(M) and receptor-arrestin 3 interaction we determined the voltage-dependence with highest sensitivity in the physiological range of membrane potential. Our data suggest that under physiological conditions voltage regulates the activity of agonist-occupied β1-adrenoceptors on a very fast time scale.

Keywords: G protein; G protein-coupled receptor (GPCR); adrenergic receptor; arrestin; fluorescence resonance energy transfer (FRET); kinetics; voltage-dependence.


Figures

FIGURE 1.
FIGURE 1.
Depolarization reduced β1-AR activation. A, schematic of FRET and electrophysiology measurements illustrated with a cell expressing a β1-AR sensor. Cells were excited at 430 nm (dark blue) and donor (F480, light blue) and acceptor (F535, yellow) emissions were recorded. Simultaneously, cells were superfused with buffer or agonist-containing buffer with a pressurized perfusion system (left), and the membrane potential was controlled in whole-cell voltage-clamp configuration (patch pipette and amplifier, right). B, representative measurement of the transiently transfected β1-AR sensor stimulated with 10 μm Adr. The FRET ratio (F535/F480) is shown before (above) and after (below) correction for photobleaching by subtraction of a mono-exponential curve (τ = 574 s) and normalization to the initial FRET value before stimulation. A black bar with agonist labeling above the ratio trace indicates the duration of application and type of agonist used. The time scale appears as a black bar in every graph. The bar below the traces shows the course of membrane potential (holding potential: −90 mV; test potential: +60 mV). C and D, mean ± S.E. of Iso-(C, 1 μm, n = 9) and Adr-(D, 10 μm, n = 8) stimulated β1-AR sensor in cells stably or transiently expressing the β1-AR sensor, respectively. Single traces were corrected for bleaching as indicated in B, normalized to the maximal agonist-induced amplitude and smoothed before averaging. The dashed lines indicate the baselines for the evaluation of FRET amplitudes which have been measured in individual experiments. E and F, to quantify the depolarization-induced reduction of FRET response the quotient of amplitudes during activation in depolarization and at holding potential was calculated and subtracted from 1 (100%) to obtain % deactivation. The summarized data at different concentrations of Iso (E, n = 8–10) or Adr (F, n = 5–8) are shown. **: p < 0.001, ***: p < 0.001; one way ANOVA with Bonferroni's Multiple Comparison Test was used as a statistical test.
FIGURE 2.
FIGURE 2.
VM alters G protein and arrestin 3 interaction with β1-AR. A and B, interaction of G protein and β1-AR was measured in cells transfected with β1-YFP, CFP-Gγ2 and unlabeled Gαs and Gβ subunits. Cells were stimulated with 1 μm Iso (A, n = 7) or 10 μm Adr (B, n = 7). The measurements were corrected for bleaching before averaging (mean ± S.E.). C and D, arrestin 3 interaction with β1-AR was analyzed in cells expressing β1-YFP, CFP-Arr3 and GRK2 (C: 100 nm Iso, n = 8 and D: 1 μm Adr, n = 6; mean ± S.E.). The membrane potential was depolarized from −90 mV to +45 mV. The red box marks the section of the details in E. Small schematic insets in A and C show the FRET assays corresponding to the figure data. E, an overlay of sections of averaged data (means ± S.E.) with saturating concentrations of Iso (n = 8), Adr (n = 8), and NA (n = 8) shows the depolarization-induced reduction of receptor-arrestin 3 interaction. Individual experiments were normalized to the maximal amplitude before averaging. F, FRET amplitudes to calculate %-deactivation by depolarization during activation with sub- and saturating concentrations of agonist were measured as follows: −90 mV amplitude: baseline to dashed line (C and D), +45 mV amplitude: baseline to curve. Iso (100 nm, n = 8; 10 μm, n = 8) and Adr (1 μm, n = 10; 100 μm, n = 8). The calculation and quantification was performed like in Fig. 1E and F. ***: p < 0.001, one way ANOVA with Bonferroni's Multiple Comparison Test was used as a statistical test.
FIGURE 3.
FIGURE 3.
Voltage-dependence occurs within the physiological range of VM. A, representative single cell measurement shows the FRET ratio of a cell transfected with β1-YFP, CFP-Arr3 (see schematic inset), and GRK2 at various VM-steps. The amplitudes were measured during hyper- or depolarization steps relative to the amplitude at −90 mV (dashed lines) and plotted against VM (B). B, VM/FRET response ratio of Iso- and Adr-stimulated cells were fit to a Boltzmann function (Iso: black, n = 14, Adr: gray, n = 11; R2 of fits: 0.99).
FIGURE 4.
FIGURE 4.
Voltage-sensitivity of the interaction of β2-AR and arrestin 3. Means ± S.E. of cells transfected with β2-YFP, CFP-Arr3 and GRK2 are shown. A small schematic inset shows the FRET assay used. A, cells were stimulated with 100 nm Iso. The single traces were normalized to the FRET value before stimulation and averaged (n = 9, mean ± S.E.). B, stimulation was induced with 10 μm Iso (black trace, n = 7) or 100 μm Adr (red trace, n = 8). Single measurements were normalized to the maximal amplitude prior to depolarization (+45 mV) before averaging (mean ± S.E.).
FIGURE 5.
FIGURE 5.
Agonist efficacy of β1-AR is regulated by voltage. Washout- and depolarization-induced deactivation of the β1-AR sensor (A and B) or of the disruption of G protein-receptor interaction (C and D) and arrestin 3-receptor interaction (E and F) were compared. Small schematic insets show the FRET assays corresponding to the figure data. A, in the average trace of Fig. 1C the dark gray (voltage) and light gray (washout) squares indicate where offrates were determined by fitting the average to a mono-exponential function (β1-AR sensor, n = 9, mean ± S.E.). C and E, data of Fig. 2, B and C were normalized to the maximal FRET amplitude in sections indicated in A and used for fitting and overlay of voltage- and washout-induced off rates (C: n = 7, E: n = 8). To increase clearness the error bars only point in one direction. The arrows indicate the time point when cells were depolarized (+60 mV (C)/+45 mV (E)) or when the agonist was withdrawn (−10 μm Adr (C), −100 nm Iso (E)). B, D, and F summarize the statistical analysis of koff-values of the sections indicated in A in Iso- or Adr-stimulated cells (B: n≥8, D: n = 7, F: n≥8). F-tests were used as statistical tests to compare fits and determine statistical significance: **: p < 0.01, ***: p < 0.001. #: The calculated koff-values were close to the detection limit of 200 ms (D) and 400 ms (F) (sampling frequencies of 5 Hz and 2.5 Hz, respectively).
FIGURE 6.
FIGURE 6.
Concentration-response curve yields significant reduction in efficacy by depolarization. The schematic inset shows the FRET-assay detecting interaction between β1-AR-YFP and CFP-Arr3 in the presence of unlabeled GRK2. A, cells were stimulated with 100 nm Iso and measured twice under the constant membrane potentials of −90 mV and +45 mV in an alternating order. Individual experiments were normalized to the maximal amplitudes and averaged (n = 9, mean ± S.E.). B, comparison and statistical analysis of koff-values at constant VM of the data in A. Statistical significance was determined by a paired samples t test, ***: p < 0.001. C, a representative measurement illustrates how data for a concentration-response-curve (D) were collected. Cells were first stimulated with a test concentration of Iso (here 1 μm). After washout of the test concentration the reference concentration of 10 μm Iso was applied. During both stimulations the membrane potential was switched between −90 mV and +45 mV. Amplitudes at +45 mV (A+45) and −90 mV (A-90) of the first stimulation were set in relation to the amplitude at −90 mV during application of 10 μm Iso (Aref). A two-point interpolation (dashed lines) was used to establish baselines for the calculation of the FRET amplitudes. This was necessary to account for the increase in the non-reversible fraction of the FRET signal over the time course of the experiment. D, concentration-response curve was drawn from summarized data collected as described in C at −90 mV and +45 mV at various test concentrations of Iso (n = 3–9 per data point). Paired Student's t-tests confirmed statistically significant differences between data points measured at +45 mV compared with −90 mV at all concentrations of Iso except for 10−10 m Iso.

References

    1. Ben-Chaim Y., Tour O., Dascal N., Parnas I., and Parnas H. (2003) The M2 muscarinic G-protein-coupled receptor is voltage-sensitive. J. Biol. Chem. 278, 22482–22491 - PubMed
    1. Ohana L., Barchad O., Parnas I., and Parnas H. (2006) The metabotropic glutamate G-protein-coupled receptors mGluR3 and mGluR1a are voltage-sensitive. J. Biol. Chem. 281, 24204–24215 - PubMed
    1. Martinez-Pinna J., Gurung I. S., Vial C., Leon C., Gachet C., Evans R. J., and Mahaut-Smith M. P. (2005) Direct voltage control of signaling via P2Y1 and other Gαq-coupled receptors. J. Biol. Chem. 280, 1490–1498 - PubMed
    1. Martinez-Pinna J., Gurung I. S., Mahaut-Smith M. P., and Morales A. (2010) Direct voltage control of endogenous lysophosphatidic acid G-protein-coupled receptors in Xenopus oocytes. J. Physiol. 588, 1683–1693 - PMC - PubMed
    1. Sahlholm K., Nilsson J., Marcellino D., Fuxe K., and Arhem P. (2008) Voltage-dependence of the human dopamine D2 receptor. Synapse 62, 476–480 - PubMed

Publication types

MeSH terms