Comparative Study
. 2015 Oct 15;182(8):723-9.
doi: 10.1093/aje/kwv115. Epub 2015 Sep 26.

Estimating the Distribution of the Incubation Periods of Human Avian Influenza A(H7N9) Virus Infections

Comparative Study

Estimating the Distribution of the Incubation Periods of Human Avian Influenza A(H7N9) Virus Infections

Victor Virlogeux et al. Am J Epidemiol. .

Abstract

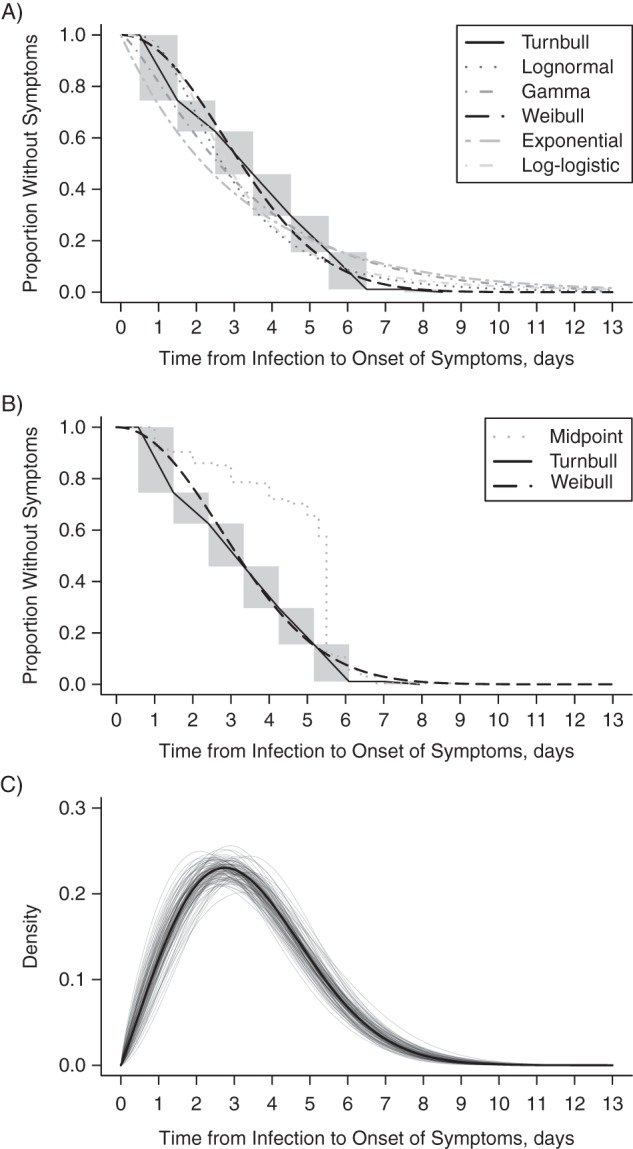
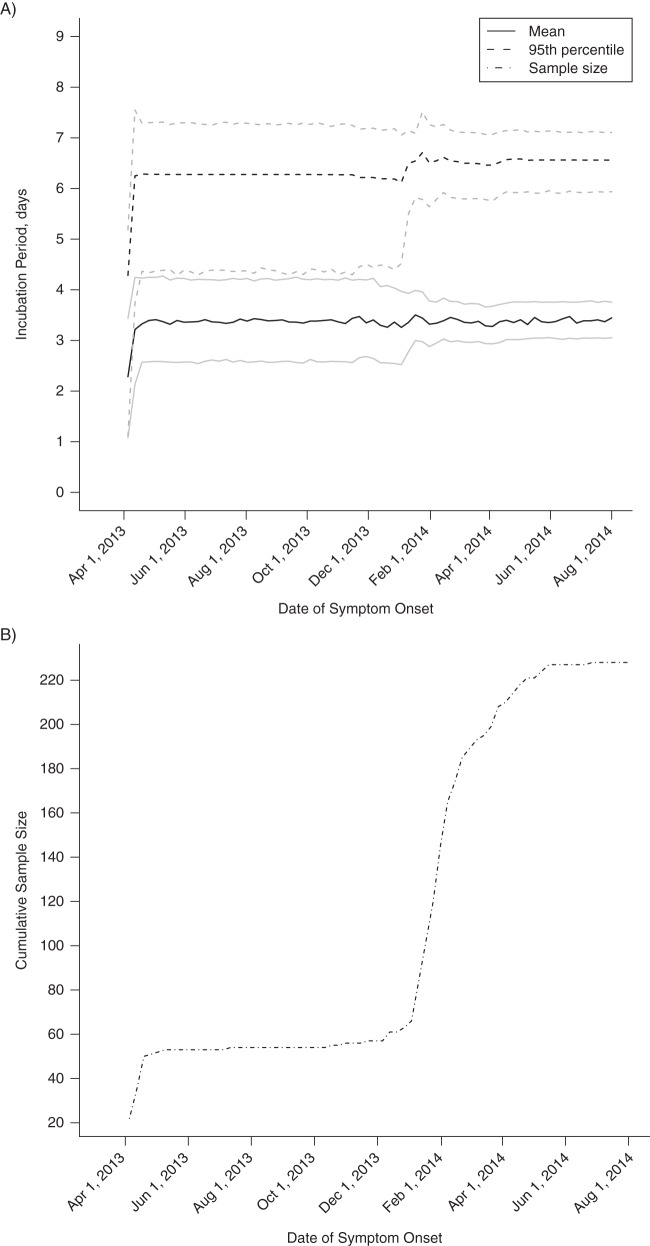
A novel avian influenza virus, influenza A(H7N9), emerged in China in early 2013 and caused severe disease in humans, with infections occurring most frequently after recent exposure to live poultry. The distribution of A(H7N9) incubation periods is of interest to epidemiologists and public health officials, but estimation of the distribution is complicated by interval censoring of exposures. Imputation of the midpoint of intervals was used in some early studies, resulting in estimated mean incubation times of approximately 5 days. In this study, we estimated the incubation period distribution of human influenza A(H7N9) infections using exposure data available for 229 patients with laboratory-confirmed A(H7N9) infection from mainland China. A nonparametric model (Turnbull) and several parametric models accounting for the interval censoring in some exposures were fitted to the data. For the best-fitting parametric model (Weibull), the mean incubation period was 3.4 days (95% confidence interval: 3.0, 3.7) and the variance was 2.9 days; results were very similar for the nonparametric Turnbull estimate. Under the Weibull model, the 95th percentile of the incubation period distribution was 6.5 days (95% confidence interval: 5.9, 7.1). The midpoint approximation for interval-censored exposures led to overestimation of the mean incubation period. Public health observation of potentially exposed persons for 7 days after exposure would be appropriate.

Keywords: incubation period; influenza; influenza A virus; influenza A(H7N9).


Figures

Figure 1.
Figure 1.
Parametric and nonparametric estimates of the distribution of incubation periods for human avian influenza A(H7N9) virus infections, based on 229 laboratory-confirmed cases with available data on exposure times, China, 2013–2014. A) Comparison of alternative parametric models (lognormal, gamma, Weibull, exponential, and log-logistic) with the nonparametric maximum likelihood estimator (Turnbull). For the nonparametric estimate (Turnbull), gray rectangles show intervals where the estimate was not unique. B) Comparison of the nonparametric maximum likelihood estimator (Turnbull) and the best-fitting parametric model (Weibull) with the empirical distribution using a midpoint approximation for interval-censored exposures (midpoint). C) Probability density function of the Weibull distribution used to estimate the distribution of incubation periods for the 229 cases. The solid black line represents the fitted Weibull distribution, and the gray lines represent the uncertainty range, estimated by bootstrapping with 1,000 resamples.
Figure 2.
Figure 2.
Estimated mean incubation time and 95th percentile of incubation times for human avian influenza A(H7N9) virus infections (estimated on the basis of cumulative data available at different times during the epidemic), by date of symptom onset (A), and cumulative sample size by date of symptom onset (B), China, 2013–2014. In part A, the black solid line shows the mean incubation period over time, and the black dashed line shows the 95th percentile of the incubation period distribution, while the gray solid and dashed lines show the corresponding 95% confidence intervals. Part B shows the cumulative number of cases with available data on exposure.

Similar articles

Cited by

References

    1. Vynnycky E, Fine PE. Lifetime risks, incubation period, and serial interval of tuberculosis. Am J Epidemiol. 2000;1523:247–263. - PubMed
    1. Gao R, Cao B, Hu Y et al. . Human infection with a novel avian-origin influenza A (H7N9) virus. N Engl J Med. 2013;36820:1888–1897. - PubMed
    1. Yu H, Wu JT, Cowling BJ et al. . Effect of closure of live poultry markets on poultry-to-person transmission of avian influenza A H7N9 virus: an ecological study. Lancet. 2014;3839916:541–548. - PMC - PubMed
    1. Cowling BJ, Jin L, Lau EHY et al. . Comparative epidemiology of human infections with avian influenza A H7N9 and H5N1 viruses in China: a population-based study of laboratory-confirmed cases. Lancet. 2013;3829887:129–137. - PMC - PubMed
    1. Li Q, Zhou L, Zhou M et al. . Epidemiology of human infections with avian influenza A(H7N9) virus in China. N Engl J Med. 2014;3706:520–532. - PMC - PubMed

Publication types

MeSH terms