

Small-molecule targeting of signal transducer and activator of transcription (STAT) 3 to treat non-small cell lung cancer
- PMID: 26410177
- PMCID: PMC4619129
- DOI: 10.1016/j.lungcan.2015.09.014
Small-molecule targeting of signal transducer and activator of transcription (STAT) 3 to treat non-small cell lung cancer
Abstract
Objective: Lung cancer is the leading cause of cancer death in both men and women. Non-small cell lung cancer (NSCLC) has an overall 5-year survival rate of 15%. While aberrant STAT3 activation has previously been observed in NSCLC, the scope of its contribution is uncertain and agents that target STAT3 for treatment are not available clinically.
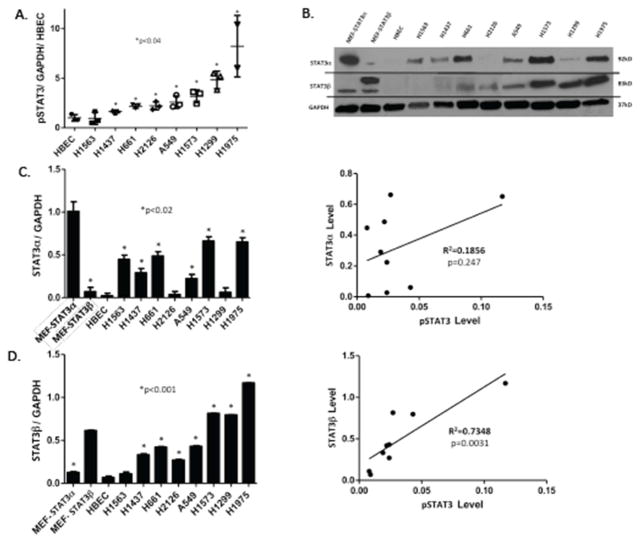
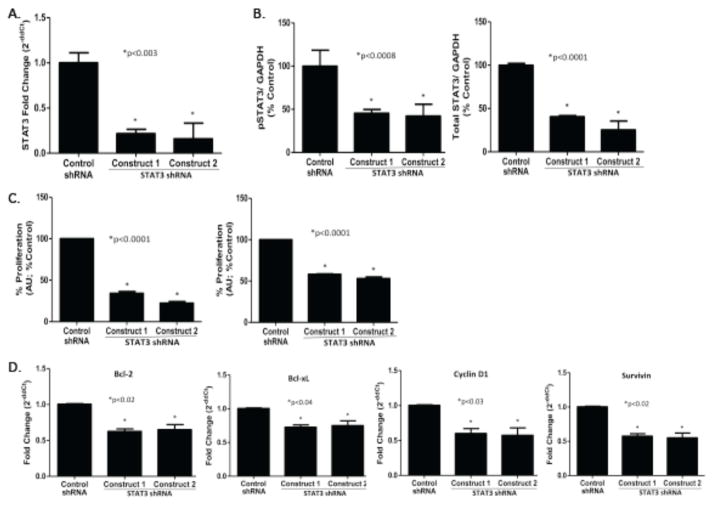
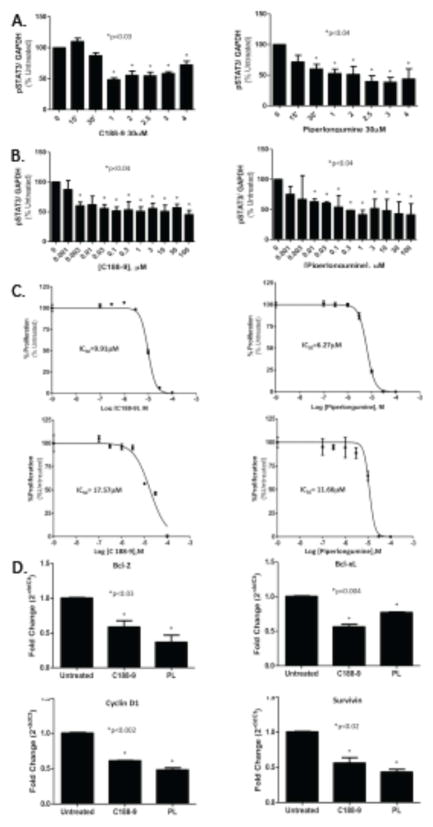
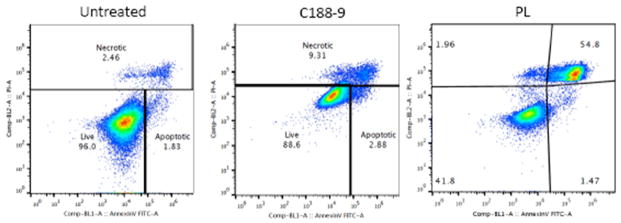
Methods: We determined levels of activated STAT3 (STAT3 phosphorylated on Y705, pSTAT3) and the two major isoforms of STAT3 (α and β) in protein extracts of 8 NSCLC cell lines, as well as the effects of targeting STAT3 in vitro and in vivo in NSCLC cells using short hairpin (sh) RNA and two novel small-molecule STAT3 inhibitors, C188-9 and piperlongumine (PL).
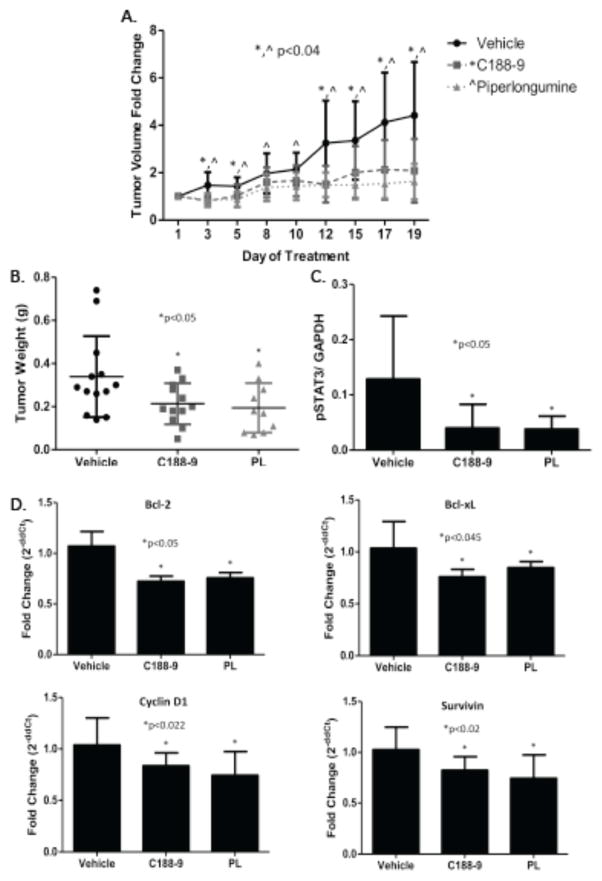
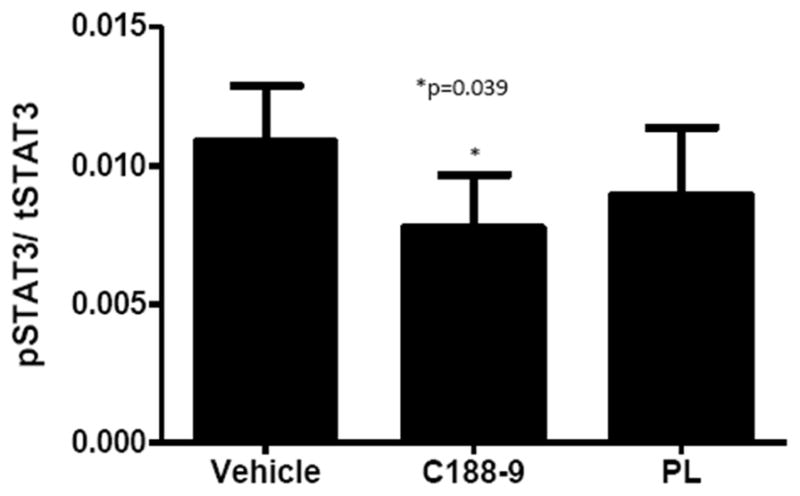
Results: Levels of pSTAT3, STAT3α, and STATβ were increased in 7 of 8 NSCLC cell lines. Of note, levels of pSTAT3 were tightly correlated with levels of STAT3β, but not STAT3α. Targeting of STAT3 in A549 cells using shRNA decreased tSTAT3 by 75%; this was accompanied by a 47-78% reduction in anchorage-dependent and anchorage-independent growth and a 28-45% reduction in mRNA levels for anti-apoptotic STAT3 gene targets. C188-9 and PL (@30 μM) each reduced pSTAT3 levels in all NSCLC cell lines tested by ≥50%, reduced anti-apoptotic protein mRNA levels by 25-60%, and reduced both anchorage-dependent and anchorage-independent growth of NSCLC cell lines with IC50 values ranging from 3.06 to 52.44 μM and 0.86 to 11.66 μM, respectively. Treatment of nude mice bearing A549 tumor xenografts with C188-9 or PL blocked tumor growth and reduced levels of pSTAT3 and mRNA encoding anti-apoptotic proteins.
Conclusion: STAT3 is essential for growth of NSCLC cell lines and tumors and its targeting using C188-9 or PL may be a useful strategy for treatment.
Keywords: NSCLC; STAT3; Small molecule inhibitors.
Copyright © 2015 Elsevier Ireland Ltd. All rights reserved.
Conflict of interest statement
Baylor College of Medicine (BCM), with David J. Tweardy as inventor, were issued patents from the U.S., Canada, and Australia covering composition and use of C188-9 for cancer treatment. BCM has licensed these patents to StemMed, Ltd. Tweardy is President and CEO of StemMed.
Figures
Similar articles
-
Physalin A exerts anti-tumor activity in non-small cell lung cancer cell lines by suppressing JAK/STAT3 signaling.Oncotarget. 2016 Feb 23;7(8):9462-76. doi: 10.18632/oncotarget.7051. Oncotarget. 2016. PMID: 26843613 Free PMC article.
-
Signal transducer and activator of transcription 3 as molecular therapy for non-small-cell lung cancer.J Thorac Oncol. 2014 Apr;9(4):488-96. doi: 10.1097/JTO.0000000000000107. J Thorac Oncol. 2014. PMID: 24736071
-
A sesquiterpene lactone antrocin from Antrodia camphorata negatively modulates JAK2/STAT3 signaling via microRNA let-7c and induces apoptosis in lung cancer cells.Carcinogenesis. 2013 Dec;34(12):2918-28. doi: 10.1093/carcin/bgt255. Epub 2013 Jul 23. Carcinogenesis. 2013. PMID: 23880305
-
Targeting STAT3 in cancer: how successful are we?Expert Opin Investig Drugs. 2009 Jan;18(1):45-56. doi: 10.1517/13543780802565791. Expert Opin Investig Drugs. 2009. PMID: 19053881 Free PMC article. Review.
-
Targeting STAT3 for Cancer Therapy: Focusing on Y705, S727, or Dual Inhibition?Cancers (Basel). 2025 Feb 23;17(5):755. doi: 10.3390/cancers17050755. Cancers (Basel). 2025. PMID: 40075607 Free PMC article. Review.
Cited by
-
Inhibition of STAT3 signaling induces apoptosis and suppresses growth of lung cancer: good and bad.Lab Anim Res. 2019 Dec 21;35:30. doi: 10.1186/s42826-019-0030-0. eCollection 2019. Lab Anim Res. 2019. PMID: 32257917 Free PMC article.
-
DYRK1A regulates B cell acute lymphoblastic leukemia through phosphorylation of FOXO1 and STAT3.J Clin Invest. 2021 Jan 4;131(1):e135937. doi: 10.1172/JCI135937. J Clin Invest. 2021. PMID: 33393494 Free PMC article.
-
Susceptibility of pediatric acute lymphoblastic leukemia to STAT3 inhibition depends on p53 induction.Haematologica. 2024 Apr 1;109(4):1069-1081. doi: 10.3324/haematol.2023.283613. Haematologica. 2024. PMID: 37794795 Free PMC article.
-
The Antitumor Activity of Piplartine: A Review.Pharmaceuticals (Basel). 2023 Sep 4;16(9):1246. doi: 10.3390/ph16091246. Pharmaceuticals (Basel). 2023. PMID: 37765054 Free PMC article. Review.
-
PEST-containing nuclear protein regulates cell proliferation, migration, and invasion in lung adenocarcinoma.Oncogenesis. 2019 Mar 14;8(3):22. doi: 10.1038/s41389-019-0132-4. Oncogenesis. 2019. PMID: 30872582 Free PMC article.
References
-
- American Cancer Society. Global Cancer Facts & Figures. 2. Atlanta: American Cancer Society; 2011.
-
- Howlader N, Noone AM, Krapcho M, Garshell J, Miller D, Altekruse SF, et al., editors. SEER Cancer Statistics Review, 1975–2011. National Cancer Institute; Bethesda, MD: Apr, 2014. http://seer.cancer.gov/csr/1975_2011/, based on November 2013 SEER data submission, posted to the SEER web site.
-
- Achcar ROD, Cagle PT, Jagirdar J. Expression of Activated and Latent Signal Transducer and Activator of Transcription 3 in 303 Non–Small Cell Lung Carcinomas and 44 Malignant Mesotheliomas. Archives of Pthology and Laboratory Medicine. 2007;131(9):1350–60. - PubMed
-
- Lai SY, Johnson FM. Defining the role of the JAK-STAT pathway in head and neck and thoracic malignancies: Implications for future therapeutic approaches. Drug Resistance Updates. 2010;13(3):67–78. - PubMed
Publication types
MeSH terms
Substances
Grants and funding
LinkOut - more resources
Full Text Sources
Other Literature Sources
Medical
Molecular Biology Databases
Miscellaneous
