. 2015 Oct 13;13(2):412-24.
doi: 10.1016/j.celrep.2015.08.077. Epub 2015 Sep 24.

Tumor-Expressed IDO Recruits and Activates MDSCs in a Treg-Dependent Manner

Affiliations

Tumor-Expressed IDO Recruits and Activates MDSCs in a Treg-Dependent Manner

Rikke B Holmgaard et al. Cell Rep. .

Abstract

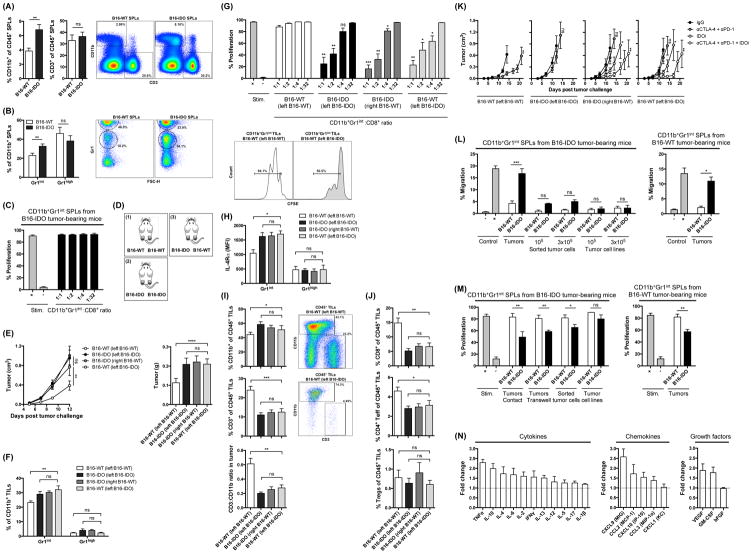
Indoleamine 2,3-dioxygenase (IDO) has been described as a major mechanism of immunosuppression in tumors, though the mechanisms of this are poorly understood. Here, we find that expression of IDO by tumor cells results in aggressive tumor growth and resistance to T-cell-targeting immunotherapies. We demonstrate that IDO orchestrates local and systemic immunosuppressive effects through recruitment and activation of myeloid-derived suppressor cells (MDSCs), through a mechanism dependent on regulatory T cells (Tregs). Supporting these findings, we find that IDO expression in human melanoma tumors is strongly associated with MDSC infiltration. Treatment with a selective IDO inhibitor in vivo reversed tumor-associated immunosuppression by decreasing numbers of tumor-infiltrating MDSCs and Tregs and abolishing their suppressive function. These findings establish an important link between IDO and multiple immunosuppressive mechanisms active in the tumor microenvironment, providing a strong rationale for therapeutic targeting of IDO as one of the central regulators of immune suppression.


Figures

Figure 1
Figure 1. IDO positive tumors from melanoma patients show increased frequencies of MDSCs
(A) Expression of IDO in tumor tissue from tumors of 5 patients with malignant melanoma determined by IHC. (B) Representative IHC staining of CD14 and IDO in tissue from metastatic human melanoma tumors and correlation between IDO and CD14 intensity. (C) Intracellular staining and MFI for IDO within the CD45 gated population of cell suspensions obtained from metastatic melanoma tumors. (D) Frequency of CD11b+CD33+CD14+HLA-DR−/low cells in cell suspensions of IDO+ and IDO tumors and gating strategy. (E) Expression of Arg1 in CD11b+CD33+CD14+HLA-DR−/low gated population. (F) T cell suppression assay with CD14+HLA-DR−/low cells enriched from PBMCs or cell suspensions from tumors of patients with IDO+ tumors. Data are representative of 36 patients (A), 33 patients (B), 22 patients (C–E), and 5 patients (F).
Figure 2
Figure 2. Expression of IDO promotes tumor growth and resistance to immune checkpoint blockade
(A) Mean weight and average growth rate of B16-WT and B16-IDO tumors in naive and irradiated mice. (B) Levels of tryptophan and L-kynurenine in tumor and blood evaluated by ELISA. (C) Mean size of αCTLA-4 + αPD-1 treated B16-IDO and B16-WT tumors and long-term survival. Data are represented as mean ± SEM.
Figure 3
Figure 3. IDO promotes expansion of myeloid CD11b+ cells in tumors
(A) B16-IDO and B16-WT tumors were analyzed for infiltrating immune cells. Results for CD3+ T cells, CD19+ B cells, CD3NK1.1+ NK cells, and CD11b+ myeloid cells as frequencies of CD45+ cells and representative dot plots. (B) Results for T cell subsets: NK1.1+ T cells (NKT), CD4+Foxp3+ Tregs, CD4+Foxp3 Teff cells, and CD8+ T cells as frequencies of CD45+ cells. (C) CD3+/CD11b+ ratios. (D) In vitro suppressive activity of CD11b+ cells from B16-IDO or B16-WT tumors. Representative histograms of CD8+ T-cell proliferation are shown in CD11b+/CD8+ ratio of 1:1. (E) Average growth and mean weight of IDOi and vehicle treated B16-IDO tumors. (F) Relative percentages of CD11b+ and CD3+ cells of CD45+ cells in IDOi and vehicle treated B16-IDO tumors and representative flow plots. (G) Calculated CD3+/CD11b+ ratios. (H) Percent of tumor-infiltrating CD4+ and CD8+ T cells gated on CD45+ population and representative plots. (I) Example of CXCR3 staining within the CD8+ gated population. (J) Representative plots and graphs showing percentage pmels of total CD8+ T cells in LN, TDLN, spleen, and tumor, and proliferation of pmels in tumor and TDLNs, of IDOi and vehicle treated B16-IDO tumor-bearing mice. Data are shown as mean ± SEM.
Figure 4
Figure 4. Phenotype and suppressive capabilities of tumor-infiltrating myeloid CD11b+ cells
(A) CD11b+ subsets obtained from B16-IDO and B16-WT tumors were evaluated for CD11b versus Gr1 expression and graphed as percent Gr1int and Gr1high cells. (B) Suppressive properties of CD11b+Gr1high and CD11b+Gr1int cells from B16-IDO or B16-WT tumors. Representative histograms of CD8+ T-cell proliferation are shown in CD11b+ to CD8+ T cell ratio of 1:1. (C) CD11b+Gr1int subsets from B16-IDO and B16-WT tumors were evaluated for expression of F4/80, CD11c, MHC class II and Ly6C markers (open histograms) against their matched isotype controls (filled histograms). (D) IL-4Rα expression (open histograms) within the CD11b+Gr1int gated populations against matched isotype control (filled histograms). (E) Arg1 activity in CD11b+Gr1high and CD11b+Gr1int subsets from B16-IDO and B16-WT tumors. (F) Nitrite/NO concentration in supernatants of LPS stimulated CD11b+Gr1high and CD11b+Gr1int cells. (G) Suppressive activity of CD11b+Gr1int cells from B16-IDO tumors in the presence of inhibitors of Arg1 (nor-NOHA), iNOS (LNMMA), TGFβ (anti-TGFβ) and/or PD-L1 (anti-PD-L1). Data are shown for CD8+ to CD11b+Gr1int ratios of 1:1. (H) Suppressive activity CD11b+ cells from B16-IDO tumors measured with CD11b+ cells in contact with CD8+ T cells or placed in 0.4 μm cell culture inserts. Data are shown for CD8+ to CD11b+ ratios of 1:1. Data are represented as mean ± SEM.
Figure 5
Figure 5. Activation of MDSCs is dependent on IDO expression
(A) Frequencies of Gr1high and Gr1int subsets of total CD11b+ cells from B16-IDO tumors of IDOi or vehicle treated mice. (B) MFI for IL-4Rα expression within the CD11b+Gr1int population. (C) T cell suppression assay with CD11b+Gr1int cells purified from B16-IDO tumors in the presence of an IDOi added in vitro or administered in vivo. (D) Growth curve for B16-IDO tumors in IDOi treated IDO−/− mice. (E) Ratio of CD3+ to CD11b+Gr1+ cells in B16-IDO tumors in IDOi treated IDO−/− mice. (F) Average growth rate and mean weight of IDOi and vehicle treated 4T1 tumors. (G) Relative percentages of Gr1+ of total CD11b+ cells in 4T1 tumors after IDOi therapy. (H) IL-4Rα expression within the CD11b+Gr1int gated population of TILs from untreated 4T1 tumor-bearing mice. Data are represented as mean ± SEM.
Figure 6
Figure 6. Local and systemic effects of tumor IDO expression
(A) Frequencies of CD11b+ myeloid cells and CD3+ T cells of total CD45+ cells in splenocytes from B16-IDO and B16-WT tumor-bearing mice and representative dot plots. (B) Expression of Gr1 within the CD11b+ gated population and representative plots. (C) Suppressive properties of CD11b+Gr1int splenocytes from B16-IDO tumor-bearing mice. (D) Bilateral flank tumor models: (1) B16-WT tumors on both flanks, (2) B16-IDO tumors on both flanks, and (3) B16-IDO tumor on one flank and B16-WT on the contralateral flank. (E) Mean growth and weight of bilateral flank tumors. (F) Infiltration of CD11b+Gr1int and CD11b+Gr1high myeloid cells in bilateral flank B16-IDO and B16-WT tumors. (G) Suppressive activity of CD11b+Gr1int cells from B16-IDO or B16-WT tumors of bilateral flank tumor-bearing mice and representative histograms. (H) MFI for IL-4Rα expression within CD11b+Gr1int and CD11b+Gr1high gated populations. (I) Frequencies of CD11b+ and CD3+ of CD45+ total cells and CD3+/CD11b+ ratios in bilateral flank B16-IDO and B16-WT tumors, and representative plots. (J) Frequencies of CD8+, CD4+Foxp3, and CD4+Foxp3+ cells of CD45+ total cells in bilateral flank B16-IDO and B16-WT tumors. (K) Mean tumor growth of αCTLA-4 + αPD-1 and/or IDOi treated B16-IDO and B16-WT tumors in bilateral flank tumor models. (L) Migration of CD11b+Gr1int splenocytes purified from B16-IDO and B16-WT tumor-bearing mice towards homogenized tumors, sorted tumor cells or tumor cell lines as indicated. (M) Suppressive activity of CD11b+Gr1int splenocytes of B16-IDO and B16-WT tumor-bearing mice pre-cultured with homogenized tumors, sorted tumor cells or tumor cell lines. CD11b+Gr1int cells were pre-cultured in contact with tumor cells or placed in 0.4 μm cell culture inserts as specified. (N) Relative levels of soluble factors in supernatants of B16-IDO tumors compared to B16-WT tumors, as determined by Luminex. Data are represented as mean ± SEM.
Figure 7
Figure 7. Accumulation of MDSCs in tumors is dependent on the adaptive immune response
(A) Absolute number of CD11b+Gr1+ cells per gram of tumor in B16-WT and B16-IDO tumors from WT and Rag−/− mice. (B) In vitro suppressive activity of CD11b+Gr1int cells purified from B16-IDO tumors of WT or Rag−/− mice measured in CD11b+Gr1int to CD8+ T cell ratios of 1:1. (C) Migration of CD11b+Gr1int splenocytes of B16-IDO tumor-bearing mice towards B16-IDO tumors harvested from WT or Rag−/− mice. (D) Frequency of Foxp3+ Tregs of total CD3+ T cells in B16-IDO and B16-WT tumors of Foxp3GFP mice. Representative dot plots showing GFP-Foxp3+ expression within CD45+ gated populations. (E) Suppressive properties of Foxp3+ Tregs sorted from B16-IDO and B16-WT tumors of Foxp3GFP mice. Representative histograms of CD8+ T-cell proliferation are shown in Foxp3+ Tregs to CD8+ T cell ratio of 1:1. (F) Frequency of CD11b+Gr1int cells of total CD45+ cells in tumor, TDLNs and spleens of B16-IDO tumor-bearing Foxp3DTR mice injected with DT or PBS. (G) Suppression assay with CD11b+Gr1int cells purified from B16-IDO tumors of Foxp3DTR mice injected with DT and PBS. Representative histograms showing CD8+ T-cell proliferation in CD8+ to CD11b+Gr1int ratios of 1:1. (H) Migration of CD11b+Gr1int splenocytes towards homogenized B16-IDO tumors from Foxp3DTR, WT or Rag−/− mice. Tumors were pre-incubated with Treg-blocking antibody or tumor-infiltrating Treg and/or Teff cells in vitro, as indicated. (I) Frequency of CD8+CXCR3+ T cells of total CD3+ T cells B16-IDO tumors of Foxp3DTR mice injected with DT or PBS. (J) Mean growth rate and weight of B16-IDO tumors in Foxp3DTR mice injected with DT or PBS. (K) Percentage of CD4+Foxp3+ Tregs and CD69+CD8+ T cells in cell suspensions of IDO+ and IDO human metastatic melanoma tumors. (L) Representative IHC staining of IDO, CD14 and Foxp3 in tissue from metastatic human melanoma tumors. Data represents mean +/− SEM (A–E) or one representative experiment (F–J). Data in K–L are representative of 22 patients.

References

    1. Dolcetti L, Peranzoni E, Ugel S, Marigo I, Fernandez Gomez A, Mesa C, Geilich M, Winkels G, Traggiai E, Casati A, Grassi F, Bronte V. Hierarchy of immunosuppressive strength among myeloid-derived suppressor cell subsets is determined by GM-CSF. Eur J Immunol. 2010;40:22–35. - PubMed
    1. Fontenot JD, Gavin MA, Rudensky AY. Foxp3 programs the development and function of CD4+CD25+ regulatory T cells. Nat Immunol. 2003;4:330–336. - PubMed
    1. Gabrilovich DI, Nagaraj S. Myeloid-derived suppressor cells as regulators of the immune system. Nat Rev Immunol. 2009;9:162–174. - PMC - PubMed
    1. Gabrilovich DI, Ostrand-Rosenberg S, Bronte V. Coordinated regulation of myeloid cells by tumours. Nat Rev Immunol. 2012;12:253–268. - PMC - PubMed
    1. Gallina G, Dolcetti L, Serafini P, De Santo C, Marigo I, Colombo MP, Basso G, Brombacher F, Borrello I, Zanovello P, Bicciato S, Bronte V. Tumors induce a subset of inflammatory monocytes with immunosuppressive activity on CD8+ T cells. J Clin Invest. 2006;116:2777–2790. - PMC - PubMed

Publication types

Substances