

Temporal trends in TB notification rates during ART scale-up in Cape Town: an ecological analysis
- PMID: 26411694
- PMCID: PMC4584214
- DOI: 10.7448/IAS.18.1.20240
Temporal trends in TB notification rates during ART scale-up in Cape Town: an ecological analysis
Abstract
Introduction: Although antiretroviral therapy (ART) reduces individual tuberculosis (TB) risk by two-thirds, the population-level impact remains uncertain. Cape Town reports high TB notification rates associated with endemic HIV. We examined population trends in TB notification rates during a 10-year period of expanding ART.
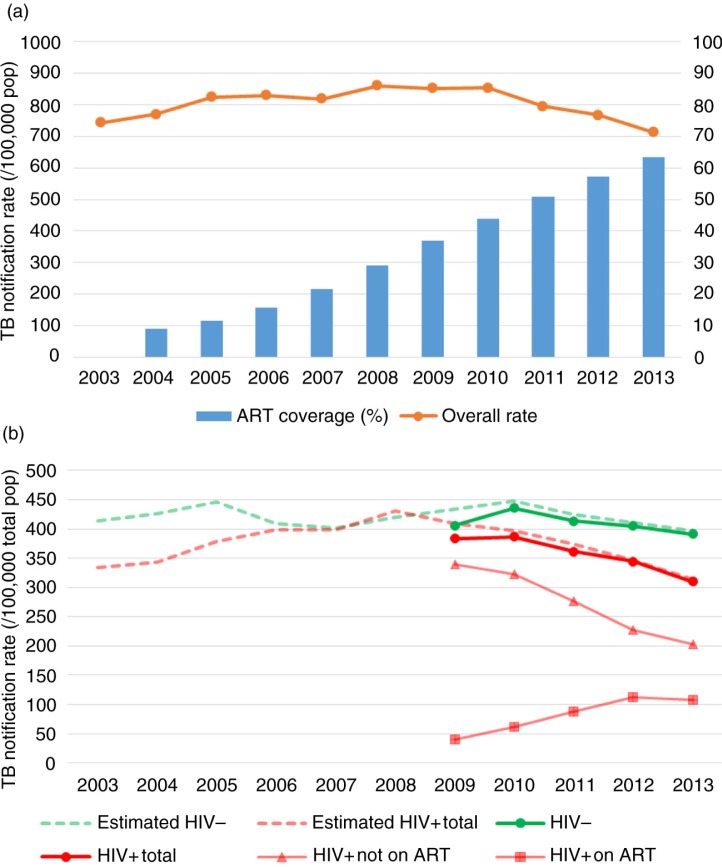
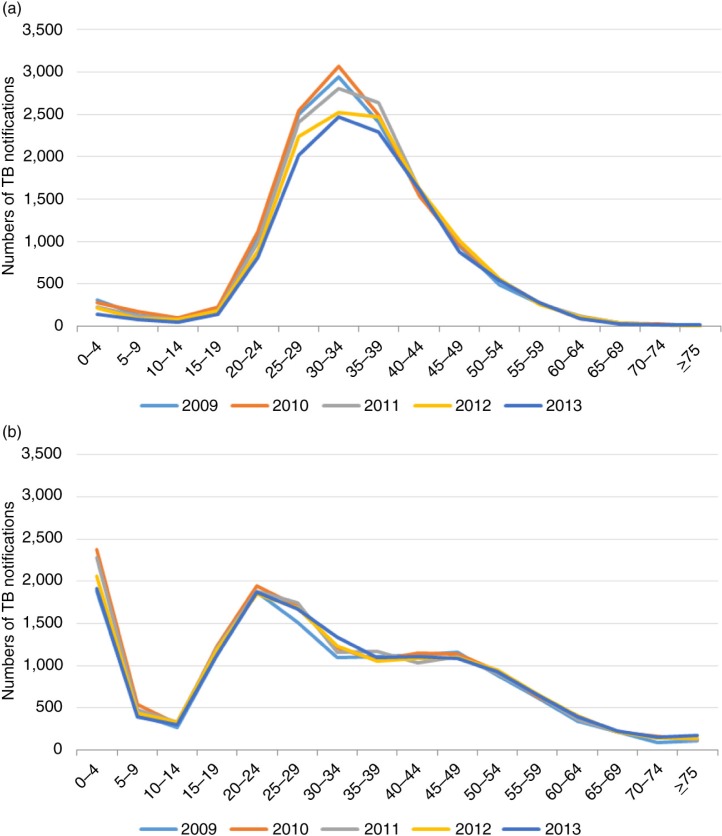
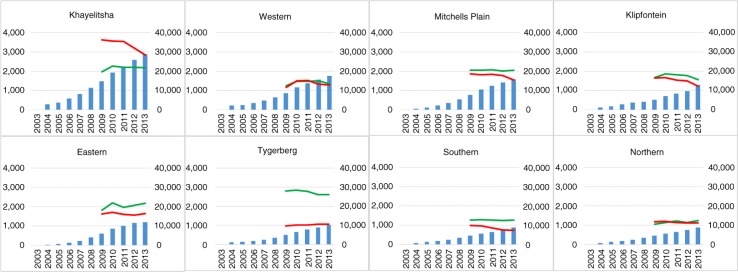
Methods: Annual Cape Town TB notifications were used as numerators and mid-year Cape Town populations as denominators. HIV-stratified population was calculated using overall HIV prevalence estimates from the Actuarial Society of South Africa AIDS and Demographic model. ART provision numbers from Western Cape government reports were used to calculate overall ART coverage. We calculated rates per 100,000 population over time, overall and stratified by HIV status. Rates per 100,000 total population were also calculated by ART use at treatment initiation. Absolute numbers of notifications were compared by age and sub-district. Changes over time were described related to ART provision in the city as a whole (ART coverage) and by sub-district (numbers on ART).
Results: From 2003 to 2013, Cape Town's population grew from 3.1 to 3.7 million inhabitants, and estimated HIV prevalence increased from 3.6 to 5.2%. ART coverage increased from 0 to 63% in 2013. TB notification rates declined by 16% (95% confidence interval (CI), 14-17%) from a 2008 peak (851/100,000) to a 2013 nadir (713/100,000). Decreases were higher among the HIV-positive (21% (95% CI, 19-23%)) than the HIV-negative (9% (95% CI, 7-11%)) population. The number of HIV-positive TB notifications decreased mainly among 0- to 4- and 20- to 34-year-olds. Total population rates on ART at TB treatment initiation increased over time but levelled off in 2013. Overall median CD4 counts increased from 146 cells/µl (interquartile range (IQR), 66, 264) to 178 cells/µl (IQR 75, 330; p<0.001). Sub-district antenatal HIV seroprevalence differed (10-33%) as did numbers on ART (9-29 thousand). Across sub-districts, infant HIV-positive TB decreased consistently whereas adult decreases varied.
Conclusions: HIV-positive TB notification rates declined during a period of rapid scale-up of ART. Nevertheless, both HIV-positive and HIV-negative TB notification rates remained very high. Decreases among HIV positives were likely blunted by TB remaining a major entry to the ART programme and occurring after delayed ART initiation.
Keywords: HIV; South Africa; antiretroviral therapy; population impact; tuberculosis.
Figures
References
-
- Lawn SD, Wood R, De Cock KM, Kranzer K, Lewis JJ, Churchyard GJ. Antiretrovirals and isoniazid preventive therapy in the prevention of HIV-associated tuberculosis in settings with limited health-care resources. Lancet Infect Dis. 2010;10(7):489–98. - PubMed
Publication types
MeSH terms
Substances
Grants and funding
LinkOut - more resources
Full Text Sources
Medical
Research Materials
