. 2015 Sep 28:5:14566.
doi: 10.1038/srep14566.

Human Induced Pluripotent Stem Cell Derived Neuronal Cells Cultured on Chemically-Defined Hydrogels for Sensitive In Vitro Detection of Botulinum Neurotoxin

Affiliations

Human Induced Pluripotent Stem Cell Derived Neuronal Cells Cultured on Chemically-Defined Hydrogels for Sensitive In Vitro Detection of Botulinum Neurotoxin

Sabine Pellett et al. Sci Rep. .

Abstract

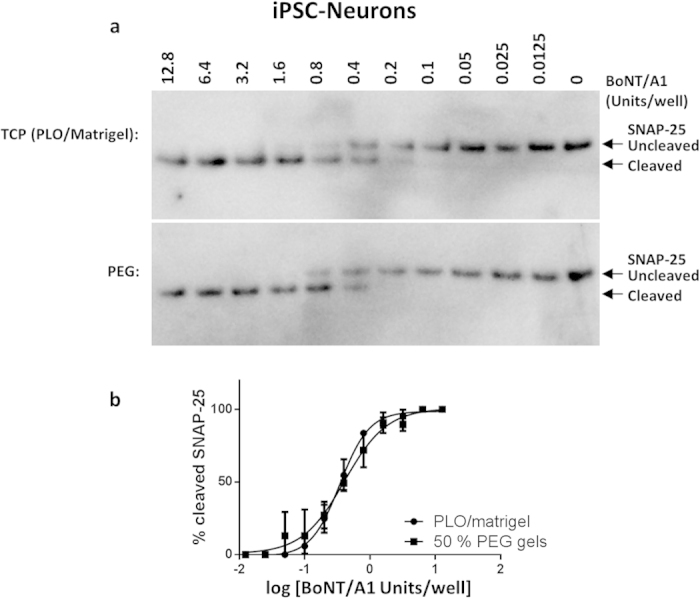
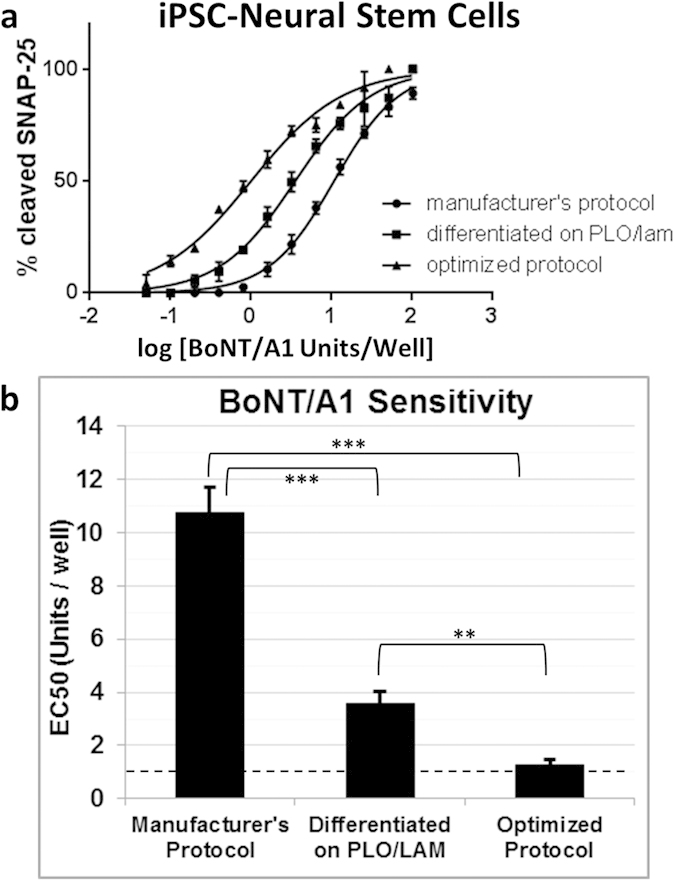
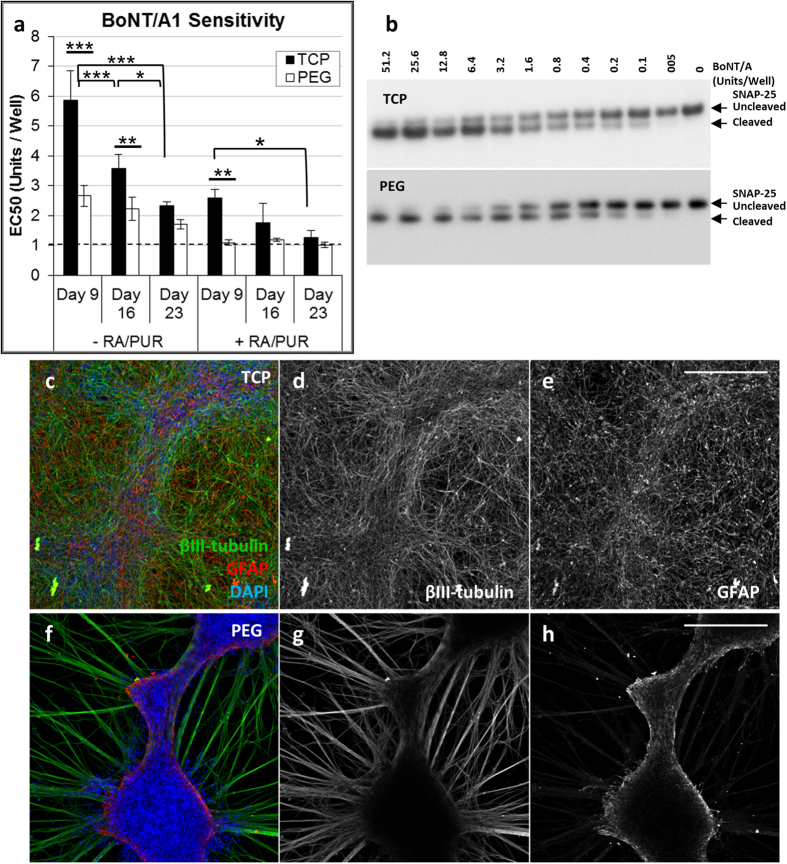
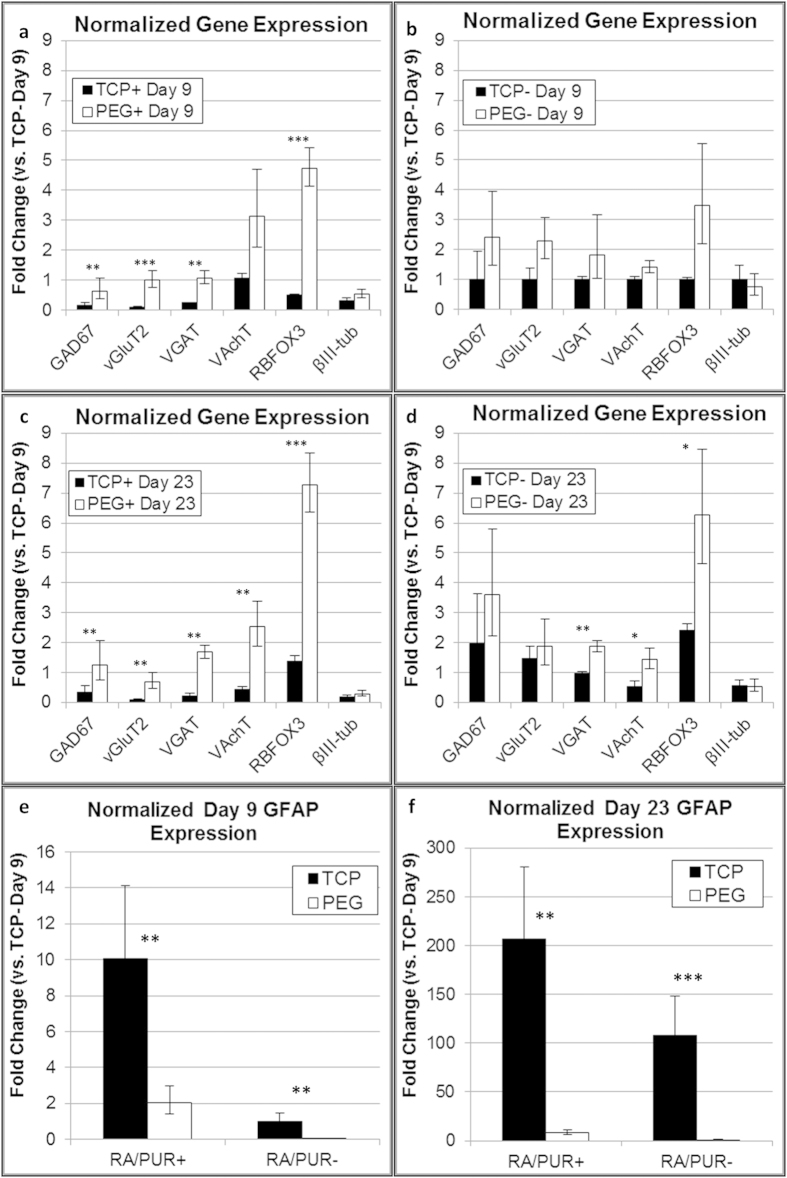
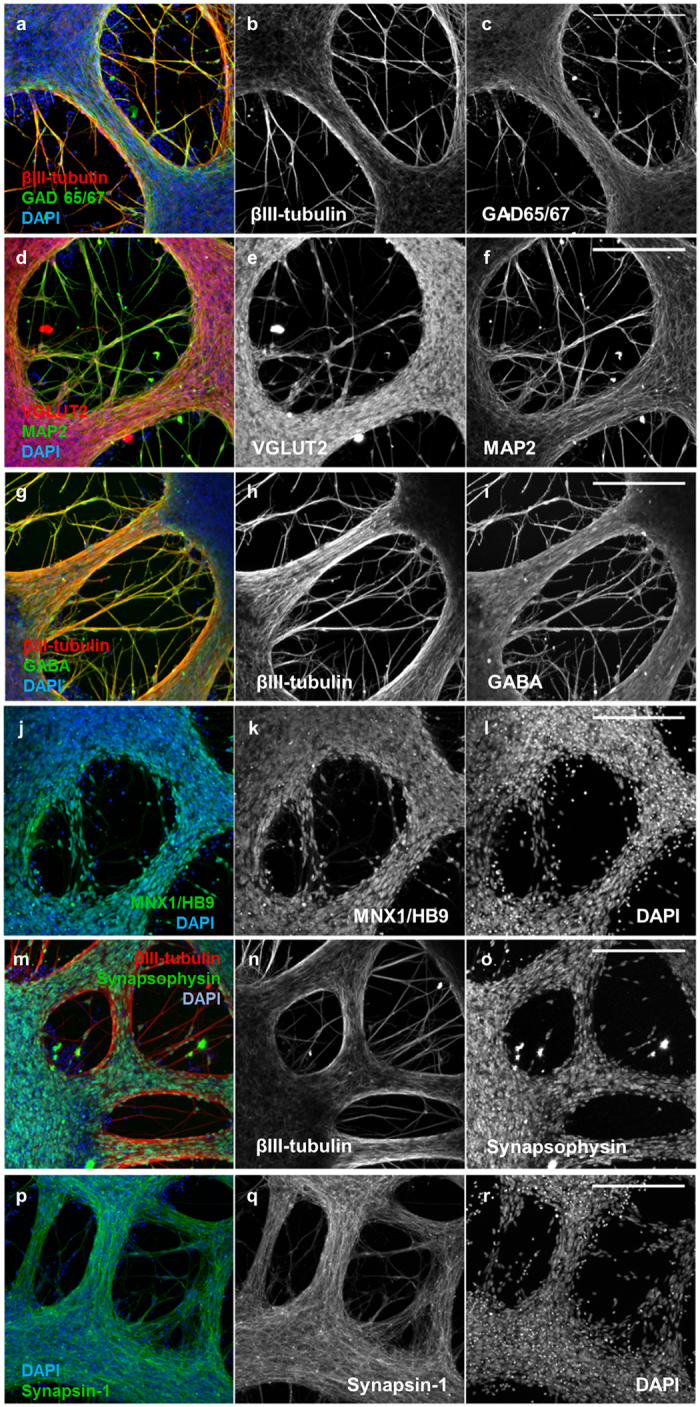
Botulinum neurotoxin (BoNT) detection provides a useful model for validating cell-based neurotoxicity screening approaches, as sensitivity is dependent on functionally competent neurons and clear quantitative endpoints are available for correlating results to approved animal testing protocols. Here, human induced pluripotent stem cell (iPSC)-derived neuronal cells were cultured on chemically-defined poly(ethylene glycol) (PEG) hydrogels formed by "thiol-ene" photopolymerization and tested as a cell-based neurotoxicity assay by determining sensitivity to active BoNT/A1. BoNT/A1 sensitivity was comparable to the approved in vivo mouse bioassay for human iPSC-derived neurons and neural stem cells (iPSC-NSCs) cultured on PEG hydrogels or treated tissue culture polystyrene (TCP) surfaces. However, maximum sensitivity for BoNT detection was achieved two weeks earlier for iPSC-NSCs that were differentiated and matured on PEG hydrogels compared to TCP. Therefore, chemically-defined synthetic hydrogels offer benefits over standard platforms when optimizing culture conditions for cell-based screening and achieve sensitivities comparable to an approved animal testing protocol.


Conflict of interest statement

J.A.T. is a founder and stockholder for Cellular Dynamics, Inc. R.J. is currently employed by MTI-GlobalStem, Inc.

Figures

Figure 1
Figure 1. BoNT/A1 detection using human iPSC-neurons cultured on TCP or PEG hydrogel surfaces.
Representative (a) Western blots for SNAP-25 cleavage and (b) EC50 curves for human iPSC-neurons cultured on poly-L-ornithine and Matrigel (PLO/Matrigel) coated tissue culture polystyrene (TCP) or poly(ethylene glycol) (PEG) hydrogels and treated with serial dilutions of BoNT/A1 (Units/Well). iPSC-neurons were exposed to BoNT/A1 for 48 h before cell lysates were harvested, followed by Western blot and densitometry analysis to quantify SNAP-25 cleavage. Sensitivity is expressed as BoNT activity (Units/well) to reach half the maximum response (EC50) for SNAP-25 cleavage, where 1 U is equivalent to the mLD50 determined using an in vivo mouse bioassay. The EC50 for iPSC-neurons was 0.41 ± 0.04 U/well on PEG hydrogels and 0.38 ± 0.06 U/well on PLO/Matrigel coated TCP.
Figure 2
Figure 2. Optimization of BoNT/A1 sensitivity for human iPSC-NSCs differentiated and matured on TCP.
The manufacturer’s protocol (see Methods) was modified to optimize BoNT/A1 sensitivity for iPSC-NSCs cultured on TCP by replacing the proprietary pre-coat solution with poly-L-ornithine and laminin treatment (“Differentiated on PLO/LAM”), supplementing the differentiation medium with retinoic acid (RA) and purmorphamine (PUR), and extending the maturation time to 23 days (“Optimized Protocol”). (a) Representative EC50 curves for human iPSC-neural stem cells (iPSC-NSCs) treated with serial dilutions of BoNT/A1 (Units/Well). Cultured cells were exposed to BoNT/A1 for 48 h before cell lysates were harvested, followed by Western blot and densitometry analysis to quantify SNAP-25 cleavage. (b) BoNT/A1 sensitivities (EC50, Mean ± S.D., 3 replicate experiments) for iPSC-NSCs cultured on TCP surfaces. The EC50 value is defined as the BoNT activity (Units/Well) required to reach half the maximum response for SNAP-25 cleavage, where 1 U is equivalent to the mLD50 determined using an in vivo mouse bioassay (dashed line). Statistical significance was determined using a one-way ANOVA (alpha = 0.05) followed by a Tukey test to compare individual means (Multiplicity adjusted P-values: **P ≤ 0.01; ***P ≤ 0.001).
Figure 3
Figure 3. Morphologies and BoNT/A1 sensitivity for iPSC-NSCs cultured on TCP or PEG hydrogel surfaces.
A comparison of iPSC-NSCs cultured on PEG hydrogels (PEG) or PLO/LAM coated TCP surfaces (TCP), differentiated for 5 days with (+) or without (−) RA/PUR and matured for 9, 16, or 23 days. (a) BoNT/A1 sensitivities (EC50, Mean ± S.D., 3 replicate experiments) for iPSC-NSCs cultured on TCP or PEG surfaces. The EC50 value is defined as BoNT activity (Units/Well) required to reach half the maximum response for SNAP-25 cleavage, where 1 U is equivalent to the mLD50 determined using an in vivo mouse bioassay (dashed line). Statistical significance was determined using a one-way ANOVA (alpha = 0.05) followed by a Tukey test to compare individual means (Multiplicity adjusted P-values: *P ≤ 0.05; **P ≤ 0.01; ***P ≤ 0.001) See Supplementary Table S1 for all sample comparisons. (b) Western blot data showing SNAP-25 cleavage for iPSC-NSCs that were differentiated for 5 days (with RA/PUR) and matured for 23 days and then treated with serial dilutions of BoNT/A1 (Units/Well). (c–h) Immunofluorescence imaging illustrating (c,f) βIII-tubulin (neurons, green), GFAP (glial, red), and DAPI (nuclei, blue) expression and single channel grayscale images for (d,g) βIII-tubulin, and (e,h) GFAP. Human iPSC-NSCs were differentiated (+RA/PUR) and matured (23 days) on (c–e) PLO/LAM treated TCP and (f–h) PEG hydrogels with 50% non-degradable SH-PEG-SH crosslinks and 3 mM CRGDS. Scale Bars: 250 μm.
Figure 4
Figure 4. Gene expression for iPSC-ECs differentiated and matured on TCP or PEG hydrogel surfaces.
Normalized gene expression was determined by RT-PCR for iPSC-NSCs cultured on PLO/LAM coated TCP (TCP) or poly(ethylene glycol) (PEG) hydrogel surfaces, differentiated with (+) or without (−) RA/PUR in the culture medium, and matured for (a,b,e) 9 days or (c,d,f) 23 days. Gene quantities were normalized to GAPDH and graphs represent fold-changes relative to iPSC-NSCs that were differentiated on TCP without RA/PUR and matured for 9 days (Mean ± S.D., n = 6 samples from 2 replicate experiments). Statistical significance was determined using a Student’s t-test (*P < 0.05; **P < 0.01; ***P < 0.005).
Figure 5
Figure 5. Neuronal markers expressed by iPSC-NSCs after differentiation and maturation on PEG hydrogels.
(a) βIII-tubulin (red), GAD 65/67 (green), and DAPI (nuclei, blue). Single channel grayscale images from (a) are shown for (b) βIII-tubulin and (c) GAD 65/67. (d) VGLUT2 (red), MAP2 (green), and DAPI (nuclei, blue). Single channel grayscale images from (d) are shown for (e) VGLUT2 and (f) MAP2. (g) βIII-tubulin (red), GABA (green), and DAPI (nuclei, blue). Single channel grayscale images from (g) are shown for (h) βIII-tubulin and (i) GABA. (j) MNX1/HB9 (green) and DAPI (nuclei, blue). Single channel grayscale images from (j) are shown for (k) MNX1/HB9 and (l) DAPI. (m) βIII-tubulin (red), Synapsophysin (green), and DAPI (nuclei, blue). Single channel grayscale images from (m) are shown for (n) βIII-tubulin and (o) Synapsophysin. (p) Synapsin-1 (green) and DAPI (nuclei, blue). Single channel grayscale images from (p) are shown for (q) Synapsin-1 and (r) DAPI. Scale Bars: 200 μm.

References

    1. Bal-Price A. et al. International STakeholder NETwork (ISTNET): creating a developmental neurotoxicity (DNT) testing road map for regulatory purposes. Arch. Toxicol. 89, 269–287 (2015). - PMC - PubMed
    1. Crofton K. M. et al. Developmental neurotoxicity testing: Recommendations for developing alternative methods for the screening and prioritization of chemicals. ALTEX-Altern. Anim. Exp. 28, 9–15 (2011). - PubMed
    1. Grandjean P. & Landrigan P. J. Neurobehavioural effects of developmental toxicity. Lancet Neurol. 13, 330–338 (2014). - PMC - PubMed
    1. Bellinger D. C. A Strategy for Comparing the Contributions of Environmental Chemicals and Other Risk Factors to Neurodevelopment of Children. Environ. Health Perspect. 120, 501–507 (2012). - PMC - PubMed
    1. Olson H. et al. Concordance of the toxicity of pharmaceuticals in humans and in animals. Regulatory Toxicology and Pharmacology 32, 56–67 (2000). - PubMed

Publication types