. 2015 Sep 28:5:14104.
doi: 10.1038/srep14104.

Cargo Delivery into the Brain by in vivo identified Transport Peptides

Affiliations

Cargo Delivery into the Brain by in vivo identified Transport Peptides

Eduard Urich et al. Sci Rep. .

Abstract

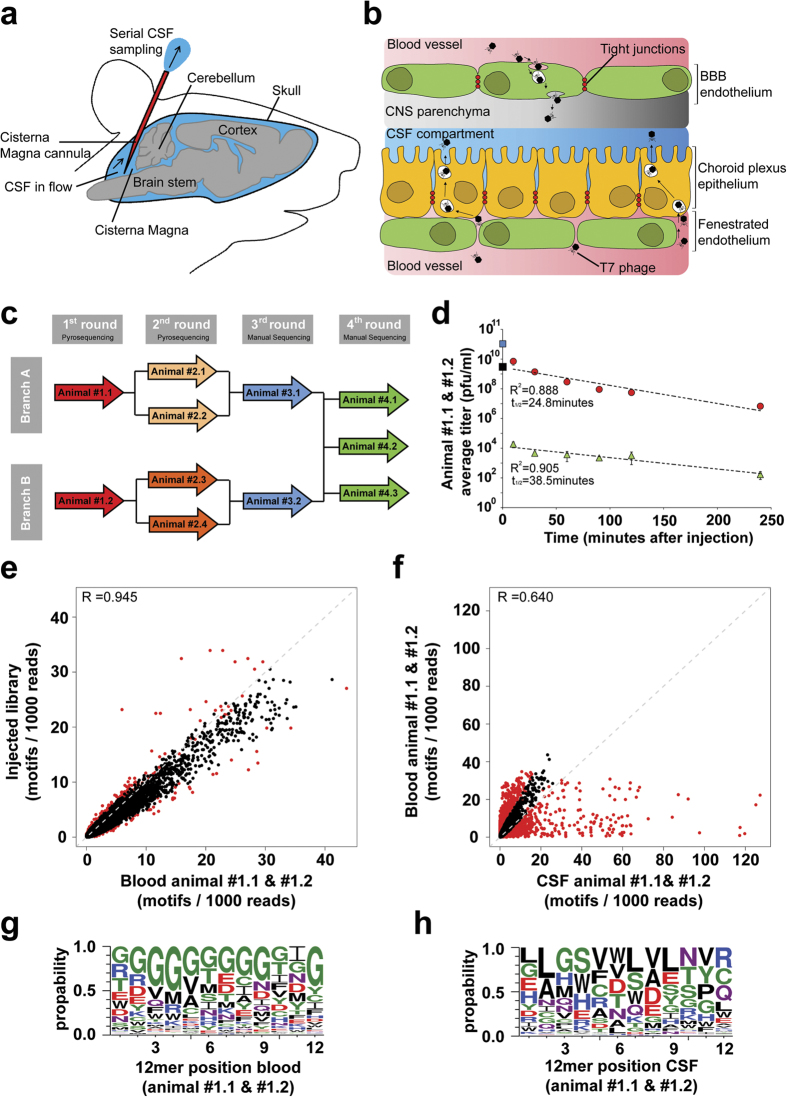
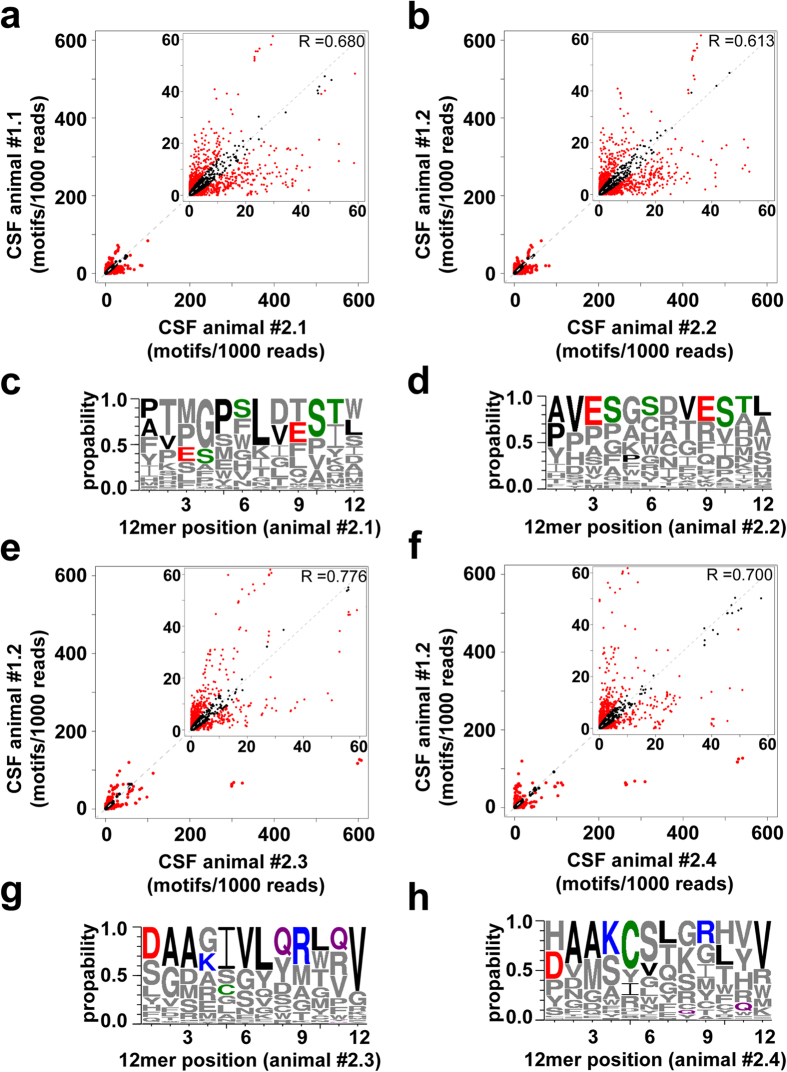
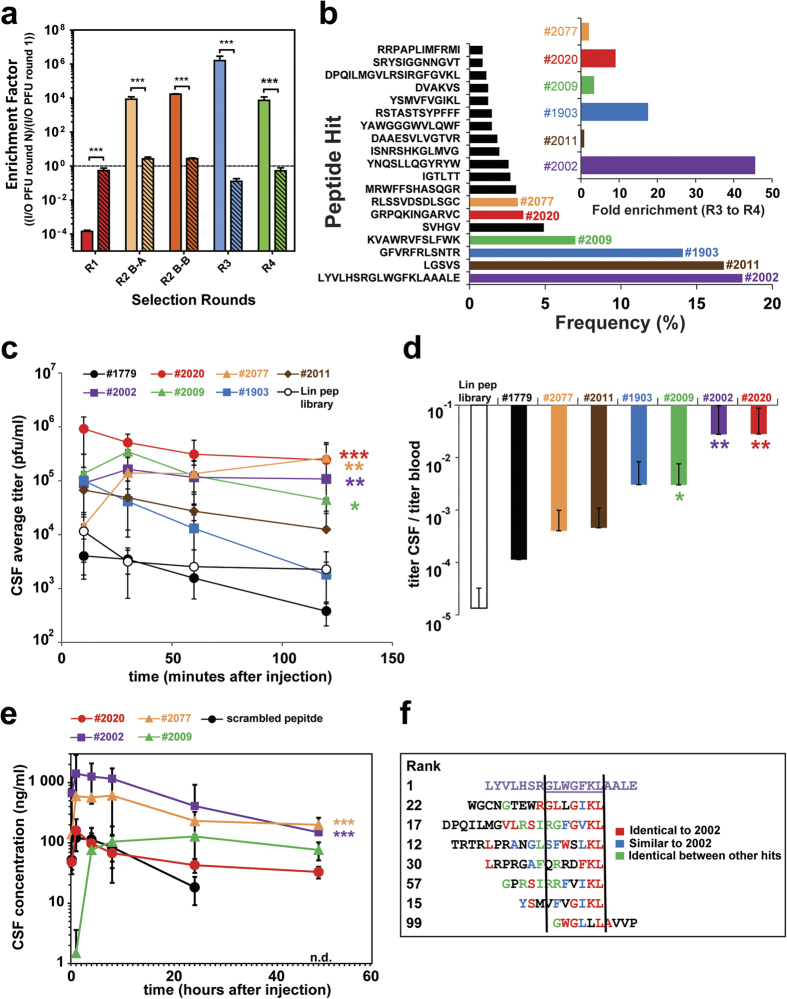
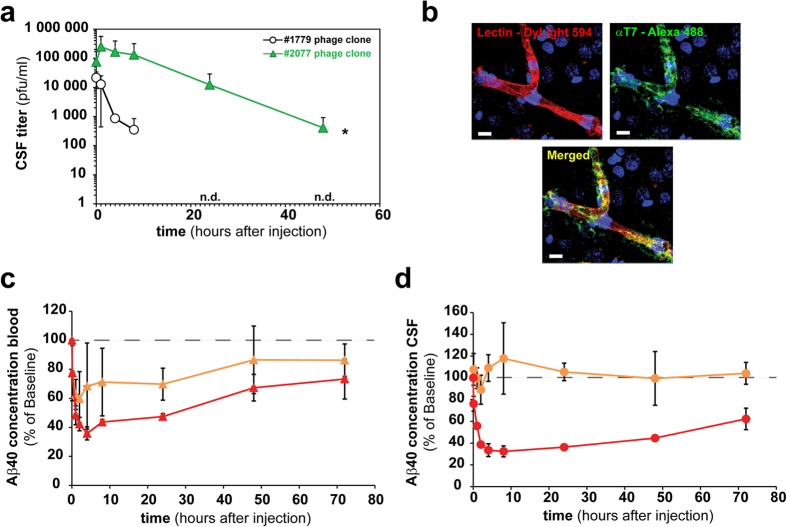
The blood-brain barrier and the blood-cerebrospinal fluid barrier prevent access of biotherapeutics to their targets in the central nervous system and therefore prohibit the effective treatment of neurological disorders. In an attempt to discover novel brain transport vectors in vivo, we injected a T7 phage peptide library and continuously collected blood and cerebrospinal fluid (CSF) using a cisterna magna cannulated conscious rat model. Specific phage clones were highly enriched in the CSF after four rounds of selection. Validation of individual peptide candidates showed CSF enrichments of greater than 1000-fold. The biological activity of peptide-mediated delivery to the brain was confirmed using a BACE1 peptide inhibitor linked to an identified novel transport peptide which led to a 40% reduction of Amyloid-β in CSF. These results indicate that the peptides identified by the in vivo phage selection approach could be useful transporters for systemically administrated large molecules into the brain with therapeutic benefits.


Conflict of interest statement

The authors declare no competing financial interests.

Figures

Figure 1
Figure 1. Functional in vivo phage-display screening for brain penetrating peptides.
(a) The methodological setup used for repeated cerebro spinal fluid (CSF) sampling from the cisterna magna. (b) Diagram showing cellular location of central nervous system (CNS) barriers and selection strategy which was used to identify peptides that cross the Blood Brain Barrier (BBB) and Blood CSF Barrier. (c) Flow chart description of the in vivo phage display screening. In every selection round phages are i.v. injected (animal ID inside arrows). Two independent selection branches (A,B) were kept separately until the 4th selection round. For the 3rd and 4th selection rounds every CSF recovered phage clone was manually sequenced. (d) Kinetics of phages recovered from blood (red circles) and CSF (green triangles) during the 1st selection round of two cannulated rats after i.v. injection of the T7 peptide library (2 × 1012 phages/animal). Blue square represents the averaged initial blood phage concentrations calculated from the injected phage amount considering the total blood volume. The black square displays the y-axis intercept of the straight line extrapolated from the blood phage concentrations. (e,f) Relative frequencies and distribution of the motifs representing all possible overlapping tripeptides found within the peptides. Displayed are the numbers of motifs found within 1000 reads. Motifs which are significantly (p < 0.001) enriched are highlighted by red colored dots. (e) Correlation scatter plots comparing the relative tripeptide motif frequencies of the injected library vs. the blood derived phages of animals #1.1 and #1.2. (f) Correlation scatter plots comparing the relative tripeptide motif frequencies of the blood and CSF recovered phages of animals #1.1 and #1.2. (g,h) Sequence logo representation of phages enriched in the blood (g) compared to the injected library and enriched in the CSF (h) compared to blood after one round of in vivo selection in both animals. The size of the single letter code represents the frequency of occurrence of that amino acid at a given position. Green = polar, purple = neutral, blue = basic, red = acidic & black = hydrophobic amino acids. Figure 1a,b was designed and produced by Eduard Urich.
Figure 2
Figure 2. Motifs and peptides enrichments in the CSF over two consecutive rounds of functional in vivo phage-display selection.
All CSF recovered phages from the 1st round of each animal (animals #1.1 & #1.2) were pooled, amplified, HT sequenced and re-injected together (2 × 1010 phages/animal) into 2 CM cannulated rats each (#1.1 → #2.1 & #2.2, #1.2 → #2.3 & #2.4). (a,b,e,f) Correlation scatter plots comparing the relative tripeptide motif frequencies of all CSF recovered phages in the 1st versus the 2nd selection round. Relative frequencies and distribution of the motifs representing all possible overlapping tripeptides found within the peptides in both directions. Displayed are the numbers of motifs found within 1000 reads. Motifs which are significantly (p < 0.001) selected or de-selected in one of the compared libraries are highlighted by red colored dots. (c,d,g,h) Sequence logo representation based on all 12 amino acid long sequences enriched in the CSF in the 2nd versus the 1st round of the in vivo selection. The size of the single letter code represents the frequency of occurrence of that amino acid at a given position. For the logo representation the frequency of the CSF recovered sequences from individual animals between the two selection rounds were compared and the enriched sequences in the 2nd round are displayed: (c) #1.1–#2.1 (d) #1.1–#2.2 (g) #1.2–#2.3 and (h) #1.2–#2.4. Most enriched amino acids at a given position in (c,d) animals #2.1 and #2.2 or in (g,h) animals #2.3 and #2.4 are displayed in colors. Green = polar, purple = neutral, blue = basic, red = acidic & black = hydrophobic amino acids.
Figure 3
Figure 3. Validation of CSF enriched phage-displayed peptides and CSF transport of biotinylated lead peptides conjugated to streptavidin payload.
(a) Calculated enrichment factors based on injected (input = I) phage titers (PFU) and determined CSF phage titers (output = O) over all four rounds (R1-R4). The enrichment factors for the last three rounds (R2-R4) were calculated by the comparison with the previous round and the first round (R1) with the wt data. Open bars are CSF and stipple bars are plasma. (***p < 0.001, based on students t-test). (b) List of the most enriched phage peptides, ranked based on their relative proportion to all CSF collected phages after the 4th selection round. The six most frequent phage clones are highlighted in colors, assigned with a number and their enrichment factors between the 3rd and 4th selection round (insert). (c,d) The six most enriched phage clones of the 4th round, the empty phage and the stock phage peptide library individually analyzed in the CSF sampling model. CSF and blood samples were collected at the indicated time points. (c) Equal amounts of 6 candidate phage clones (2 × 1010 phages/animal), empty phages (#1779) (2 × 1010 phages/animal) and the stock phage peptide library (2 × 1012 phages/animal) were tail vein i.v. injected in at least 3 CM cannulated animals each. The CSF pharmacokinetics of each injected phage clone and phage peptide library is displayed over time. (d) Display the average CSF/blood ratios of all recovered phage/ml over the sampling time. (e) Four synthesized peptide leads and a scrambled control attached through their N-terminal biotin to streptavidin (tetrameric display) and subsequently injected (tail vein i.v., 10 mg streptavidin/kg) in at least three cannulated rats (N = 3). CSF samples were collected at the indicated time points and the streptavidin concentration was measured by an anti-streptavidin ELISA in the CSF (n.d. = not detected). (*p < 0.05, **p < 0.01, ***p < 0.001, based on ANOVA test). (f) Comparison of the amino acid sequence of the most enriched phage peptide clone #2002 (purple) with other selected phage peptide clones from the 4th selection round. Identical and similar stretches of amino acids are color coded.
Figure 4
Figure 4. Lead transport peptide enhances brain BACE1 peptide inhibitory activity.
(a) Long term CSF pharmacokinetic profiles shown for the clonally injected (2 × 1010 phages/animal) T7 phage displayed #2077 (RLSSVDSDLSGC) peptide and the insert-less control phage (#1779) in at least three CM cannulated rats each. (b) Confocal microscopic image of a representative cortex microvessel in a rat i.v. injected with phage (2 × 1010 phages/animal) displaying the #2077 peptide and a vascular counterstaining (lectin). Indicated phage clones were injected into 3 rats and allowed to circulate for 1 hour before perfusion. The brain sectioned and stained with a polyclonal FITC labeled antibody against the T7 phage capsid. 10 minutes before perfusion and subsequent fixation DyLight594 labeled lectin was i.v. injected. Fluorescence images showing lectin (red) stained luminal side of the microvessel and the phage (green) in the capillary lumen and the perivascular brain tissue. Scale bar corresponds to 10 μm. (c,d) A biotinylated BACE1 inhibitory peptide alone or in combination with the biotinylated #2077 transport peptide was attached to streptavidin and subsequently i.v. injected (10 mg streptavidin/kg) in at least three CM cannulated rats each. BACE1 peptide inhibitor mediated Aβ40 reduction was measured by an Aβ1-40 ELISA in blood (red) and CSF (orange) at the indicated time points. For better visibility, a dashed line at 100% was drawn in the graphs. (c) The percentage blood (red triangles) and CSF (orange triangles) Aβ40 reduction in rats injected with streptavidin attached to the #2077 transport peptide and the BACE1 inhibitor peptide at a 3:1 ratio. (d) The percentage blood (red circles) and CSF (orange circles) Aβ40 reduction in rats injected with streptavidin attached with only BACE1 inhibitor peptides. The Aβ concentration for the control was 420 pg/ml (Std. deviation = 101 pg/ml).

References

    1. Lichota J., Skjorringe T., Thomsen L. B. & Moos T. Macromolecular drug transport into the brain using targeted therapy. Journal of Neurochemistry 113, 1–13, 10.1111/j.1471-4159.2009.06544.x (2010). - DOI - PubMed
    1. Brasnjevic I., Steinbusch H. W., Schmitz C. & Martinez-Martinez P. Delivery of peptide and protein drugs over the blood-brain barrier. Prog Neurobiol 87, 212–251, 10.1016/j.pneurobio.2008.12.002 (2009). - DOI - PubMed
    1. Pardridge W. M. The blood-brain barrier: bottleneck in brain drug development. NeuroRx 2, 3–14, 10.1602/neurorx.2.1.3 (2005). - DOI - PMC - PubMed
    1. Johanson C. E., Duncan J. A., Stopa E. G. & Baird A. Enhanced prospects for drug delivery and brain targeting by the choroid plexus-CSF route. Pharm Res 22, 1011–1037, 10.1007/s11095-005-6039-0 (2005). - PubMed
    1. Pardridge W. M. Re-engineering biopharmaceuticals for delivery to brain with molecular Trojan horses. Bioconjug Chem 19, 1327–1338, 10.1021/bc800148t (2008). - DOI - PubMed

MeSH terms