. 2015 Sep 28:5:14473.
doi: 10.1038/srep14473.

The determinant of periodicity in Mycoplasma pneumoniae incidence: an insight from mathematical modelling

Affiliations

The determinant of periodicity in Mycoplasma pneumoniae incidence: an insight from mathematical modelling

Ryosuke Omori et al. Sci Rep. .

Abstract

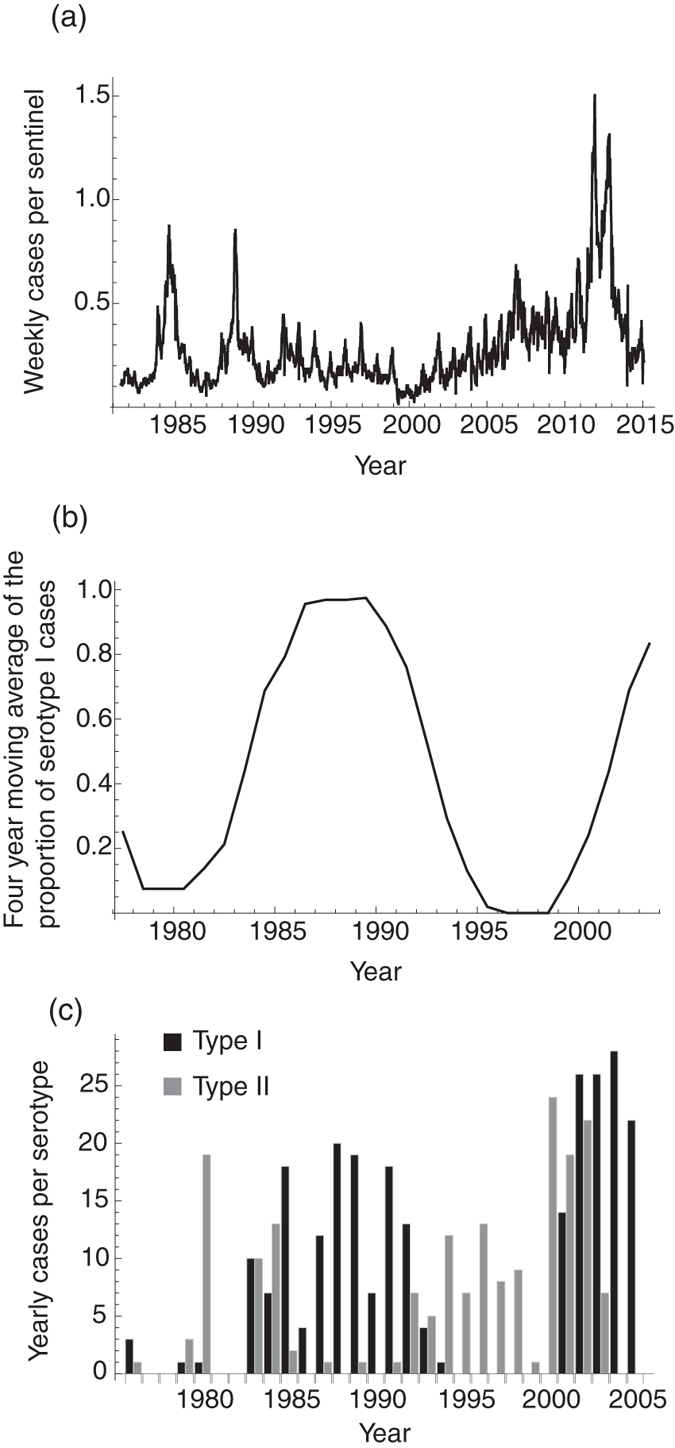
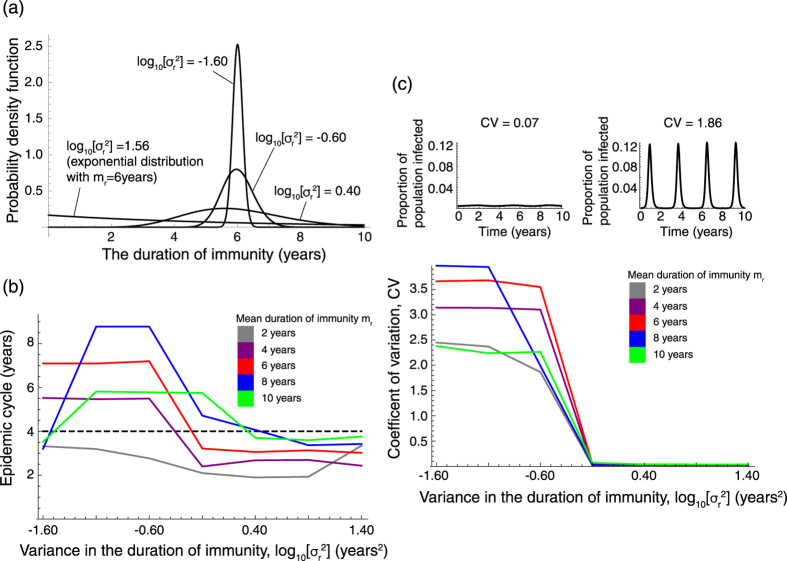
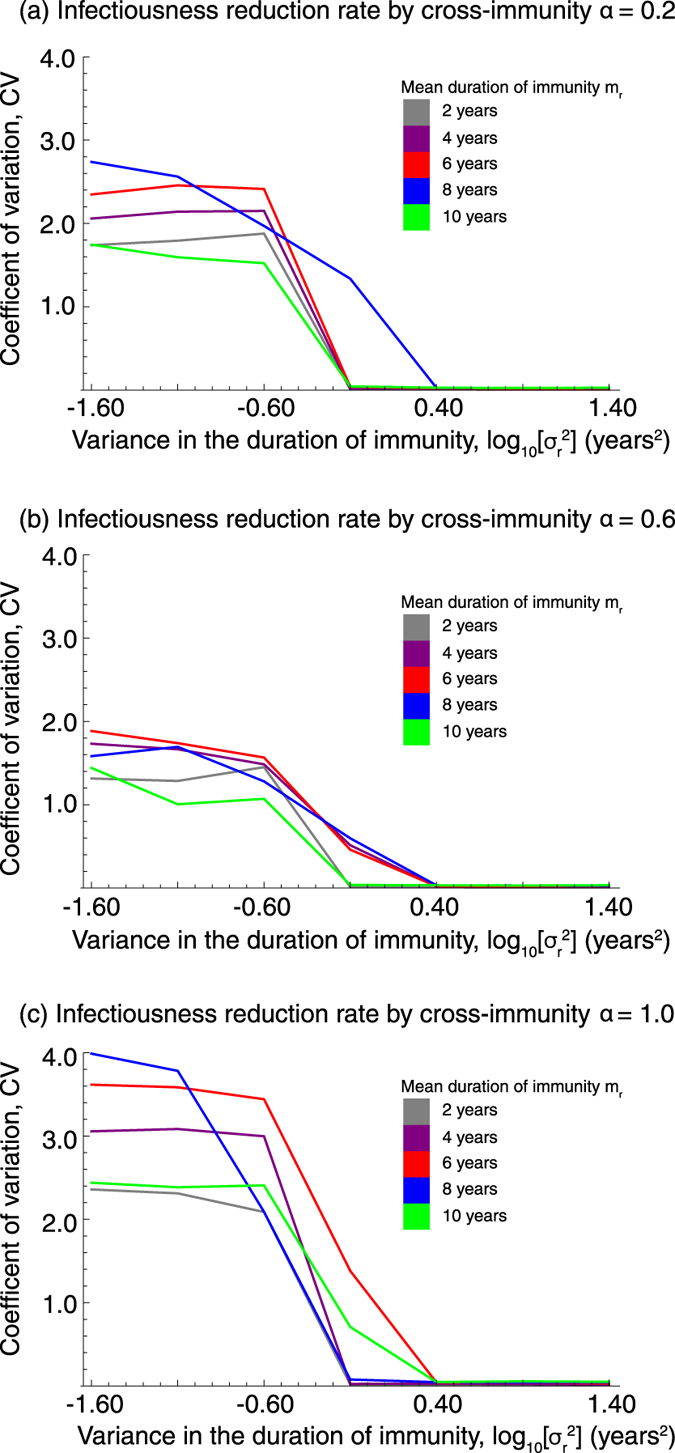
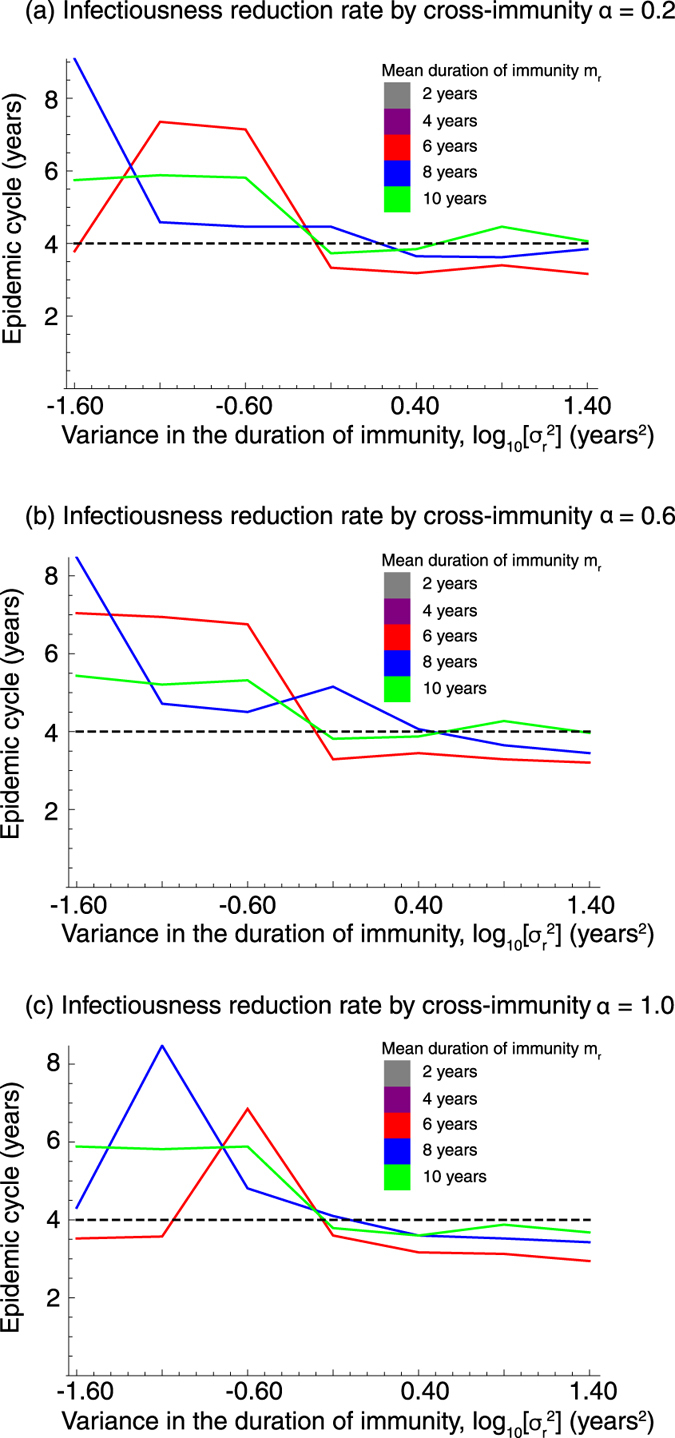
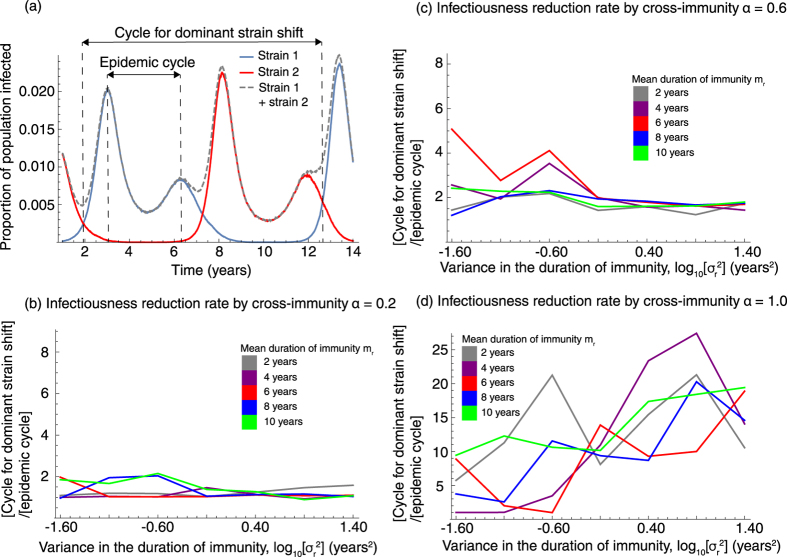
Until the early 1990 s, incidences of Mycoplasma pneumoniae (MP) infection showed three to five year epidemic cycles in multiple countries, however, the mechanism for the MP epidemic cycle has not been understood. Here, we investigate the determinant of periodicity in MP incidence by employing a mathematical model describing MP transmission dynamics. Three candidates for the determinant of periodicity were evaluated: school-term forcing, minor variance in the duration of immunity, and epidemiological interference between MP serotypes. We find that minor variation in the duration of immunity at the population level must be considered essential for the MP epidemic cycle because the MP cyclic incidence pattern did not replicate without it. Minor variation, in this case, is a less dispersed distribution for the duration of immunity than an exponential distribution. Various lengths of epidemic cycles, including cycles typically found in nature, e.g. three to five year cycles, were also observed when there was minor variance in the duration of immunity. The cyclic incidence pattern is robust even if there is epidemiological interference due to cross-immune protection, which is observed in the epidemiological data as negative correlation between epidemics per MP serotype.


Figures

Figure 1
Figure 1. MP incidence in Japan.
(a) Time series data of weekly MP cases per sentinel in Japan from 1981 to 2015. The figure shows the number of reported primary atypical pneumonia cases until March 1999 and MP cases after April 1999 due to the change in the law for reporting infectious diseases. The data were collected from nationwide sentinel clinics and integrated by the Infectious Diseases Surveillance Center, National Institute of Infectious Diseases, Japan (http://idsc.nih.go.jp/index.html). (b) Annual detection rate of serotype I among all reported MP cases with the four-year moving average. (c) Time series data of yearly cases per serotype from 1976 to 2005. The data shown in (a) were collected from the whole area of Japan while most data shown in (b,c) were collected from Kanagawa prefecture in Japan.
Figure 2
Figure 2. Epidemic cycles with varied infectious periods and latent periods.
Short latent and infectious periods are required for epidemic cycles longer than one year (the periodicity of school terms). The latent and infectious periods for MP are both 2 to 3 weeks. Black denotes annual epidemic cycles and white denotes epidemic cycles longer than one year. To explore the possibility of oscillation the epidemic cycles were calculated with varied b from 1.1 to 17.0 (the estimated b for measles cases in the U.K. is 1.727). Mean duration of immunity is assumed to be 7 years.
Figure 3
Figure 3. The impact of variance in the duration of immunity on MP epidemics.
(a) The distribution of the immunity duration with mean = 6 years and varied variance. We assumed Δt = 1/200 years. (b) The relationship between variance in the duration of immunity and the epidemic cycle. The dashed line shows the 4 year cycle observed in Japan. (c) Variance in the duration of immunity determines the oscillation of the epidemic curve.
Figure 4
Figure 4. The impact of epidemiological interference by cross-immunity on the oscillation of the epidemic curve.
The strength of the cross-immune reaction is denoted by α; α = 0 means no cross-immune reaction and α = 1 means perfect protection by cross-immune reaction. The coefficient of variation, CV, of the number of people infected with any strain was measured. CV is a measure of the variation in the number of infected individuals over time.
Figure 5
Figure 5. The impact of epidemiological interference on the MP epidemic cycle.
The epidemic cycle for the number of people infected with any strain was measured. The dashed line shows the 4-year cycle observed in Japan.
Figure 6
Figure 6. The impact of epidemiological interference on the cycle for dominant strain shift.
(a) Illustrates the relationship between the cycle for dominant shift and the epidemic cycle on the MP epidemic with mr = 8 years, log10[σr2] = −0.60 and α = 0.6. (bd) show the cycles for dominant strain shift with varied strength of cross-immune protection α.

References

    1. Jacobs E. Mycoplasma pneumoniae: now in the focus of clinicians and epidemiologists. Euro Surveill. 17, 2–4 (2012). - PubMed
    1. Waites K. B. & Talkington D. F. Mycoplasma pneumoniae and its role as a human pathogen. Clin. Microbiol. Rev. 17, 697–728 (2004). - PMC - PubMed
    1. Kenri T. et al. Genotyping analysis of Mycoplasma pneumoniae clinical strains in Japan between 1995 and 2005: type shift phenomenon of M-pneumoniae clinical strains. J. Med. Microbiol. 57, 469–475 (2008). - PubMed
    1. Ito I. et al. Culturally verified Mycoplasma pneumoniae pneumonia in Japan: a long-term observation from 1979–99. Epidemiol. Infect. 127, 365–367 (2001). - PMC - PubMed
    1. Morozumi M. et al. Increased macrolide resistance of Mycoplasma pneumoniae in pediatric patients with community-acquired pneumonia. Antimicrob. Agents Chemother. 52, 348–350 (2008). - PMC - PubMed

Publication types

LinkOut - more resources