. 2015 Nov 5;17(5):611-23.
doi: 10.1016/j.stem.2015.08.011. Epub 2015 Sep 24.

Hematopoietic Differentiation Is Required for Initiation of Acute Myeloid Leukemia

Affiliations

Hematopoietic Differentiation Is Required for Initiation of Acute Myeloid Leukemia

Min Ye et al. Cell Stem Cell. .

Abstract

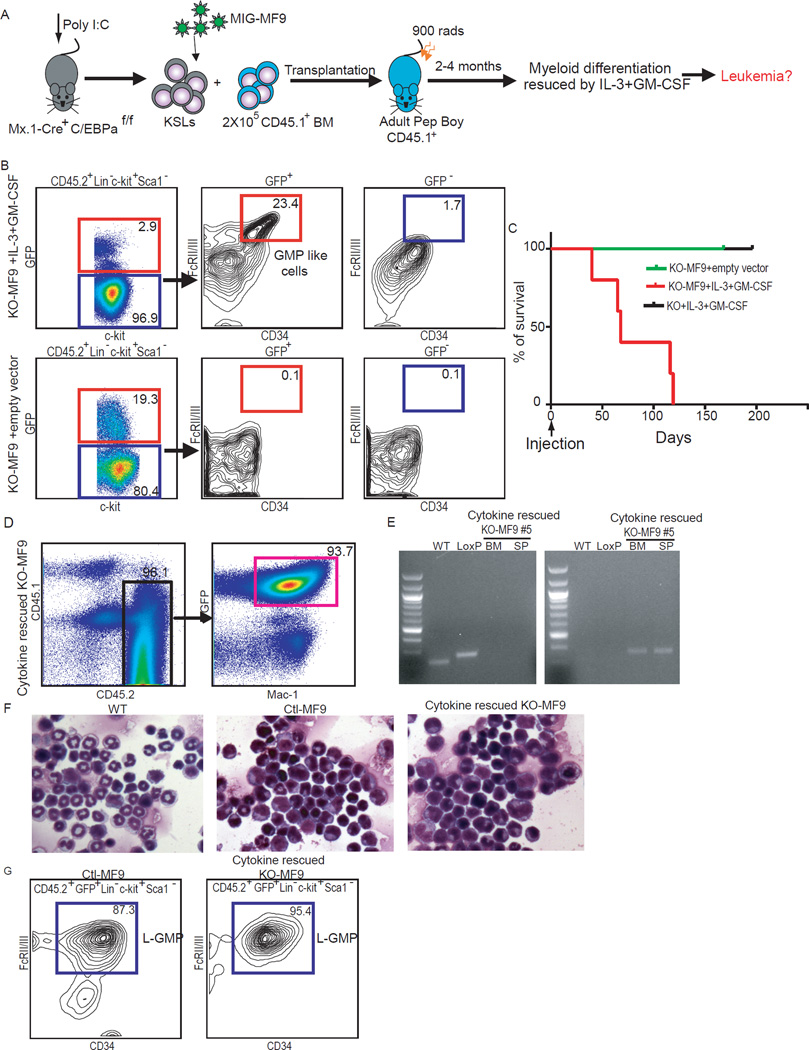
Mutations in acute myeloid leukemia (AML)-associated oncogenes often arise in hematopoietic stem cells (HSCs) and promote acquisition of leukemia stem cell (LSC) phenotypes. However, as LSCs often share features of lineage-restricted progenitors, the relative contribution of differentiation status to LSC transformation is unclear. Using murine MLL-AF9 and MOZ-TIF2 AML models, we show that myeloid differentiation to granulocyte macrophage progenitors (GMPs) is critical for LSC generation. Disrupting GMP formation by deleting the lineage-restricted transcription factor C/EBPa blocked normal granulocyte formation and prevented initiation of AML. However, restoring myeloid differentiation in C/EBPa mutants with inflammatory cytokines reestablished AML transformation capacity. Genomic analyses of GMPs, including gene expression and H3K79me2 profiling in conjunction with ATAC-seq, revealed a permissive genomic environment for activation of a minimal transcription program shared by GMPs and LSCs. Together, these findings show that myeloid differentiation is a prerequisite for LSC formation and AML development, providing insights for therapeutic development.


Figures

Figure 1
Figure 1. Loss of C/EBPa abrogates AML induced by MLL-AF9 or MOZ-TIF2 transduced hematopoietic stem or myeloid progenitor cells
A, Outline of experiment strategy. Five days after poly(inosinic acid) poly(cytidylic acid) (Poly I:C) injections, LinSca-1+c-kit+ cells (KSLs) or their downstream common myeloid progenitors (CMPs) were isolated from control (Ctl) or C/EBPa conditional knockout (KO) mouse bone marrow, transduced with either MIG-MF9 or MIG-MOZ-TIF2 retroviruses, and transplanted into lethally irradiated CD45.1+ B6.SJL-Ptprca Pep3b/BoyJ (Pep Boy) congenic recipients along with 2×10⁵ Pep Boy bone marrow cells for radioprotection. B, Kaplan-Meier survival analysis of mice receiving MF9 transduced Ctl or KO KSLs (Ctl: n=18, blue; KO: n=17, red) (P<0.01) or CMPs (Ctl: n=9, green; KO: n=12, purple) (P < 0.01). C, Representative flow cytometry analysis of peripheral blood from mice transplanted with either MF9 transduced Ctl (Ctl-MF9) (upper) or KO (KO-MF9) (lower) KSLs 7 weeks after transplantation. Cells were analyzed for expression of GFP, CD45.2 (donor-derived), myeloid (Gr1) and lymphoid (B220, CD4 or CD8) markers and demonstrated that GFP+ cells in KO-MF9 recipients were predominantly lymphocytes, in contrast to predominantly myeloid cells in Ctl-MF9 recipients. D, Kaplan-Meier survival analysis of mice receiving either MOZ-TIF2 transduced Ctl (n=8, blue) or KO (n=12, red) KSLs (P < 0.01). E and F, Flow cytometry analysis of bone marrow from recipients transplanted with KO-MF9 KSLs 11 months post-transplantation. Representative plots of KO-MF9 recipient (Mouse #5) displaying the presence of MF9 transduced KO donor derived (CD45.2+GFP+) KSLs (E), CMPs and megakaryocyte–erythroid progenitors (MEPs) (F), but absence of granulocyte macrophage progenitor (GMP) like cells in both GFP+ MF9 transduced (gated in red) and GFP untransduced (gated in blue) KO derived cells (F). G, Flow cytometry plot showing the presence of CMPs, MEPs, and GMPs derived from CD45.1+ congenic cells in bone marrow of KO-MF9 recipient (Mouse #5). H, I, and J, qRT-PCR showing levels of transcripts of the MF9 fusion gene, HoxA9, and Meis1 in MF9 transduced GFP+ KSLs and CMPs isolated from KO-MF9 recipients (Mouse #3 and #4) 6 months post-transplantation, as compared to levels in their untransduced GFP fractions in corresponding populations, as well as to levels in L-GMPs derived from Ctl-MF9 leukemic mice.
Figure 2
Figure 2. Deletion of C/EBPa in already initiated MF9 induced AML does not eliminate leukemia development
A, Schematic outline of experiment strategy. KSLs were isolated from Ctl or Mx.1-Cre+C/EBPaf/f conditional KO (cKO) prior to Poly I:C injections, transduced with MIG-MF9, and transplanted into lethally irradiated Pep Boy mice along with 2×10⁵ Pep Boy bone marrow cells. Poly I:C treatment was initiated 4 weeks post transplantation in recipients carrying 5–30% of GFP+ cells in peripheral blood. Leukemia development was monitored by survival and evaluated by % of GFP+ cells in blood, spleen, and bone marrow. B, Kaplan-Meier survival analysis of recipients that received 10 Poly I:C injections following transplantation with either Ctl-MF9 or cKO-MF9 KSLs (Ctl, n=9, blue; cKO, n=7, red). The Poly I:C treatment period is indicated by an arrow (P > 0.05). C, Limiting dilution assay measuring the frequency of leukemia stem cells (LSC) after C/EBPa deletion in already initiated MF9 induced leukemia. Upper, logarithmic plot showing the percentage of negative recipients transplanted with different cell doses of GFP+ bone marrow cells isolated from either Ctl-MF9 or cKO-MF9 leukemic mice. Recipients surviving 4 months post-transplantation with no detectable GFP+ cells in blood, spleen, and bone marrow were considered as non-responders. Lower, table showing the number of recipients that developed leukemia and the total number of recipients transplanted per cell dose. Frequencies of LSCs were calculated according to Poisson statistics using L-Calc software based on data from two independent experiments (Chi-squared test; P < 0.01). D, Survival curves for mice transplanted with 104 or 105 GPF+ bone marrow cells from primary mice receiving Poly I:C injections (Log-rank test: 104 groups: P<0.05; for 105 groups: P>0.05). E, Representative flow cytometry analysis of bone marrow from moribund secondary (2nd) recipients showing similar surface expression of Mac-1 and Gr1 on GFP+ cells. F, Genotyping of sorted GFP+Gr1+Mac-1+ cells from bone marrow of 2nd recipients showing deletion of C/EBPa alleles. Wild type (WT) (265 bp), LoxP (304 bp), and deleted alleles (Δ) (377 bp) were amplified by the one-PCR-reaction method.
Figure 3
Figure 3. Rescue of myeloid differentiation restores LSC formation and AML development
A, Experimental outline. Mice were transplanted with MF9 transduced KO KSLs as described in Fig. 1A. Myeloid differentiation was rescued by hydrodynamics-based injection of 1 µg IL-3 and GM-CSF expressing vectors 2–4 months after transplantation. B, Representative flow cytometry plots of bone marrow (cytokine KO-MF9 mouse #3) showing L-GMP like cells (Linc-kit+Sca-1CD34+FcrRII/III+) in GFP+ MF9 transduced KO derived cells in recipients 4 weeks after injection with IL-3 and GM-CSF expressing vector (upper), but not in the fraction of GFP MF9 untransduced KO cells or KO derived cells from KO-MF9 recipients receiving empty vector injections (lower). C, Kaplan-Meier survival analysis of KO-MF9 recipients injected with either the combination of GM-CSF and IL-3 vectors (red) or empty vector (green) 2–4 months post-transplantation, or recipients transplanted with untransduced KO KSLs followed by GM-CSF and IL-3 vector injection (black). The day that mice received the hydrodynamics-based injection was set as Day 0 (P<0.01). D, Representative flow cytometry analysis of moribund recipients of KO-MF9 2 months after the injection of IL-3 and GM-CSF vectors revealed abundant CD45.2+GFP+Gr1+Mac-1+ leukemic cells in bone marrow (cytokine rescued KO-MF9 mice). E, Genotyping of sorted CD45.2+Gr1+Mac-1+ cells from bone marrow and spleen of KO-MF9 AML mouse showing deletion of C/EBPa alleles. WT (236 bp), LoxP (275 bp), and Δ alleles (377 bp) were amplified by the two-PCR-reaction method. F, Wright-Giemsa staining of bone marrow cells derived from cytokine rescued KO-MF9 mice showing immature myeloid blasts, morphologically indistinguishable from leukemia cells derived from MF9 transduced Ctl cells (Ctl-MF9). G, Flow cytometry showing the presence of an L-GMP population in moribund cytokine rescued KO-MF9 leukemic recipients similar to that in Ctl-MF9 mice.
Figure 4
Figure 4. Myeloblastic leukemia develops in secondary recipients transplanted with cytokine rescued KO-MF9 leukemic bone marrow
A, Kaplan-Meier curve of survival for secondary recipients transplanted with 5×10⁴ bone marrow (n=5, red) and spleen (n=8, blue) cells from cytokine rescued KO-MF9 primary mice. B, Flow cytometry analysis of the spleen of secondary recipients transplanted with cytokine rescued KO-MF9 leukemic mouse bone marrow showing abundant KO derived Mac-1+ myeloblasts. C, Representative plots of bone marrow from secondary recipients transplanted with either Ctl-MF9 (left) or cytokine rescued KO-MF9 (right) bone marrow cells showing immunophenotypically indistinguishable leukemic GMP (L-GMP) populations. D, qRT-PCR showing levels of C/EBPa transcripts in L-GMPs from either Ctl-MF9 (Ctl L-GMP) or cytokine rescued KO-MF9 (KO L-GMP) primary leukemic mice or their 2nd recipients.
Figure 5
Figure 5. The MF9 induced oncogenic program is restored in cytokine rescued KO-MF9 L-GMPs in the absence of C/EBPa
A, Unsupervised clustering based on global gene expression of Ctl L-GMPs and KO L-GMPs from primary and 2nd leukemic mouse bone marrow, and GFP+ MF9 transduced but untransformed KSLs and CMPs from KO-MF9 recipients injected with empty vector (KO-MF9 KSLs; KO-MF9 CMPs), as well as WT CMPs, WT GMPs, and KO CMPs. B, C, and D, GSEA analysis of L-GMPs from Ctl-MF9 (B) and cytokine rescued KO L-GMP (C) leukemia mice as well as MF9 transduced but untransformed KO CMPs (KO-MF9 CMP) (D) from KO-MF9 recipients for enrichment of the MF9 induced leukemia self-renewal signature, as compared to WT GMPs. The normalized enrichment scores (NES) and P values are indicated in each plot.
Figure 6
Figure 6. A transcriptional program associated with myeloid lineage commitment, growth, and metabolism is shared by GMPs and L-GMPs
A and B, Venn diagram showing the overall overlap (A) between genes differentially expressed during the transition from CMP to GMPs and the formation of L-GMPs; and the overlap in down-regulated (left) and up-regulated (right) genes individually (B) (Hypergeometric test; p<0.01). C and D, Pathway analysis of genes down-regulated (C) or up-regulated (D) in the formation of GMPs and L-GMPs indicating enriched gene sets and pathways that potentially involved in blocking or promoting myeloid differentiation and MF9 induced leukemogenesis. Blue bars represent the percentage of the number of genes in the pathway of interest relative to the total number of genomic genes (Genomic background). Red bars represent the number of differentially expressed genes in the pathway of interest to all differentially expressed genes. E and F, qRT-PCR analysis of representative genes that were either down-regulated (E) or up-regulated (F) in the transition from CMPs to GMPs. However, these changes were reversed in C/EBPa KO CMPs, In contrast, in cytokine rescued KO L-GMPs levels of their expression were restored. The expression of each gene in WT CMPs was set as 1, and the relative fold changes of gene expression in other population were represented. Data represent mean value (±SD) of replicate arrays. (n=3 different samples in each group).
Figure 7
Figure 7. Changes in H3K79me2 modification and DNA accessibility during myeloid differentiation correlate with the acquisition of a transcriptional program permissive for MLL-fusion transformation in GMPs
A, Heatmap showing expression of the transcriptional program of 412 genes shared by GMPs and L-GMPs, including 210 genes (upper) that were down-regulated and 202 genes (lower) that were up-regulated during the formation of GMPs and L-GMPs. B, Heatmap showing relative dimethylation of histone H3 lysine K79 (K79Me2) binding strengths on the gene body (−2kb upstream to transcription start site to the end of untranslated region) of the 412 genes across WT KSLs, GMPs and L-GMPs. C, Unbiased k-means clustering of ATAC-Seq peaks ±10kb either side of the 412 common genes. K=3 was chosen based on minimum average silhouette width. Motifs in ATAC-Seq peaks were discovered de novo relative to a sequence composition-matched background set, and cross-referenced to a known motif database to find matches to transcription factors (Homer2).

References

    1. Aikawa Y, Katsumoto T, Zhang P, Shima H, Shino M, Terui K, Ito E, Ohno H, Stanley ER, Singh H, et al. PU.1-mediated upregulation of CSF1R is crucial for leukemia stem cell potential induced by MOZ-TIF2. Nat Med. 2010;16:580–585. 581p following 585. - PMC - PubMed
    1. Bereshchenko O, Mancini E, Moore S, Bilbao D, Mansson R, Luc S, Grover A, Jacobsen SE, Bryder D, Nerlov C. Hematopoietic stem cell expansion precedes the generation of committed myeloid leukemia-initiating cells in C/EBPalpha mutant AML. Cancer Cell. 2009;16:390–400. - PubMed
    1. Bernt KM, Zhu N, Sinha AU, Vempati S, Faber J, Krivtsov AV, Feng Z, Punt N, Daigle A, Bullinger L, et al. MLL-rearranged leukemia is dependent on aberrant H3K79 methylation by DOT1L. Cancer Cell. 2011;20:66–78. - PMC - PubMed
    1. Bhatia M, Bonnet D, Kapp U, Wang JC, Murdoch B, Dick JE. Quantitative analysis reveals expansion of human hematopoietic repopulating cells after short-term ex vivo culture. J Exp Med. 1997;186:619–624. - PMC - PubMed
    1. Buenrostro JD, Giresi PG, Zaba LC, Chang HY, Greenleaf WJ. Transposition of native chromatin for fast and sensitive epigenomic profiling of open chromatin, DNA-binding proteins and nucleosome position. Nat Methods. 2013;10:1213–1218. - PMC - PubMed

Publication types

MeSH terms

Substances

Associated data