. 2015:562:27-47.
doi: 10.1016/bs.mie.2015.04.013. Epub 2015 Aug 21.

Next-Generation AUC: Analysis of Multiwavelength Analytical Ultracentrifugation Data

Affiliations

Next-Generation AUC: Analysis of Multiwavelength Analytical Ultracentrifugation Data

Gary E Gorbet et al. Methods Enzymol. 2015.

Abstract

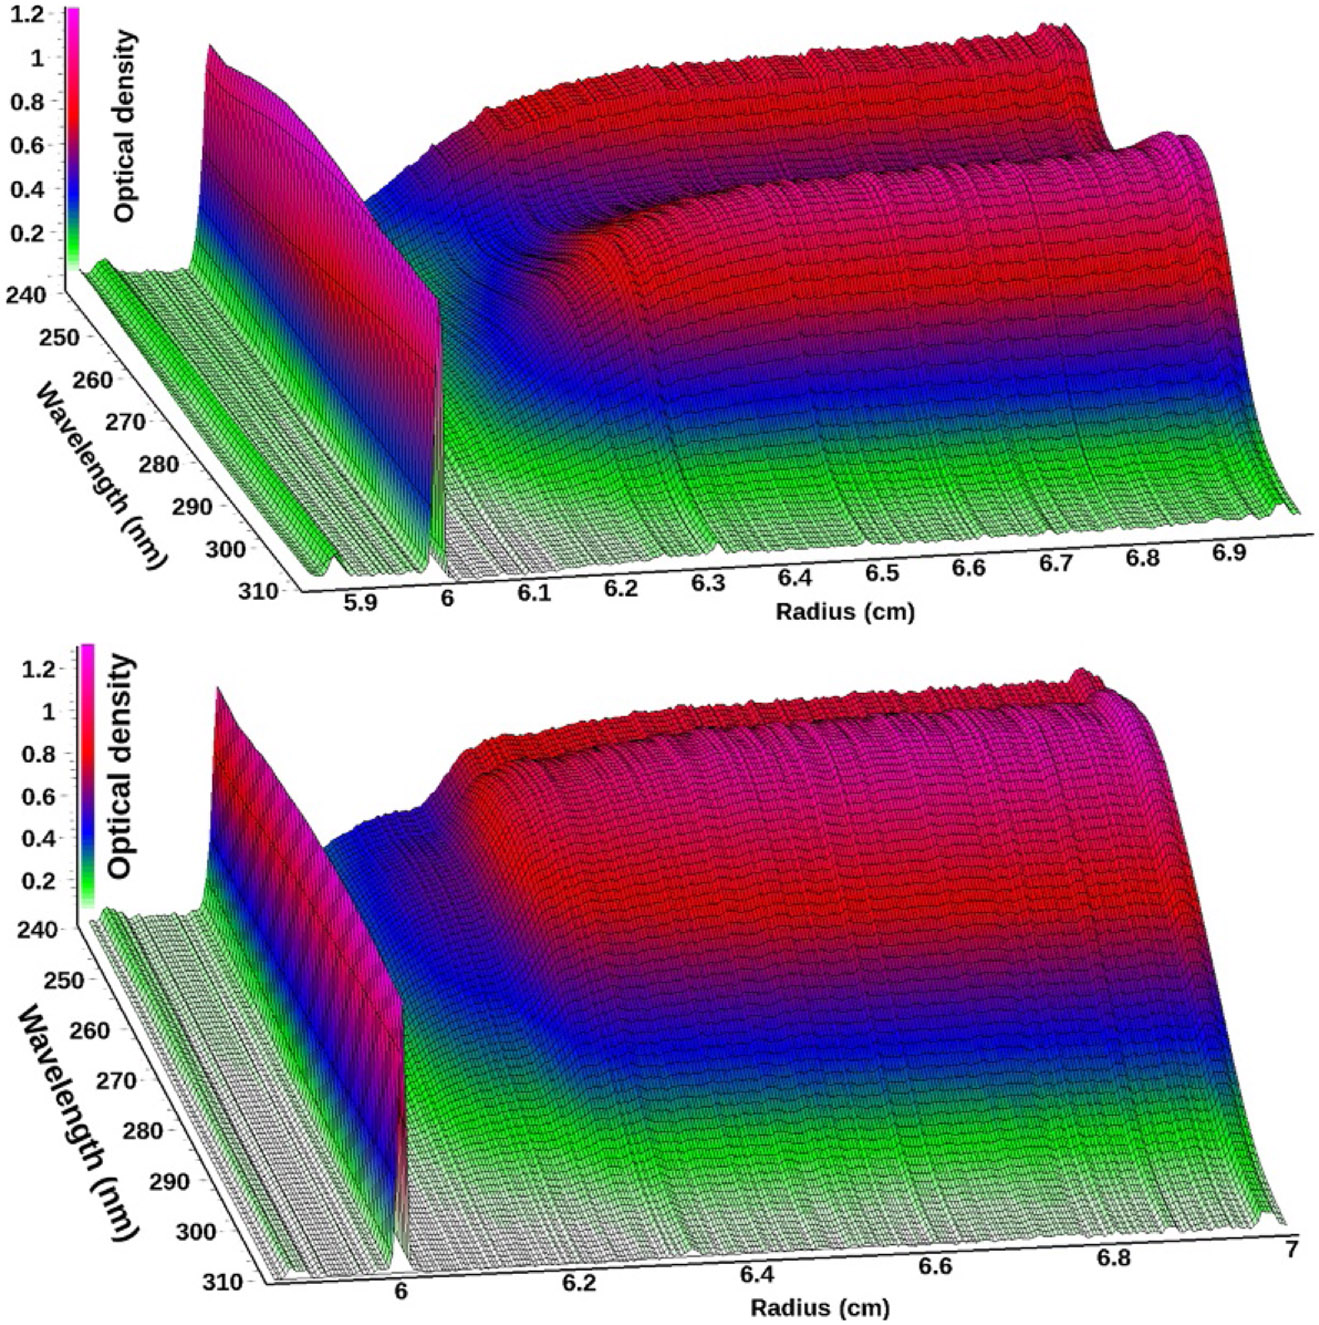
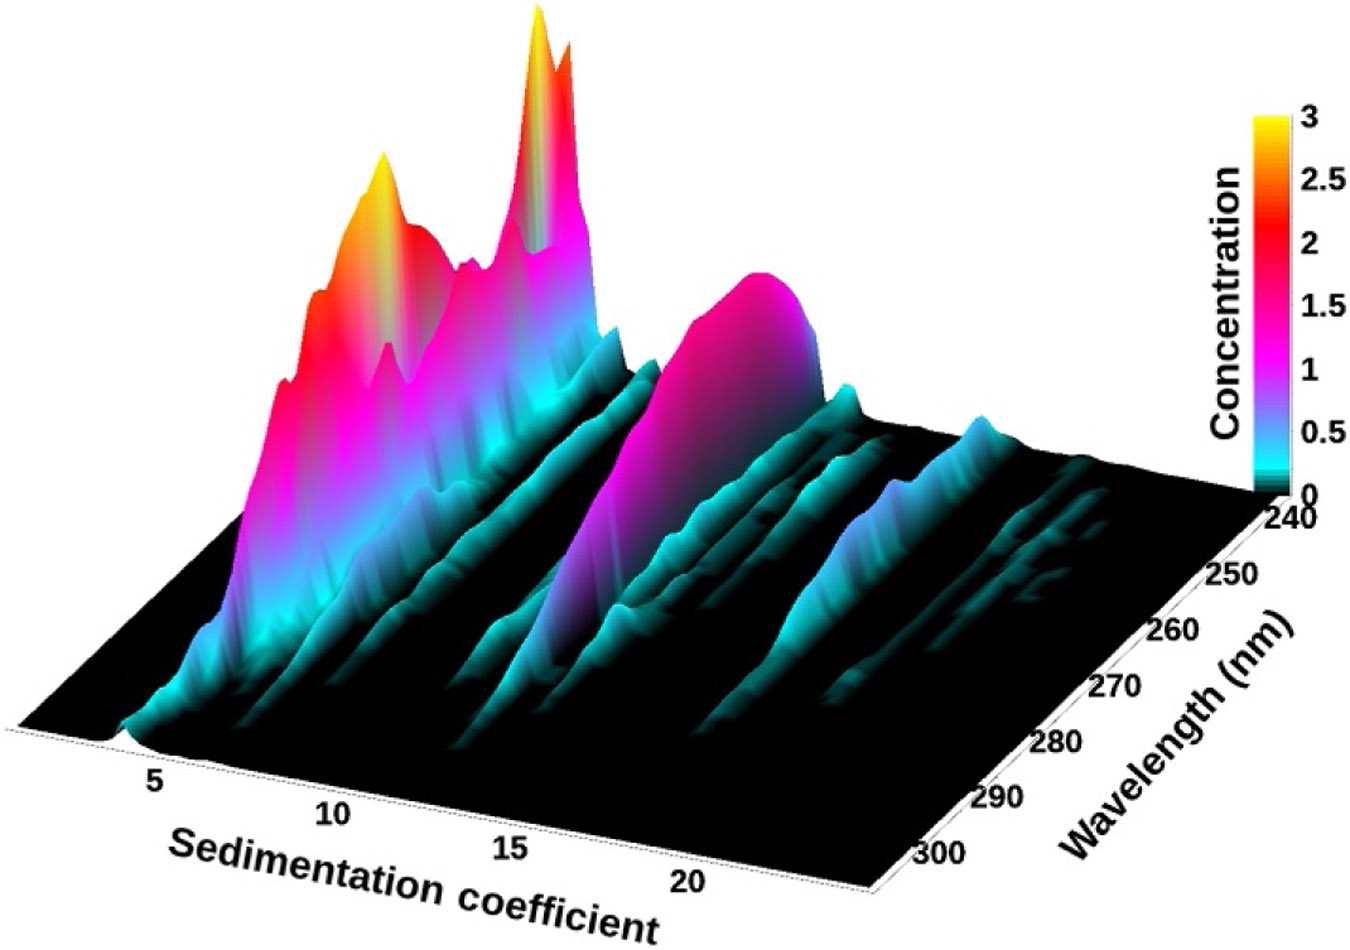
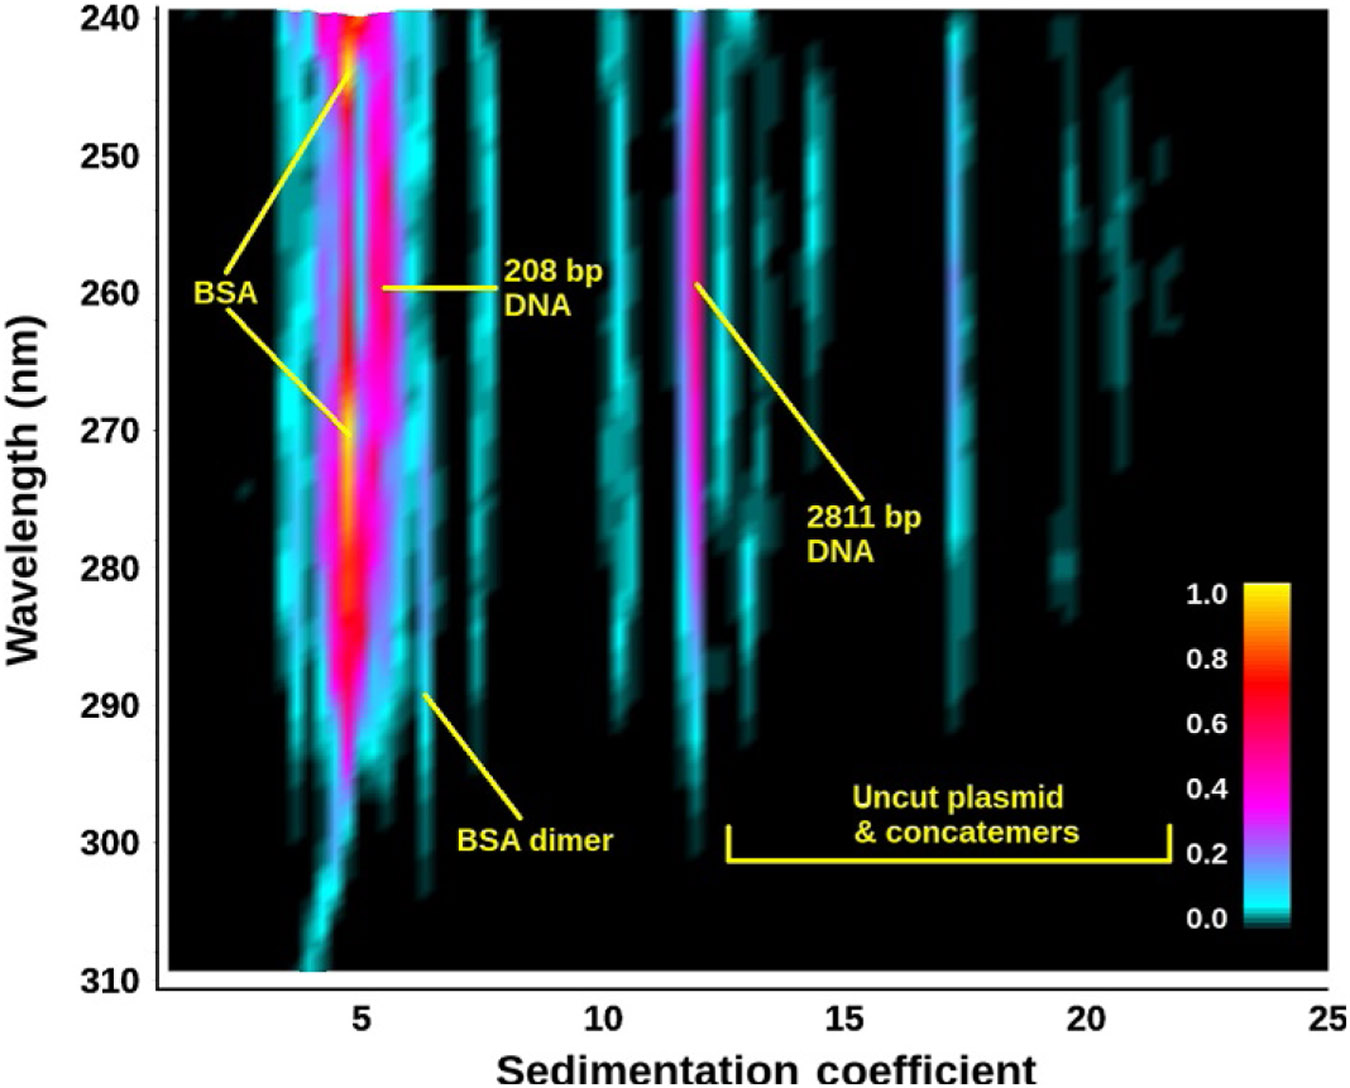
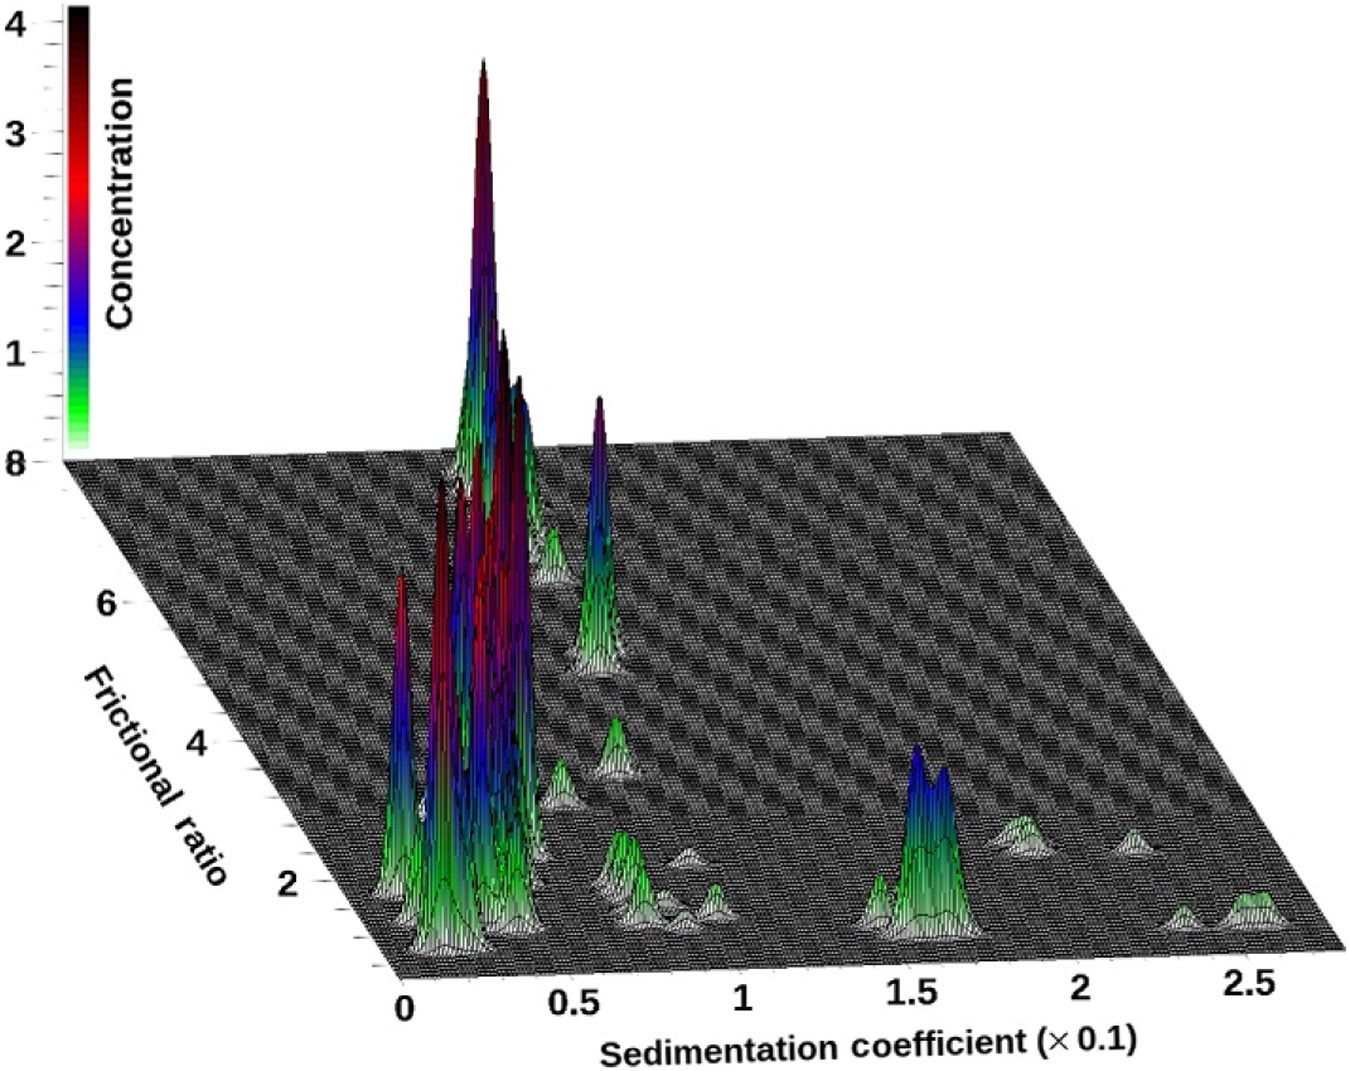
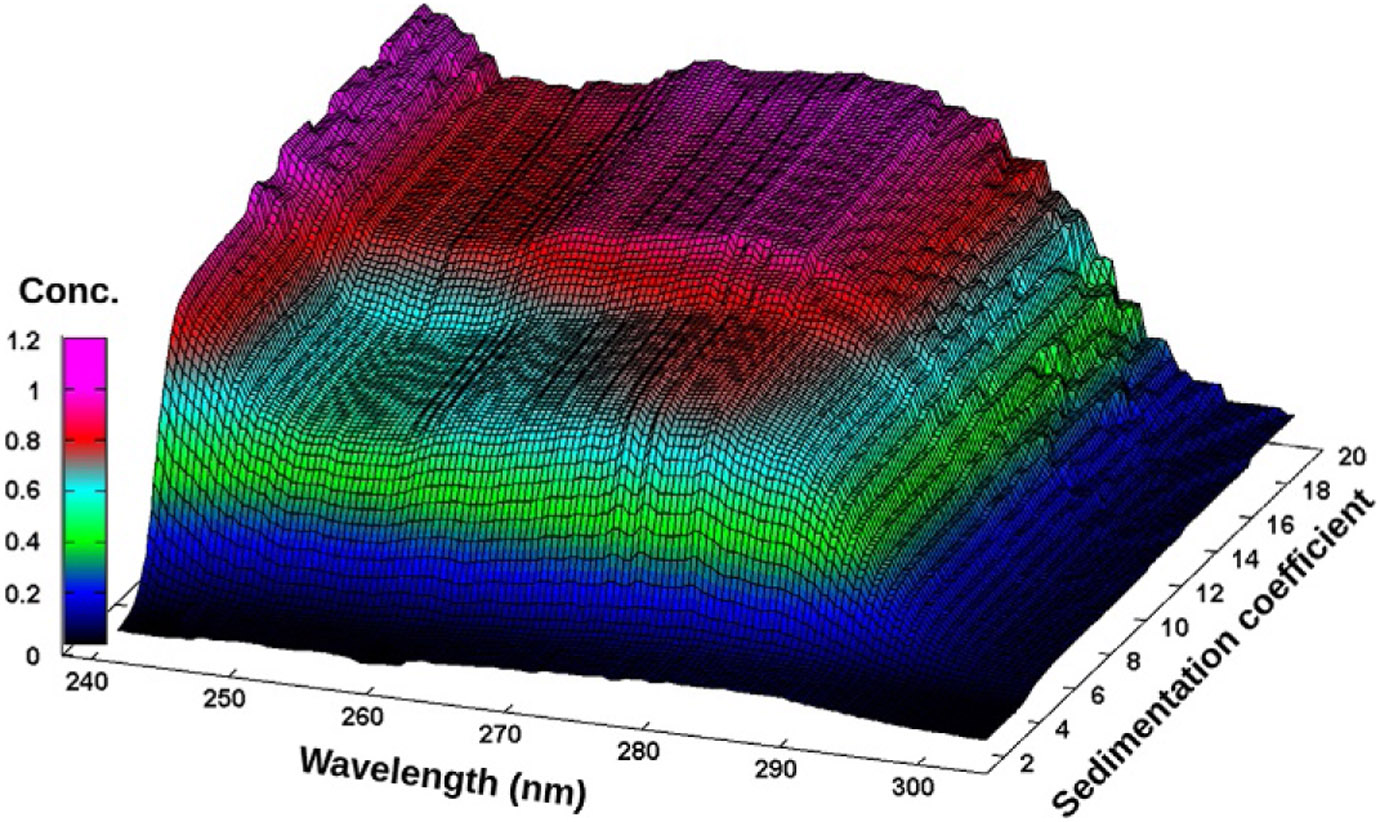
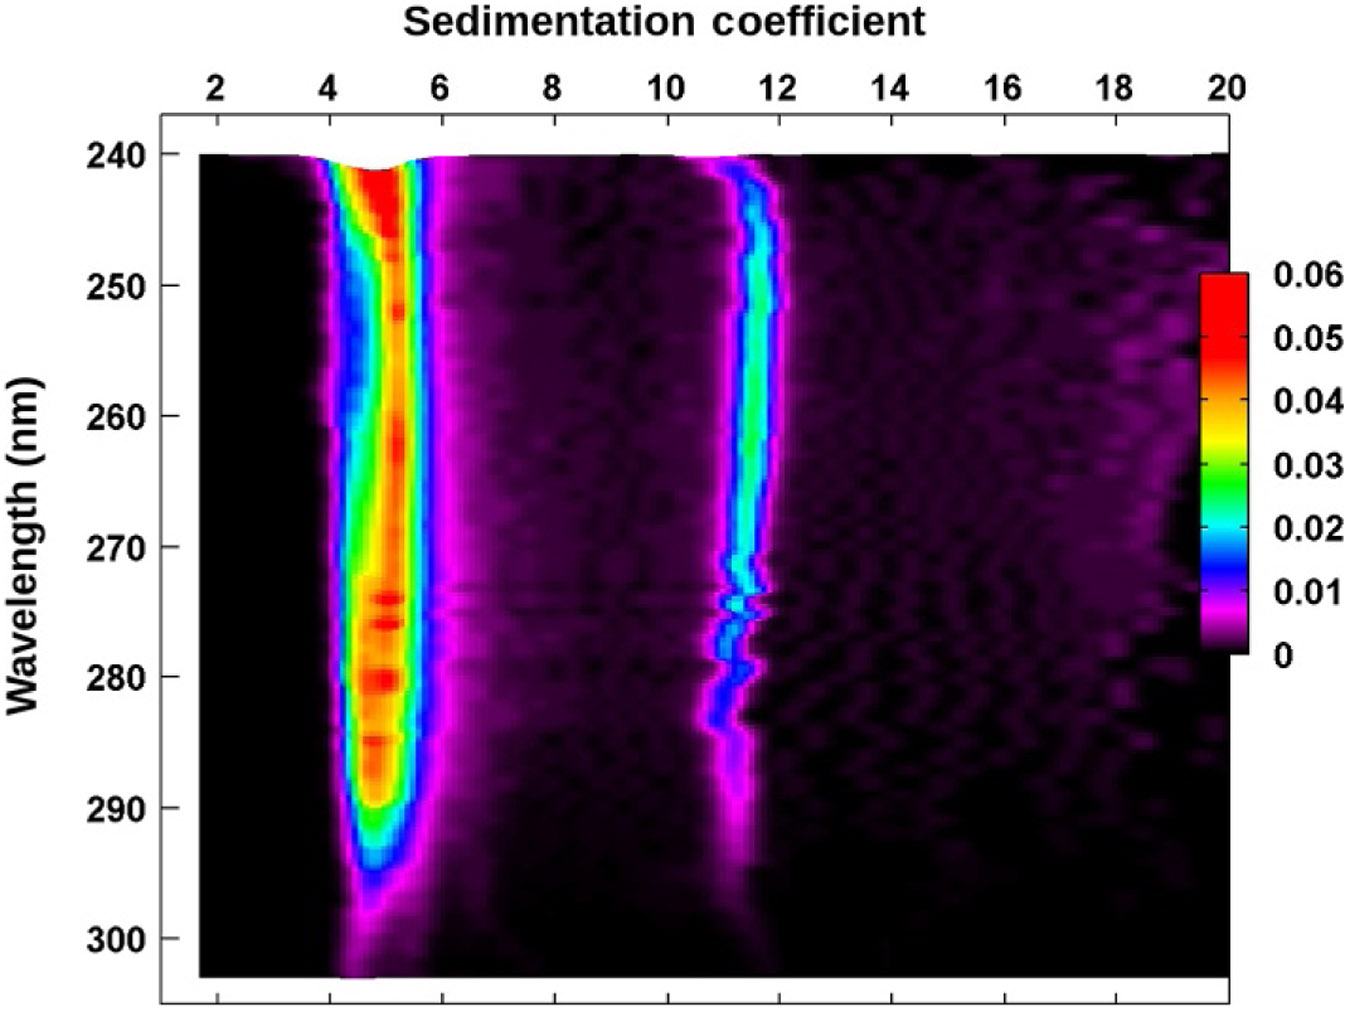
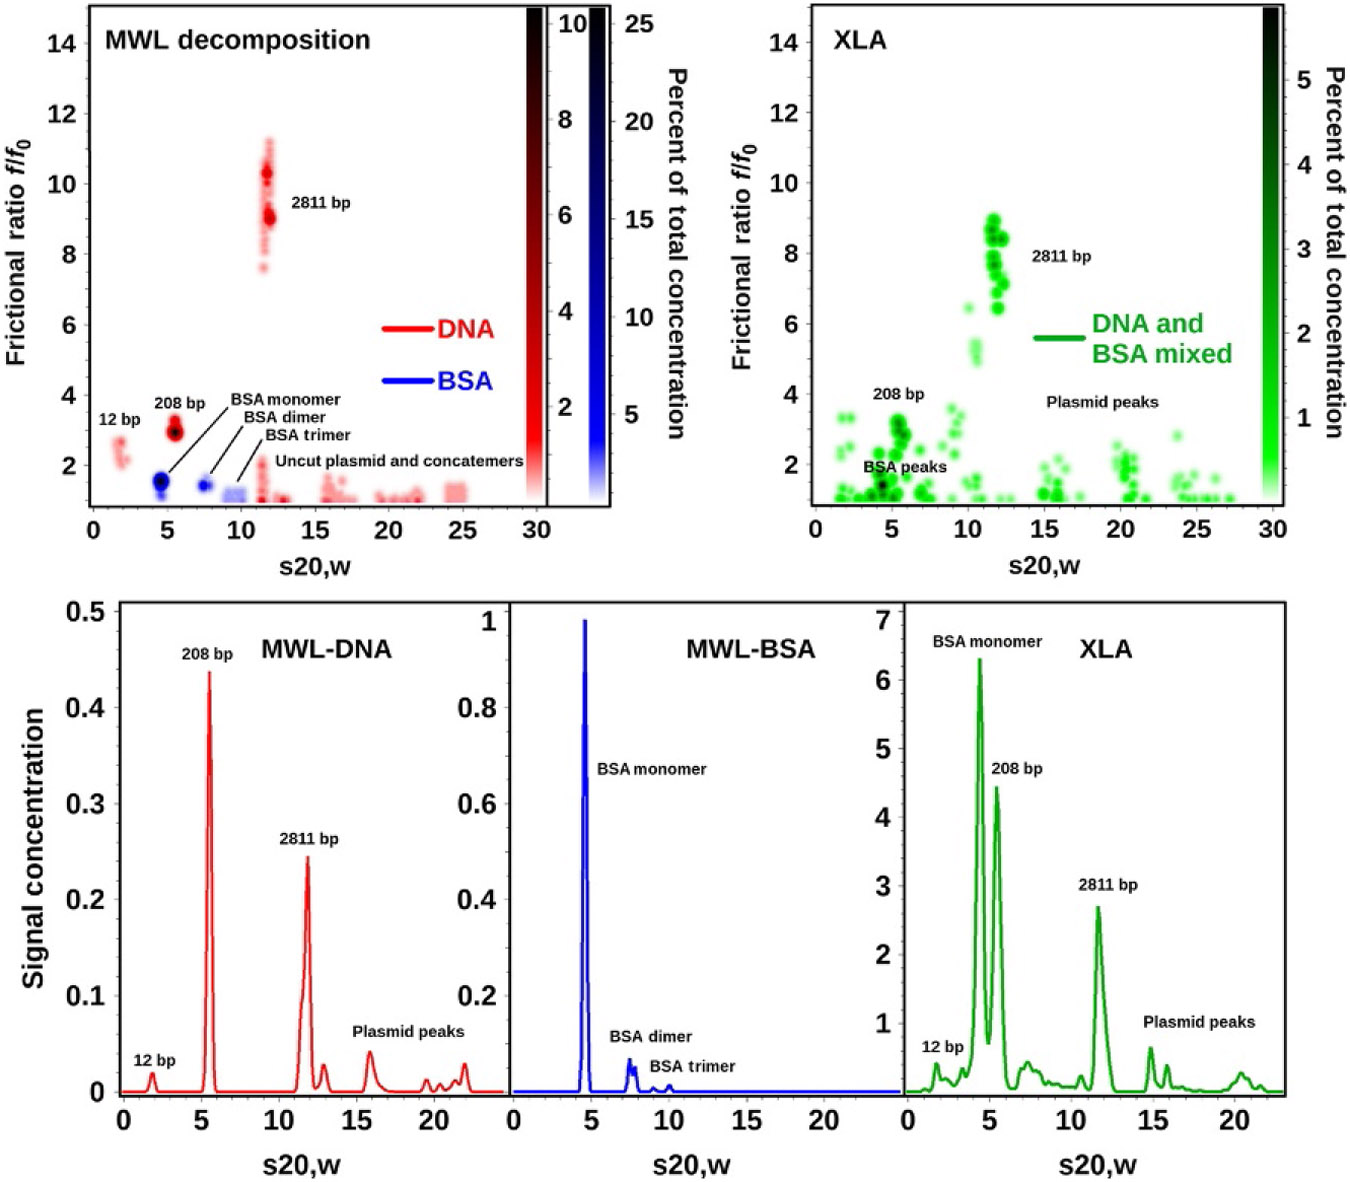
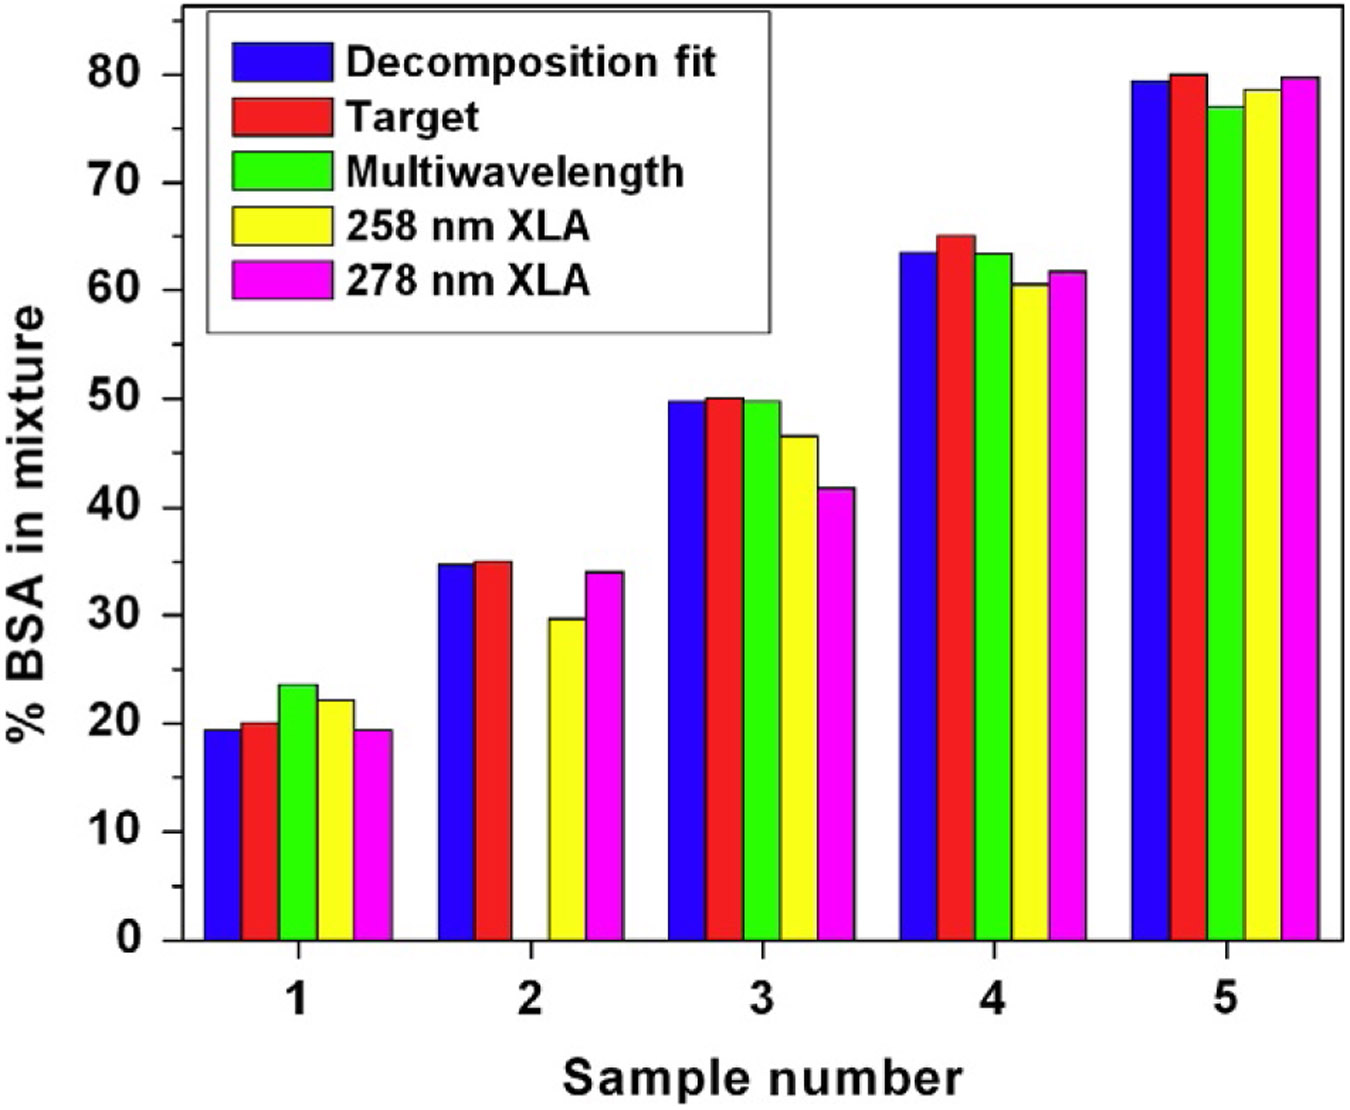
We describe important advances in methodologies for the analysis of multiwavelength data. In contrast to the Beckman-Coulter XL-A/I ultraviolet-visible light detector, multiwavelength detection is able to simultaneously collect sedimentation data for a large wavelength range in a single experiment. The additional dimension increases the data density by orders of magnitude, posing new challenges for data analysis and management. The additional data not only improve the statistics of the measurement but also provide new information for spectral characterization, which complements the hydrodynamic information. New data analysis and management approaches were integrated into the UltraScan software to address these challenges. In this chapter, we describe the enhancements and benefits realized by multiwavelength analysis and compare the results to those obtained from the traditional single-wavelength detector. We illustrate the advances offered by the new instruments by comparing results from mixtures that contain different ratios of protein and DNA samples, representing analytes with distinct spectral and hydrodynamic properties. For the first time, we demonstrate that the spectral dimension not only adds valuable detail, but when spectral properties are known, individual components with distinct spectral properties measured in a mixture by the multiwavelength system can be clearly separated and decomposed into traditional datasets for each of the spectrally distinct components, even when their sedimentation coefficients are virtually identical.

Keywords: Analytical ultracentrifugation; Hydrodynamic analysis; Multiwavelength detector; Optical detector development; Spectral analysis; UV–Vis absorbance.


Figures

Figure 1
Figure 1
Three-dimensional view of scan 35 from a multiwavelength sedimentation velocity experiment of BSA (top) and scan 16 from a mixture of DNA fragments (bottom) measured between 240 and 310 nm.The meniscus is clearly visible at ~6.0 cm. For BSA, an absorbance maximum is visible at 278 nm from tyrosine and tryptophan residues, and below 250 nm absorbance from the peptide backbone increases for BSA, while a 258 nm peak typical for DNA results in a pronounced difference between the two biological macromolecules.
Figure 2
Figure 2
3D view of the sedimentation profile as a function of wavelength for the 50:50 DNA-BSA mixture after 2DSA-Monte Carlo analysis. The protein absorbance spectrum at 4.3 S (two yellow (white in the print version) peaks) can be clearly distinguished from the DNA peak with absorbance maximum around 258 nm. Minor species can be identified based on their spectrum.
Figure 3
Figure 3
Projection view of the 2DSA-Monte Carlo sedimentation profile as a function of wavelength for the 50:50 DNA–BSA mixture. Remarkably, the protein absorbance spectrum at 4.3 S (two yellow peaks) can be clearly distinguished from the adjacent DNA peak with absorbance maximum around 258 nm, despite the proximity of the peaks (4.5 S vs. 5.2 S). Minor species can be identified based on their spectra. The straight lines attest to the high resolution and robustness of this approach to fit multiwavelength data (each wavelength is separately analyzed).
Figure 4
Figure 4
3D plot of a globally combined s vs. ff0 distribution for a 50:50 mixture of BSA and DNA fragments. Data collected on a Beckman-Coulter XL-A, at 258 and 278 nm. Data from three repeat experiments and from each wavelength were combined to generate this global view.
Figure 5
Figure 5
van Holde–Weischet integral distribution plots with boundary fractions scaled to the total concentration measured at each wavelength from the BSA–DNA 50:50 mixture. The shape of the BSA extinction profile is clearly visible at 4 S, and the DNA peak for the larger fragment shows maximum contribution around 258 nm at 11 S.
Figure 6
Figure 6
van Holde–Weischet differential distribution projection plot as a function of wavelength for the BSA–DNA 50:50 mixture. The asymmetric shape of the peak between 4 and 6 S clearly indicates a heterogeneity in spectral properties originating from the closely sedimenting BSA and 208 bp DNA peaks. On the left side of the peak, the BSA extinction dominates;on the right side of the peak, the DNA extinction profile dominates. The peak at 11 S displays a DNA extinction profile only. The color (different gray shades for the print version) gradient indicates relative concentration.
Figure 7
Figure 7
Global genetic algorithm Monte Carlo analysis of decomposition results obtained from six different DNA and BSA mixtures analyzed on the open AUC MWL instrument (top left) and the dual-wavelength results obtained from the Beckman-Coulter XL-A (right panel). The separate decomposition results for DNA (red) and BSA (blue) are combined in the left panel pseudo-3D plot to illustrate the exceptional separation achieved by spectral decomposition which even separates species with nearly identical sedimentation coefficients (the two major species sedimenting near 5 S). This approach demonstrates the superior resolution obtained from MWL analysis compared to the global two-wavelength analysis performed on the Beckman-Coulter XL-A (right panel, green). Lower panel: differential distributions from the same data shown above (red): decomposition for DNA, blue: decomposition for BSA, green: nonseparated XL-A data for DNA-BSA mixtures globally fitted to genetic algorithm–Monte Carlo analysis. A color representation of this figure is provided in the color plate section to allow the reader to distinguish the DNA and BSA contributions based on color.
Figure 8
Figure 8
Comparison of results from the dual-wavelength AUC/GA analysis with the spectral decomposition method to ascertain the relative composition of spectrally different components in mixtures. The results clearly show that the spectral decomposition achieves even higher fidelity in reproducing the known target values than single-wavelength AUC/GA. Samples 1–5 refer to ratios of 20%, 35%, 50%, 65%, and 80% BSA in a BSA:DNA mixture with average errors of around 0.7%. Errors observed from the decomposition MWLD analysis results are on par with the spectral decompositions of the Genesys spectrophotometer data and are at least as good as the data obtained from the Beckman-Coulter XL-A.

References

    1. Bhattacharyya SK, Maciejewska P, Börger L, Stadler M, Gülsün AM, Cicek HB, et al. (2006). Development of fast fiber based UV-Vis multiwavelength detector for an ultracentrifuge. Progress in Colloid and Polymer Science, 131, 9–22.
    1. Brookes E, Boppana RV, & Demeler B (2006). Computing large sparse multivariate optimization problems with an application in biophysics. In Supercomputing ‘06 ACM 0-7695-2700-0/06.
    1. Brookes E, Cao W, & Demeler B (2010). A two-dimensional spectrum analysis for sedimentation velocity experiments of mixtures with heterogeneity in molecular weight and shape. European Biophysics Journal, 39(3), 405–414. - PubMed
    1. Brookes E, & Demeler B (2006). Genetic algorithm optimization for obtaining accurate molecular weight distributions from sedimentation velocity experiments. In Wandrey C & Cölfen H (Eds.), Progress in Colloid and Polymer Science: 131. Analytical ultracentrifugation VIII (pp. 33–40): Berlin Heidelberg: Springer-Verlag. 10.1007/2882_004. - DOI
    1. Brookes E, & Demeler B (2007). Parsimonious regularization using genetic algorithms applied to the analysis of analytical ultracentrifugation experiments. In GECCO proceedings ACM 978-1-59593-697-4/07/0007.

Publication types

LinkOut - more resources