. 2015 Sep 28;10(9):e0139073.
doi: 10.1371/journal.pone.0139073. eCollection 2015.

Immune and Inflammatory Cell Composition of Human Lung Cancer Stroma

Affiliations

Immune and Inflammatory Cell Composition of Human Lung Cancer Stroma

G-Andre Banat et al. PLoS One. .

Abstract

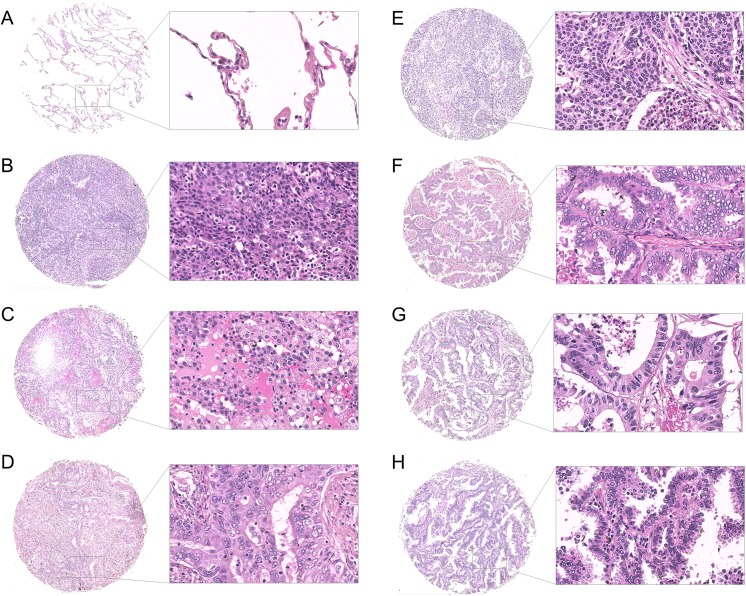
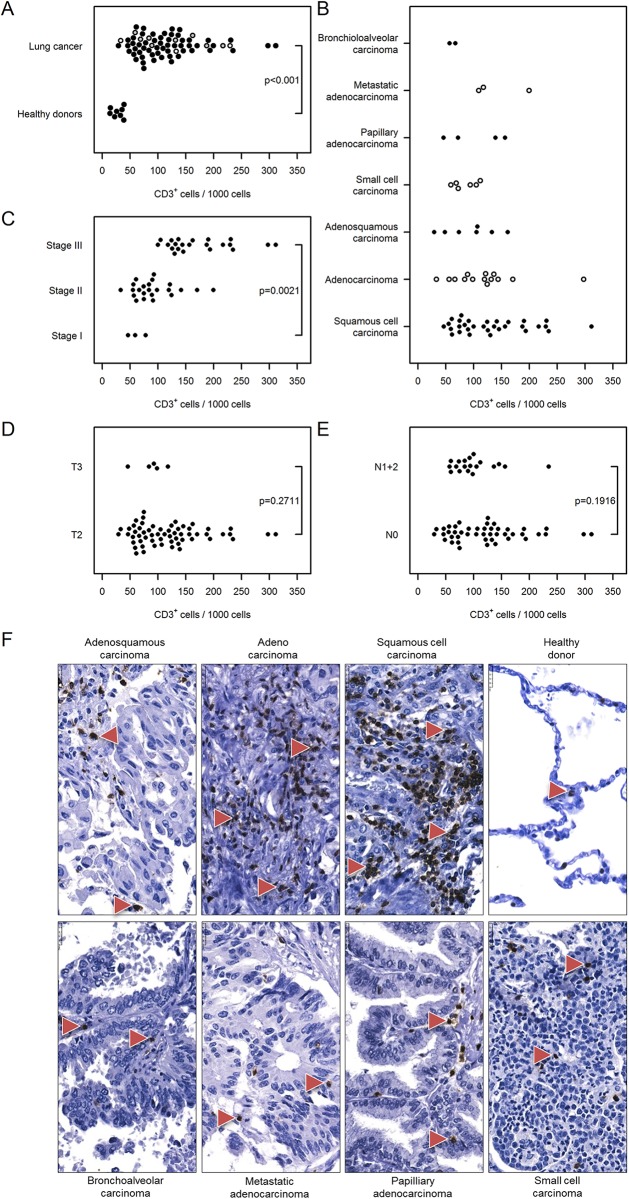
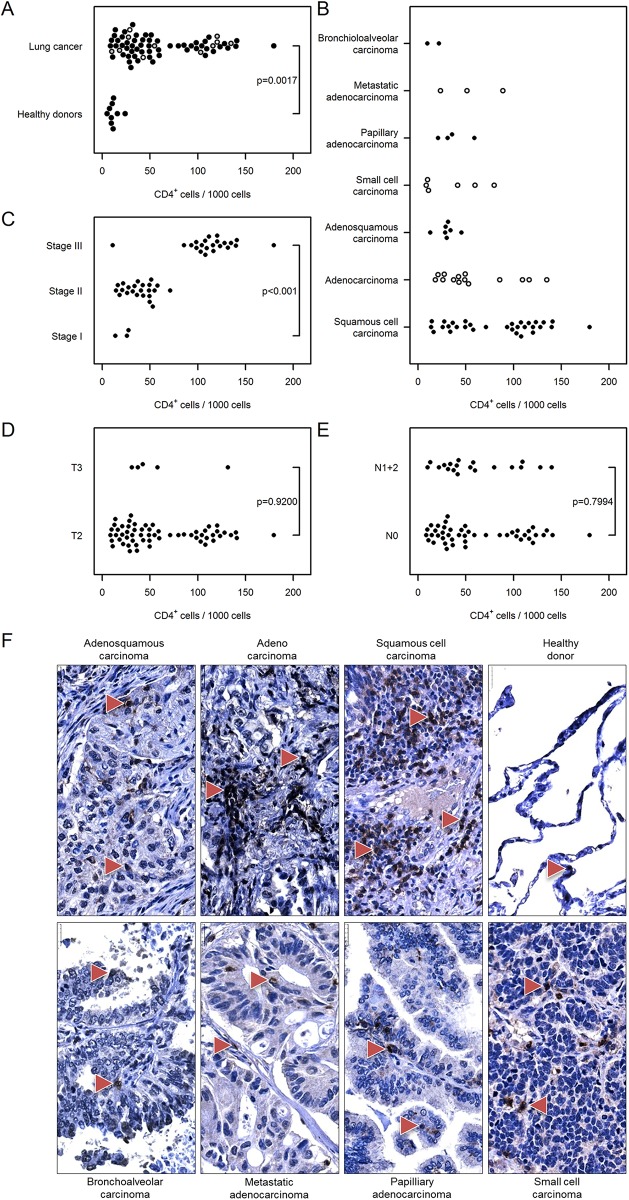
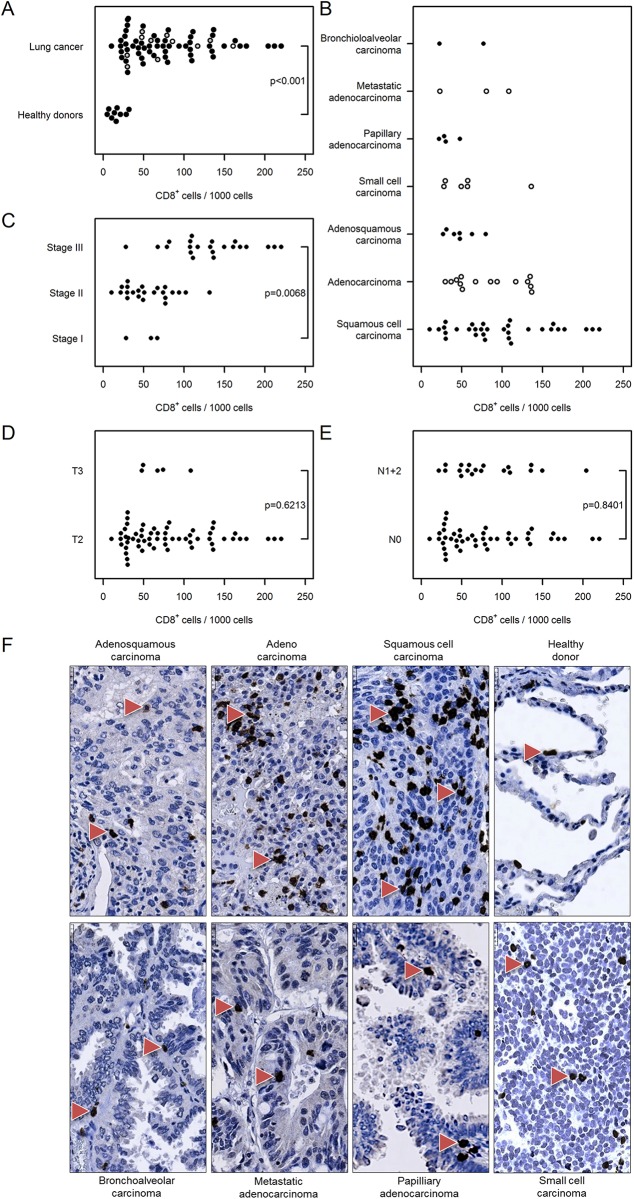
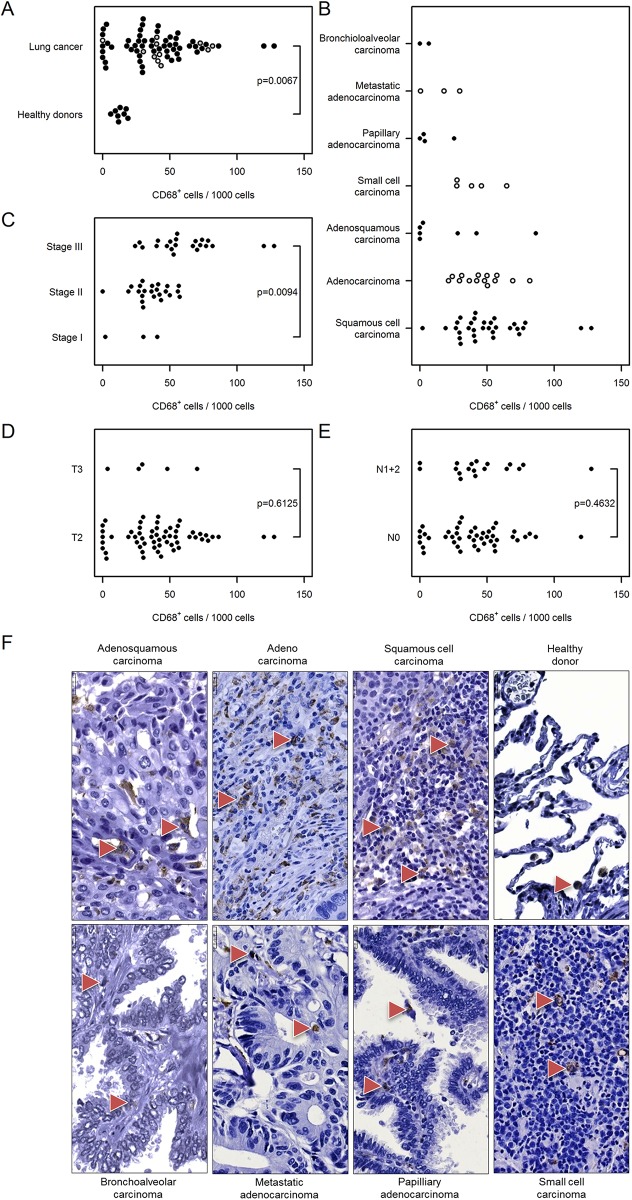
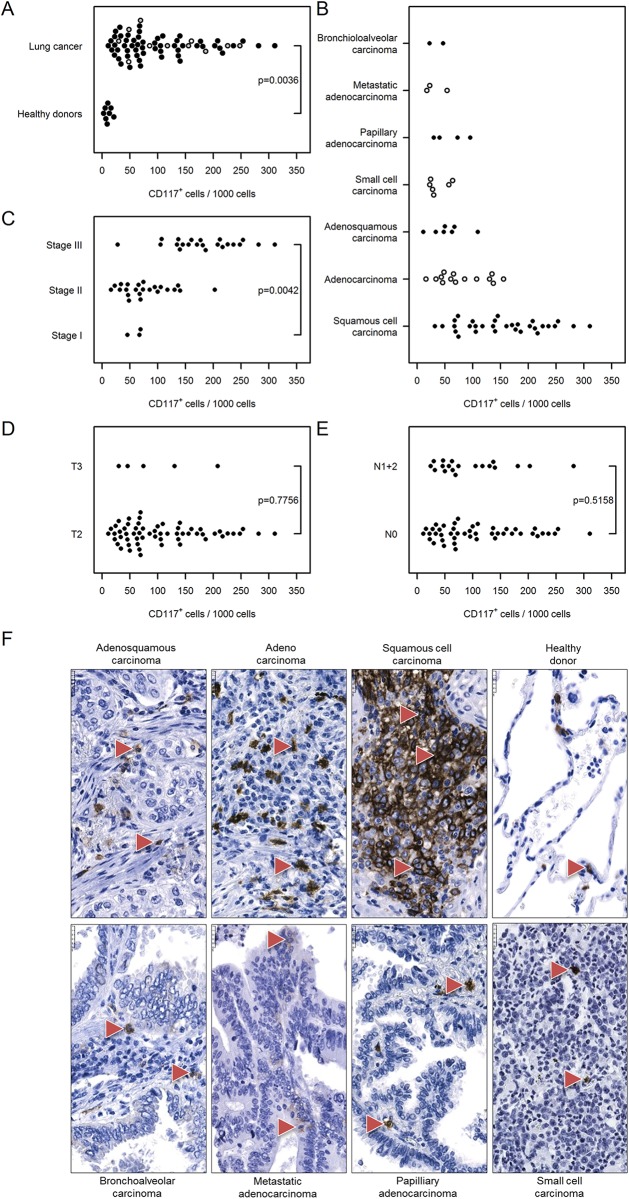
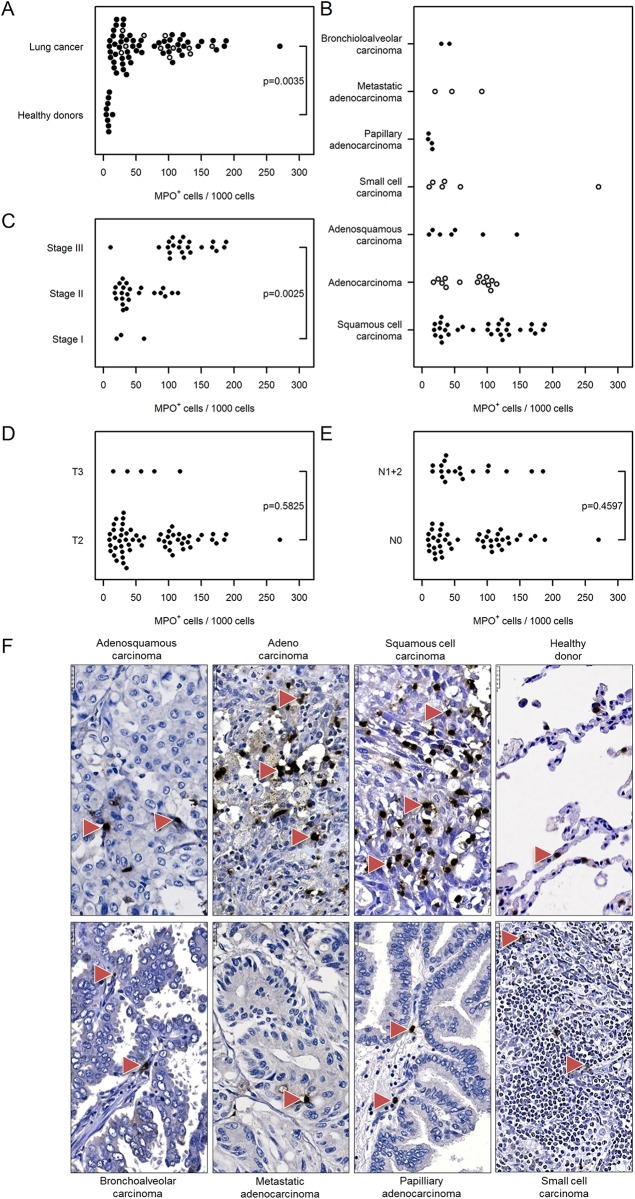
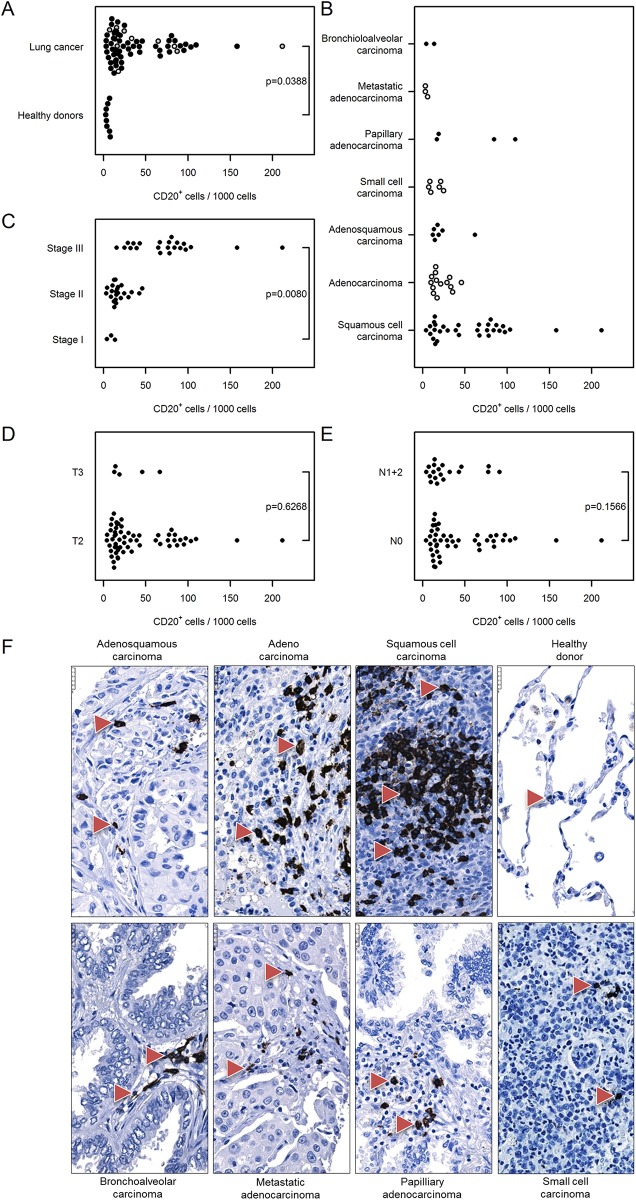
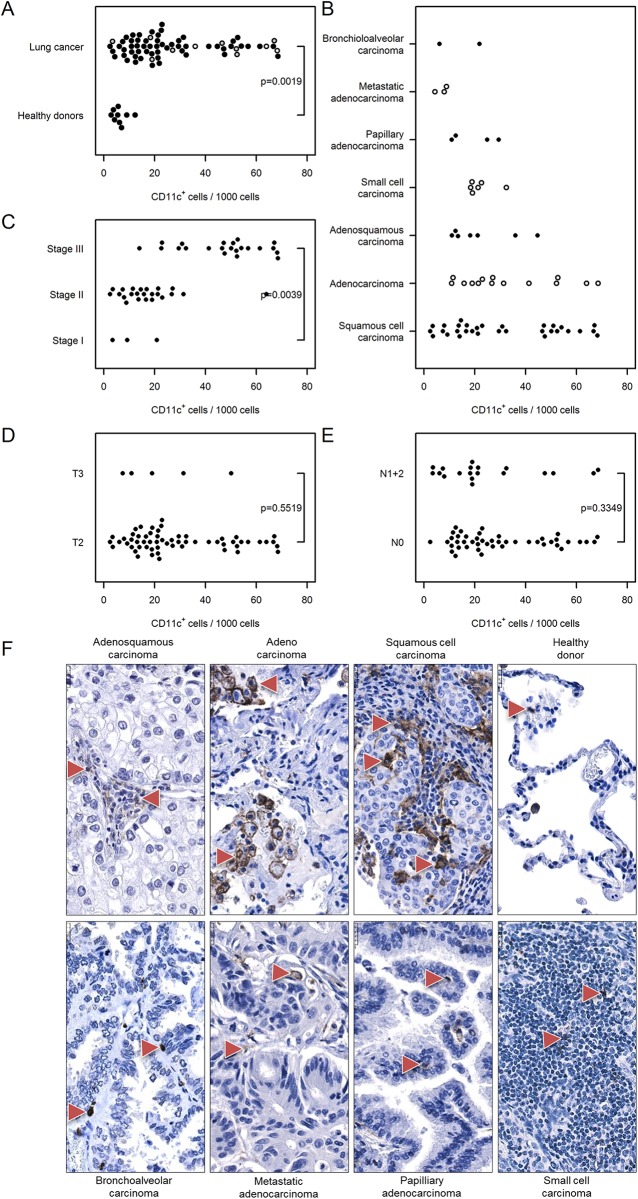
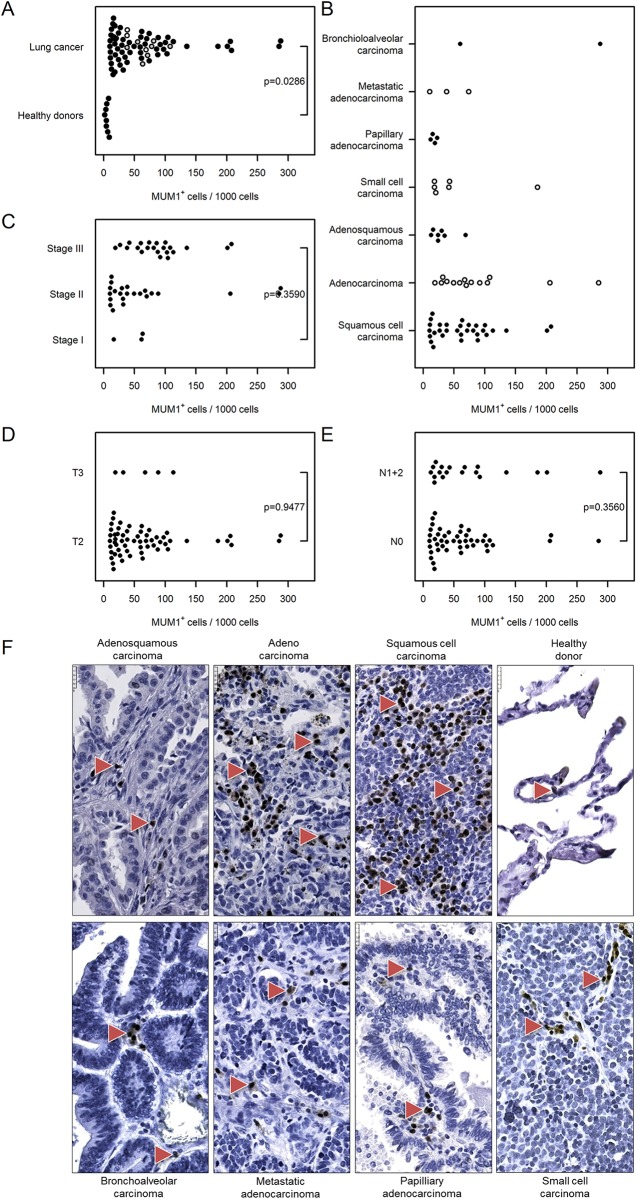
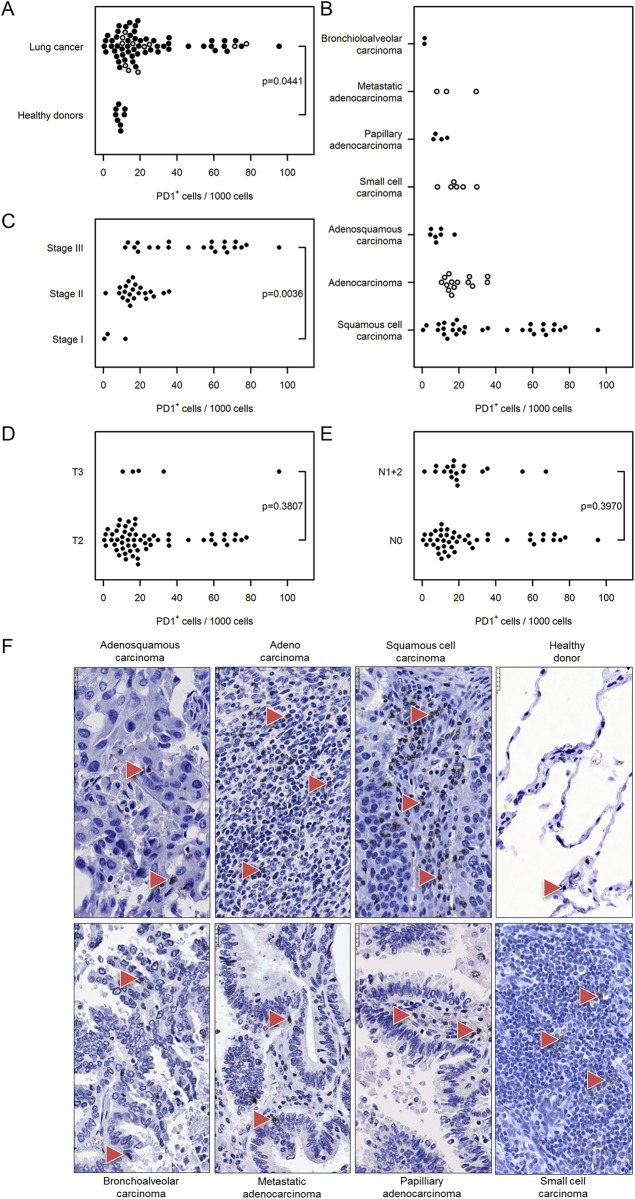
Recent studies indicate that the abnormal microenvironment of tumors may play a critical role in carcinogenesis, including lung cancer. We comprehensively assessed the number of stromal cells, especially immune/inflammatory cells, in lung cancer and evaluated their infiltration in cancers of different stages, types and metastatic characteristics potential. Immunohistochemical analysis of lung cancer tissue arrays containing normal and lung cancer sections was performed. This analysis was combined with cyto-/histomorphological assessment and quantification of cells to classify/subclassify tumors accurately and to perform a high throughput analysis of stromal cell composition in different types of lung cancer. In human lung cancer sections we observed a significant elevation/infiltration of total-T lymphocytes (CD3+), cytotoxic-T cells (CD8+), T-helper cells (CD4+), B cells (CD20+), macrophages (CD68+), mast cells (CD117+), mononuclear cells (CD11c+), plasma cells, activated-T cells (MUM1+), B cells, myeloid cells (PD1+) and neutrophilic granulocytes (myeloperoxidase+) compared with healthy donor specimens. We observed all of these immune cell markers in different types of lung cancers including squamous cell carcinoma, adenocarcinoma, adenosquamous cell carcinoma, small cell carcinoma, papillary adenocarcinoma, metastatic adenocarcinoma, and bronchioloalveolar carcinoma. The numbers of all tumor-associated immune cells (except MUM1+ cells) in stage III cancer specimens was significantly greater than those in stage I samples. We observed substantial stage-dependent immune cell infiltration in human lung tumors suggesting that the tumor microenvironment plays a critical role during lung carcinogenesis. Strategies for therapeutic interference with lung cancer microenvironment should consider the complexity of its immune cell composition.


Conflict of interest statement

Competing Interests: The authors have declared that no competing interests exist.

Figures

Fig 1
Fig 1. Morphological analysis of human lung specimens.
Representative images of human lung sections stained with hematoxylin and eosin based on their pathology. (A) Healthy donor, (B) squamous cell carcinoma, (C) adenocarcinoma, (D) adenosquamous carcinoma, (E) small cell carcinoma, (F) papillary adenocarcinoma, (G) metastatic adenocarcinoma, and (H) bronchioloalveolar carcinoma. Scale bar = 250 μm.
Fig 2
Fig 2. Immunohistochemical analysis and quantification of CD3-positive T lymphocytes in human lung cancer.
Human lung cancer tissue array was stained with CD3 antibody to detect T lymphocytes. (A) Quantification of CD3+ cells in lung cancer vs. healthy donor specimens. (B–E) Quantification of CD3+ cells based on (B) their pathology, (C) cancer stage, (D) tumor size, and (E) nodal status. Cell numbers are given as CD3-positive cells per 1000 cells. (F) Representative images of human lung sections stained with CD3 antibody based on their pathology. Scale bar = 25 μm.
Fig 3
Fig 3. Immunohistochemical analysis and quantification of CD4-positive T lymphocytes in human lung cancer.
Human lung cancer tissue array was stained with CD4 antibody to detect T helper cells. (A) Quantification of CD4+ cells in lung cancer vs. healthy donor specimens. (B–E) Quantification of CD4+ cells based on (B) their pathology, (C) cancer stage, (D) tumor size, and (E) nodal status. Cell numbers are given as CD4-positive cells per 1000 cells. (F) Representative images of human lung sections stained with CD4 antibody based on their pathology. Scale bar = 25 μm.
Fig 4
Fig 4. Immunohistochemical analysis and quantification of CD8-positive T lymphocytes in human lung cancer.
Human lung cancer tissue array was stained with CD8 antibody to detect cytotoxic T lymphocytes. (A) Quantification of CD8+ cells in lung cancer vs. healthy donor specimens. (B–E) Quantification of CD8+ cells based on (B) their pathology, (C) cancer stage, (D) tumor size, and (E) nodal status. Cell numbers are given as CD8-positive cells per 1000 cells. (F) Representative images of human lung sections stained with CD8 antibody based on their pathology. Scale bar = 25 μm.
Fig 5
Fig 5. Immunohistochemical analysis and quantification of CD68-positive cells in human lung cancer.
Human lung cancer tissue array was stained with CD68 antibody to detect macrophages. (A) Quantification of CD68+ cells in lung cancer vs. healthy donor specimens. (B–E) Quantification of CD68+ cells based on (B) their pathology, (C) cancer stage, (D) tumor size, and (E) nodal status. Cell numbers are given as CD68-positive cells per 1000 cells. (F) Representative images of human lung sections stained with CD68 antibody based on their pathology. Scale bar = 25 μm.
Fig 6
Fig 6. Immunohistochemical analysis and quantification of CD117-positive cells in human lung cancer.
Human lung cancer tissue array was stained with CD117 (cKit) antibody to detect mast cells. (A) Quantification of CD117+ cells in lung cancer vs. healthy donor specimens. (B–E) Quantification of CD117+ cells based on (B) their pathology, (C) cancer stage, (D) tumor size, and (E) nodal status. Cell numbers are given as CD117-positive cells per 1000 cells. (F) Representative images of human lung sections stained with CD117 antibody based on their pathology. Scale bar = 25 μm.
Fig 7
Fig 7. Immunohistochemical analysis and quantification of MPO-positive cells in human lung cancer.
Human lung cancer tissue array was stained with MPO antibody to detect neutrophil granulocytes. (A) Quantification of MPO+ cells in lung cancer vs. healthy donor specimens. (B–E) Quantification of MPO+ cells based on (B) their pathology, (C) cancer stage, (D) tumor size, and (E) nodal status. Cell numbers are given as MPO-positive cells per 1000 cells. (F) Representative images of human lung sections stained with MPO antibody based on their pathology. Scale bar = 25 μm.
Fig 8
Fig 8. Immunohistochemical analysis and quantification of CD20-positive cells in human lung cancer.
Human lung cancer tissue array was stained with CD20 antibody to detect B cells. (A) Quantification of CD20+ cells in lung cancer vs. healthy donor specimens. (B–E) Quantification of CD20+ cells based on (B) their pathology, (C) cancer stage, (D) tumor size, and (E) nodal status. Cell numbers are given as CD20-positive cells per 1000 cells. (F) Representative images of human lung sections stained with CD20 antibody based on their pathology. Scale bar = 25 μm.
Fig 9
Fig 9. Immunohistochemical analysis and quantification of CD11c-positive cells in human lung cancer.
Human lung cancer tissue array was stained with CD11c antibody to detect dendritic cells. (A) Quantification of CD11c+ cells in lung cancer vs. healthy donor specimens. (B–E) Quantification of CD11c+ cells based on (B) their pathology, (C) cancer stage, (D) tumor size, and (E) nodal status. Cell numbers are given as CD11c-positive cells per 1000 cells. (F) Representative images of human lung sections stained with CD11c antibody based on their pathology. Scale bar = 25 μm.
Fig 10
Fig 10. Immunohistochemical analysis and quantification of MUM1–positive cells in human lung cancer.
Human lung cancer tissue array was stained with MUM1 antibody to detect plasma cells and activated T cells. (A) Quantification of MUM1+ cells in lung cancer vs. healthy donor specimens. (B–E) Quantification of MUM1+ cells based on (B) their pathology, (C) cancer stage, (D) tumor size, and (E) nodal status. Cell numbers are given as MUM1–positive cells per 1000 cells. (F) Representative images of human lung sections stained with MUM1 antibody based on their pathology. Scale bar = 25 μm.
Fig 11
Fig 11. Immunohistochemical analysis and quantification of PD1–positive cells in human lung cancer.
Human lung cancer tissue array was stained with PD1 antibody to detect activated T cells, B cells, myeloid cells, and a subset of thymocytes. (A) Quantification of PD1+ cells in lung cancer vs. healthy donor specimens. (B–E) Quantification of PD1+ cells based on (B) their pathology, (C) cancer stage, (D) tumor size, and (E) nodal status. Cell numbers are given as PD1–positive cells per 1000 cells. (F) Representative images of human lung sections stained with PD1 antibody based on their pathology. Scale bar = 25 μm.

References

    1. Siegel R, Naishadham D, Jemal A. Cancer statistics, 2013. CA Cancer J Clin. 2013;63(1):11–30. 10.3322/caac.21166 . - DOI - PubMed
    1. Jemal A, Bray F, Center MM, Ferlay J, Ward E, Forman D. Global cancer statistics. CA: a cancer journal for clinicians. 2011;61(2):69–90. Epub 2011/02/08. 10.3322/caac.20107 . - DOI - PubMed
    1. Nana-Sinkam SP, Powell CA. Molecular biology of lung cancer: Diagnosis and management of lung cancer, 3rd ed: American College of Chest Physicians evidence-based clinical practice guidelines. Chest. 2013;143(5 Suppl):e30S–9S. Epub 2013/05/10. 10.1378/chest.12-2346 - DOI - PMC - PubMed
    1. Lorenz J, Friedberg T, Paulus R, Oesch F, Ferlinz R. Oncogene overexpression in non-small-cell lung cancer tissue: prevalence and clinicopathological significance. Clin Investig. 1994;72(2):156–63. . - PubMed
    1. Peifer M, Fernandez-Cuesta L, Sos ML, George J, Seidel D, Kasper LH, et al. Integrative genome analyses identify key somatic driver mutations of small-cell lung cancer. Nat Genet. 2012;44(10):1104–10. 10.1038/ng.2396 . - DOI - PMC - PubMed

Publication types